Macros, Markets and Munis
Municipals posted negative returns last week as Treasury yields moved 4-16 basis points higher across the curve. The municipal yield curve only followed suit in longer maturities, with shorter-term municipal yields moving lower despite record supply conditions. Economic trends did not show signs of further slowing last week as the nonfarm payrolls came in higher than expected with 139,000 jobs and the unemployment rate remained unchanged at 4.2%. This week we highlight the elevated supply observed this month (and year).
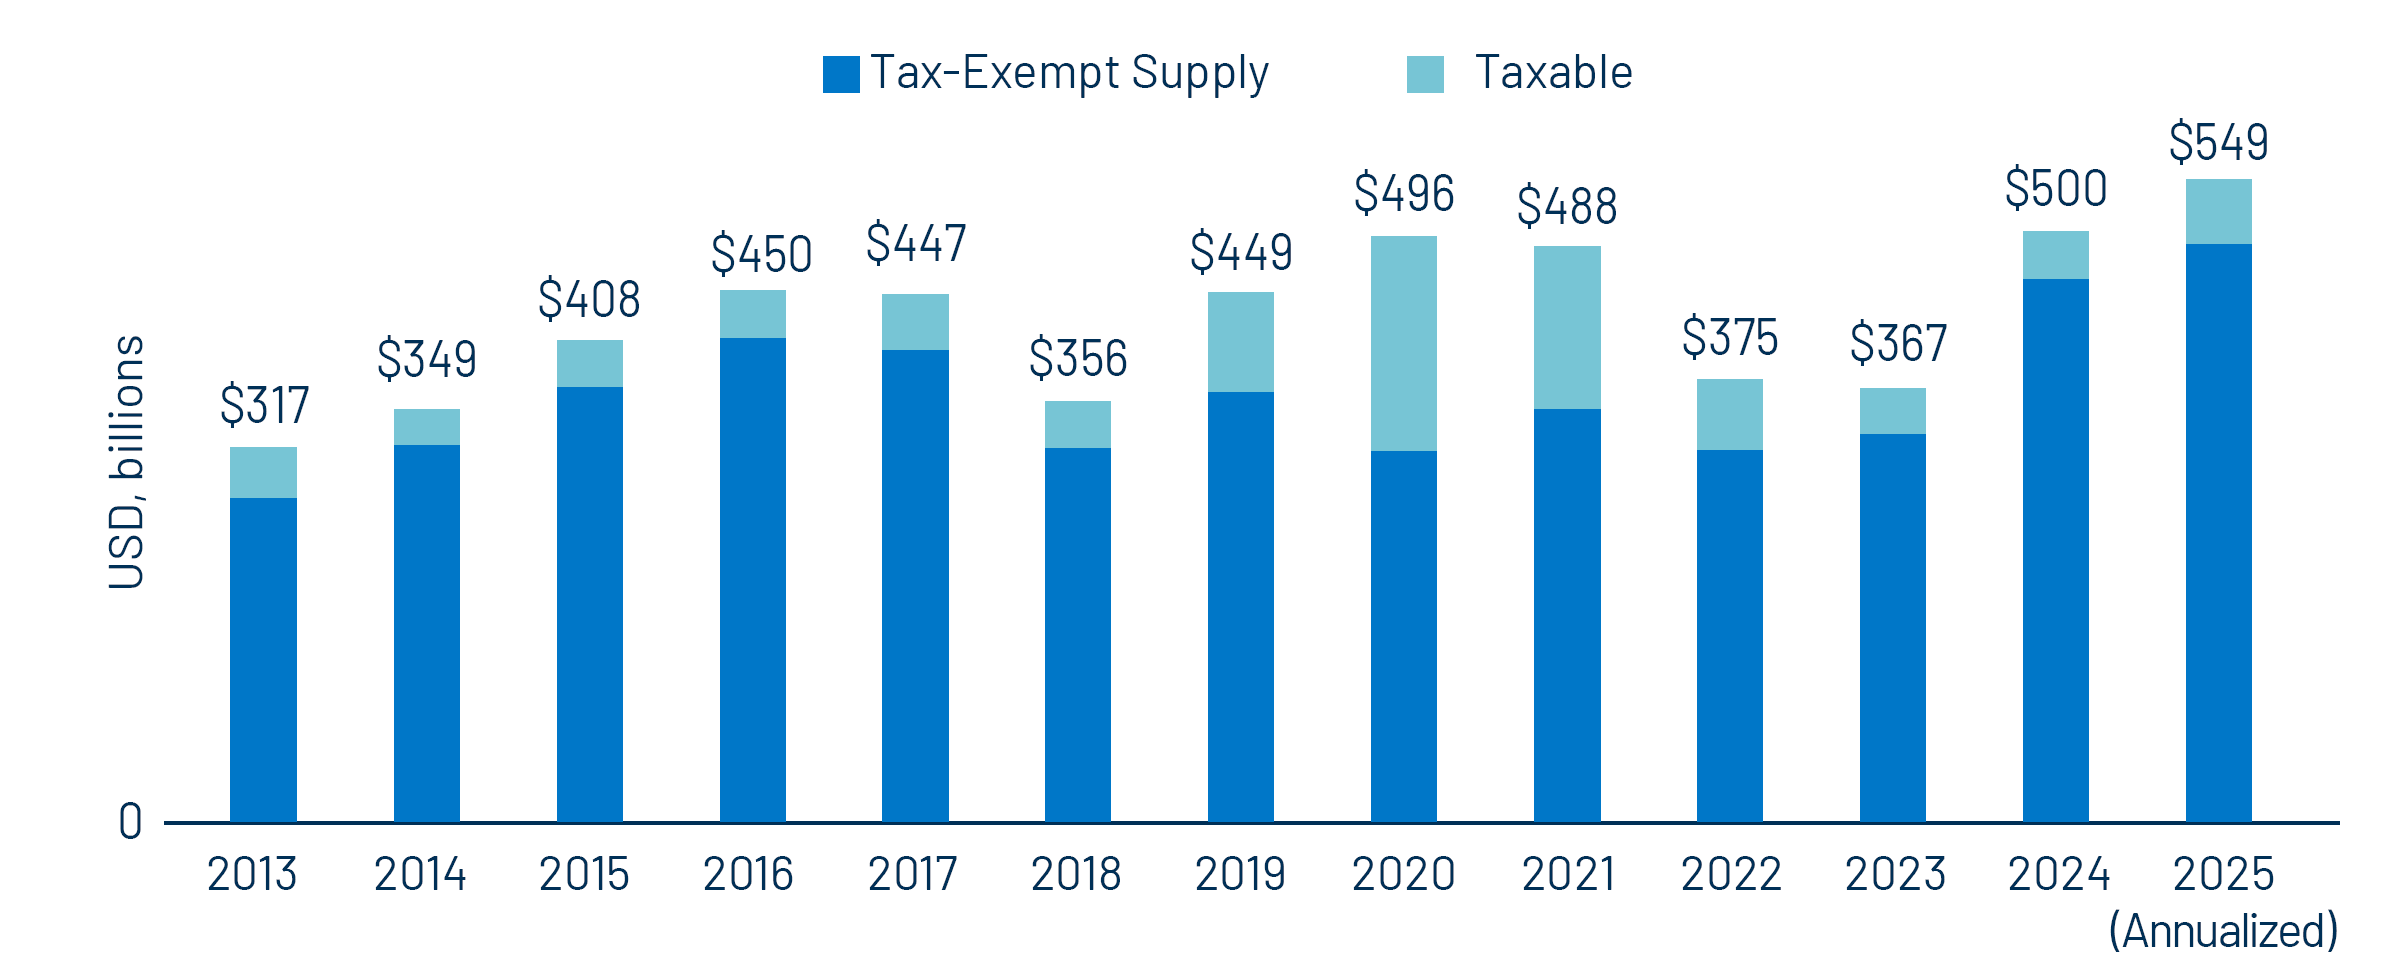
Muni Issuance Ranked the Second Highest on Record
Fund Flows (up $426 million): During the week ending June 4, weekly reporting municipal mutual funds recorded $426 million of net inflows, according to Lipper. Long-term funds recorded $45 million of inflows, intermediate funds recorded $110 million of inflows and high-yield funds recorded $281 million of inflows. Last week marks a sixth consecutive week of positive flows to munis and led year-to-date (YTD) inflows higher to $8 billion. In addition to the week of inflows, seasonally elevated coupon reinvestment helped absorb elevated supply levels in the market.
Supply (YTD supply of $243 billion; up 27% YoY): The muni market recorded over $20 billion of new-issue supply last week, the second highest week of issuance on record, according to Bloomberg data. This week’s calendar is expected to remain elevated at $19 billion. The largest deals include $700 million Los Angeles County Revenue Anticipation Notes and $659 million Blackbelt Energy Gas District transactions.
This Week in Munis: Surging Supply
Last week’s municipal bond issuance reached the second-highest weekly level on record, and this week’s supply is expected to remain elevated. The sustained increase in new issuance builds on last year’s record levels. YTD, the municipal market has recorded $243 billion of new issuance, representing a 27% increase year-over-year (YoY), and a pace that is set to reach $549 billion by year-end.
Western Asset attributes the recent elevated supply conditions to a rebound from the relatively low supply levels seen during the 2022 and 2023 rate hiking cycle, as well as to uncertainties around future federal tax policies. These uncertainties may have prompted issuers to accelerate issuance plans (as previously highlighted in our recent blog post about higher education).
These record supply levels have contributed to municipal market underperformance relative to other fixed-income asset classes this year. However, most market participants were surprised by how well the market absorbed the near-record weekly issuance and outperformance last week. We anticipate that supply could decelerate into July and August, which combined with the current pace of demand, could reverse some of the market underperformance observed earlier in the year.
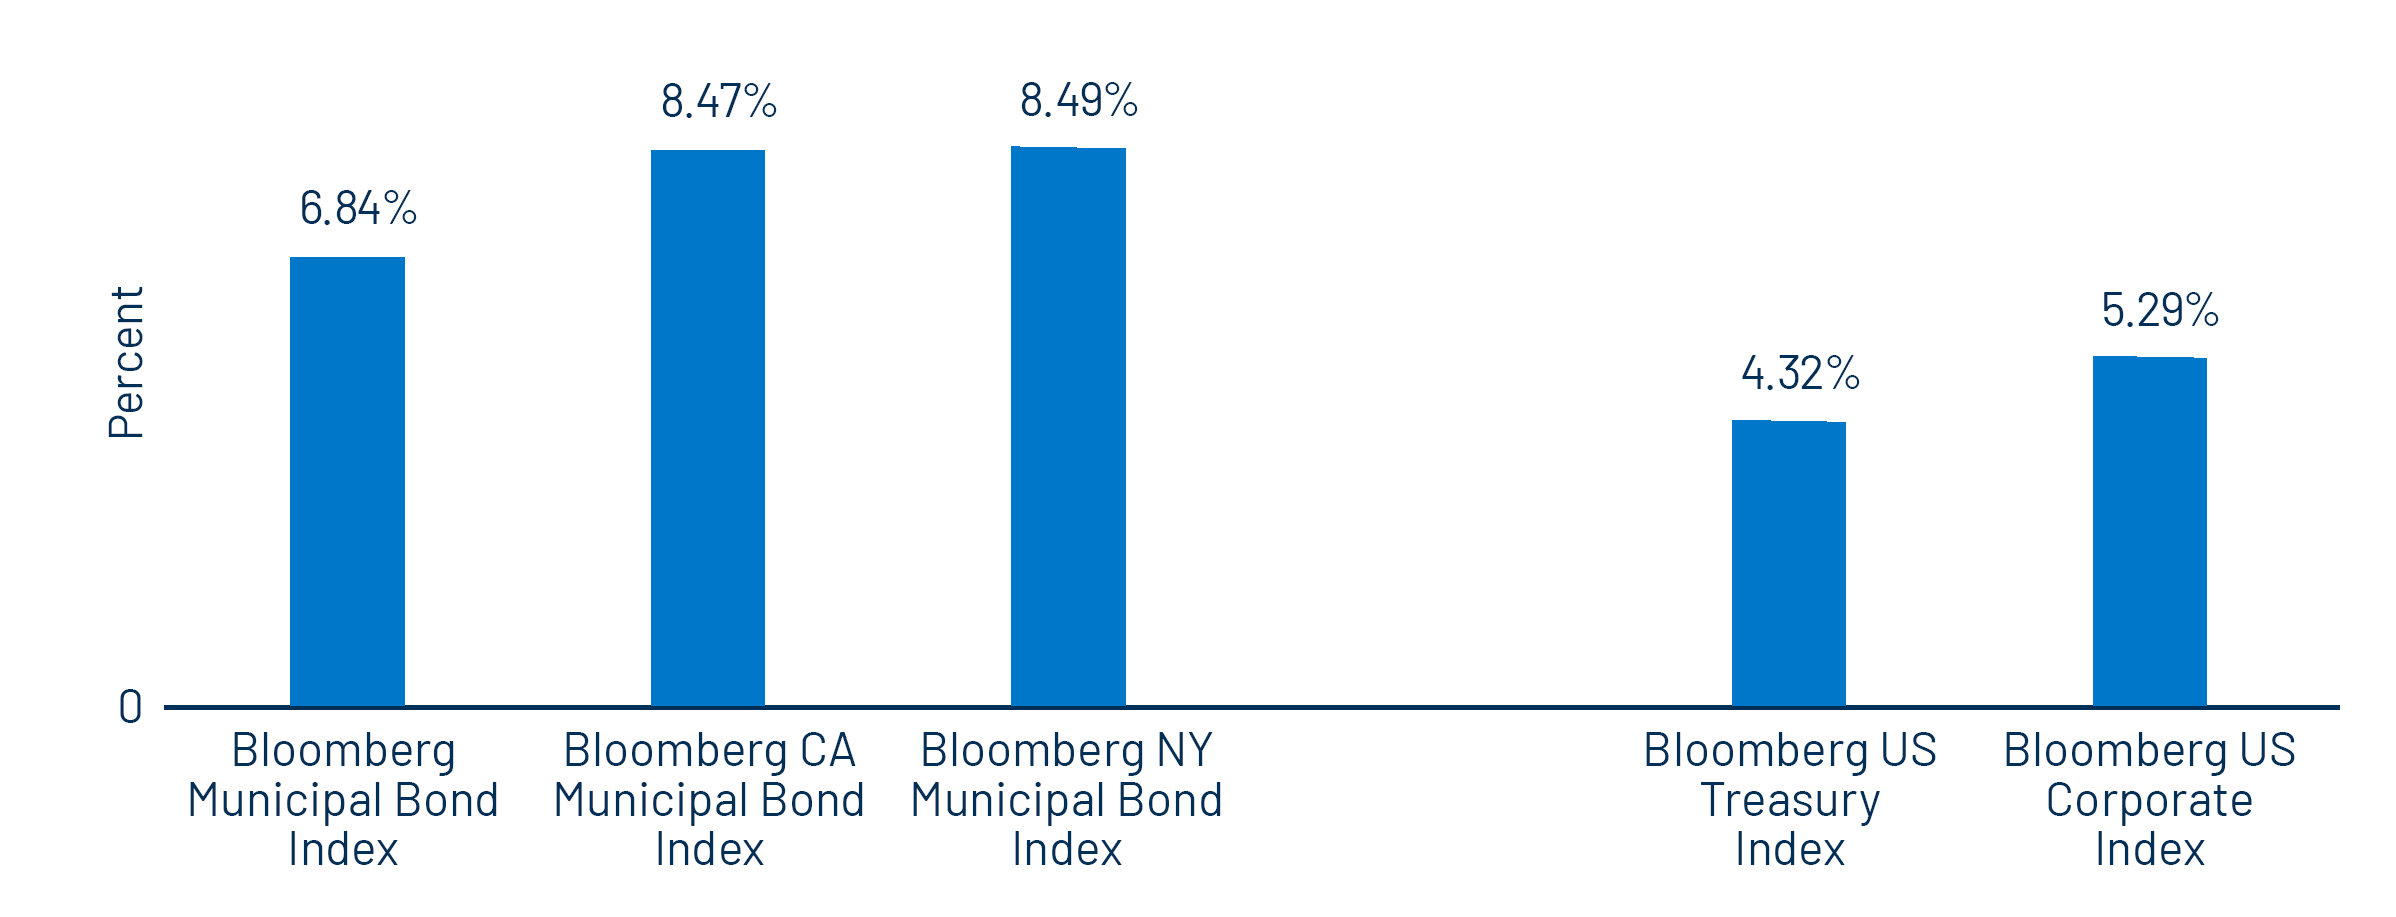
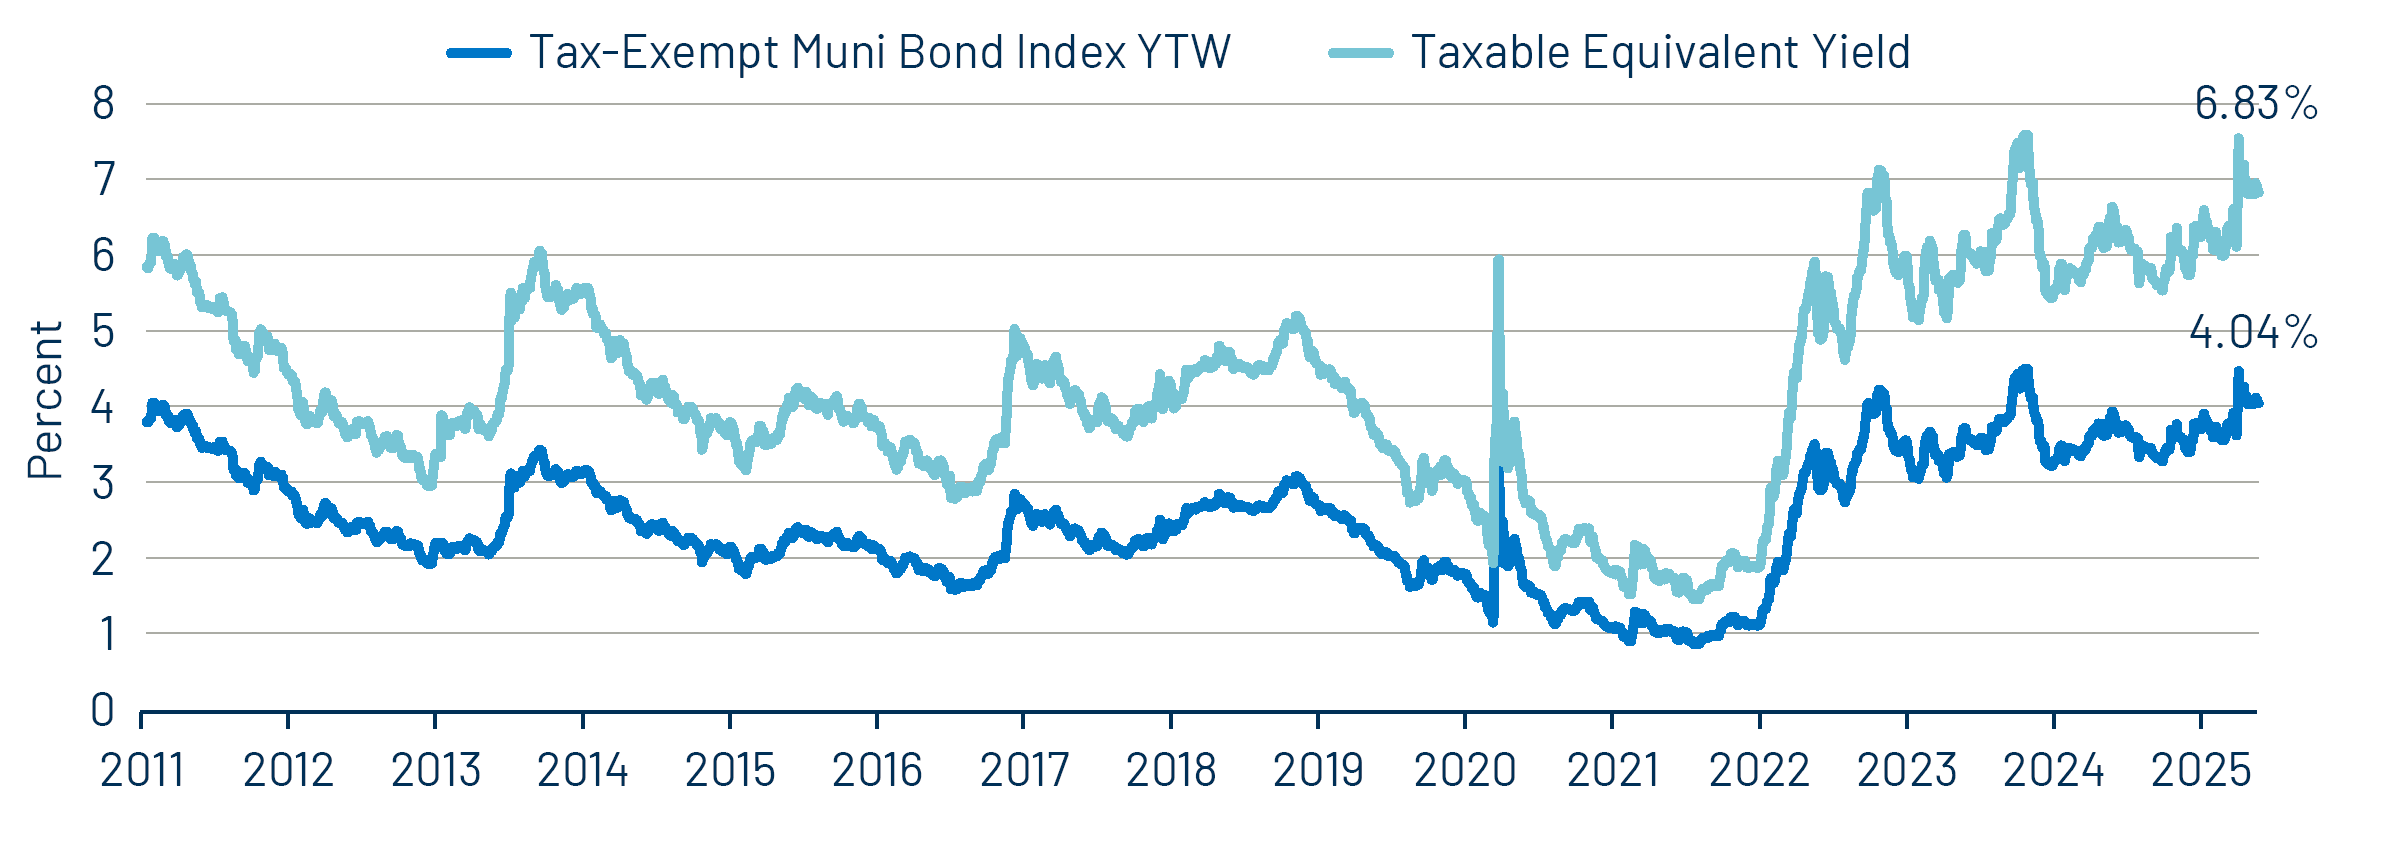
For now, the elevated issuance has delivered attractive tax-exempt income opportunities and after-tax relative value. The Bloomberg Municipal Bond Index, the New York Municipal Bond Index and the California Municipal Bond Index maintain average yields of 4.05%, 4.10% and 3.89%, respectively, which are equivalent to 6.84%, 8.49% and 8.47% on a taxable-equivalent basis for top taxpayers. These taxable-equivalent yield opportunities well exceed other investment-grade fixed-income opportunities, which we expect will help support demand in the back half of the year.
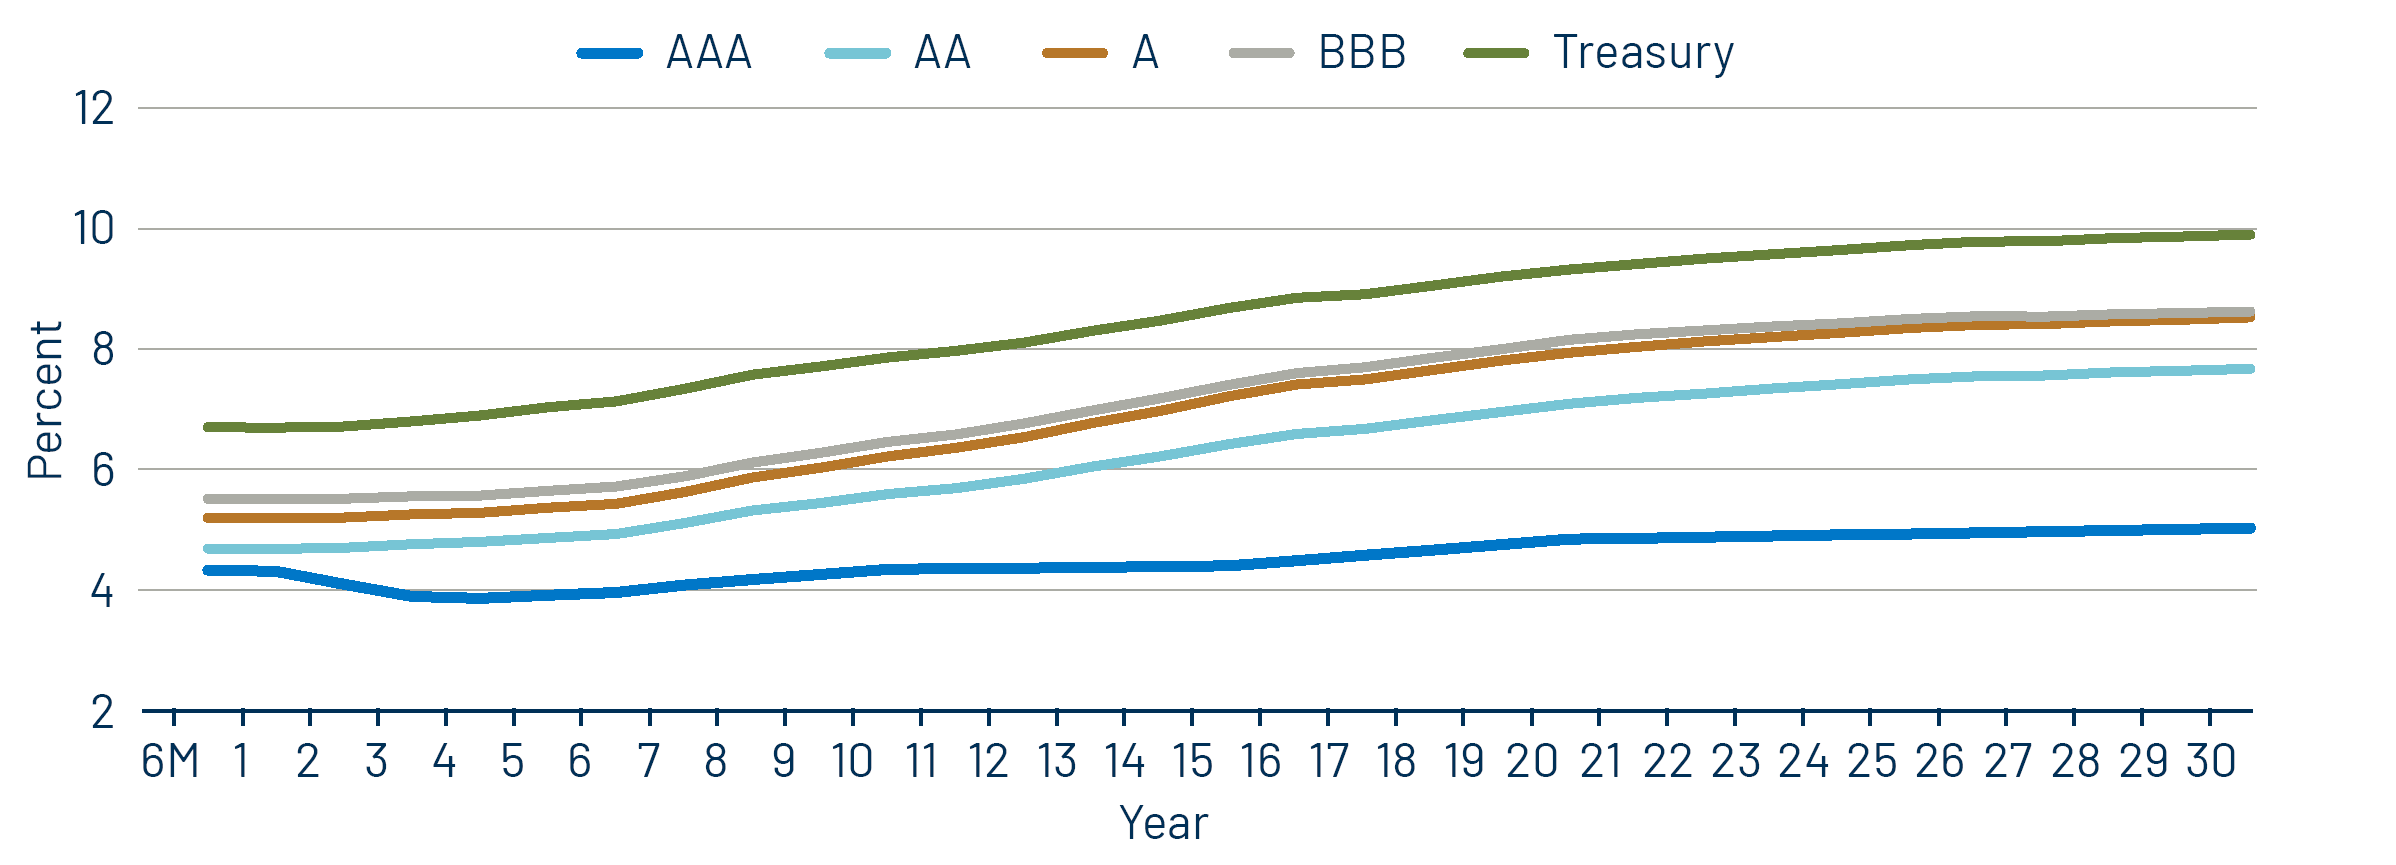
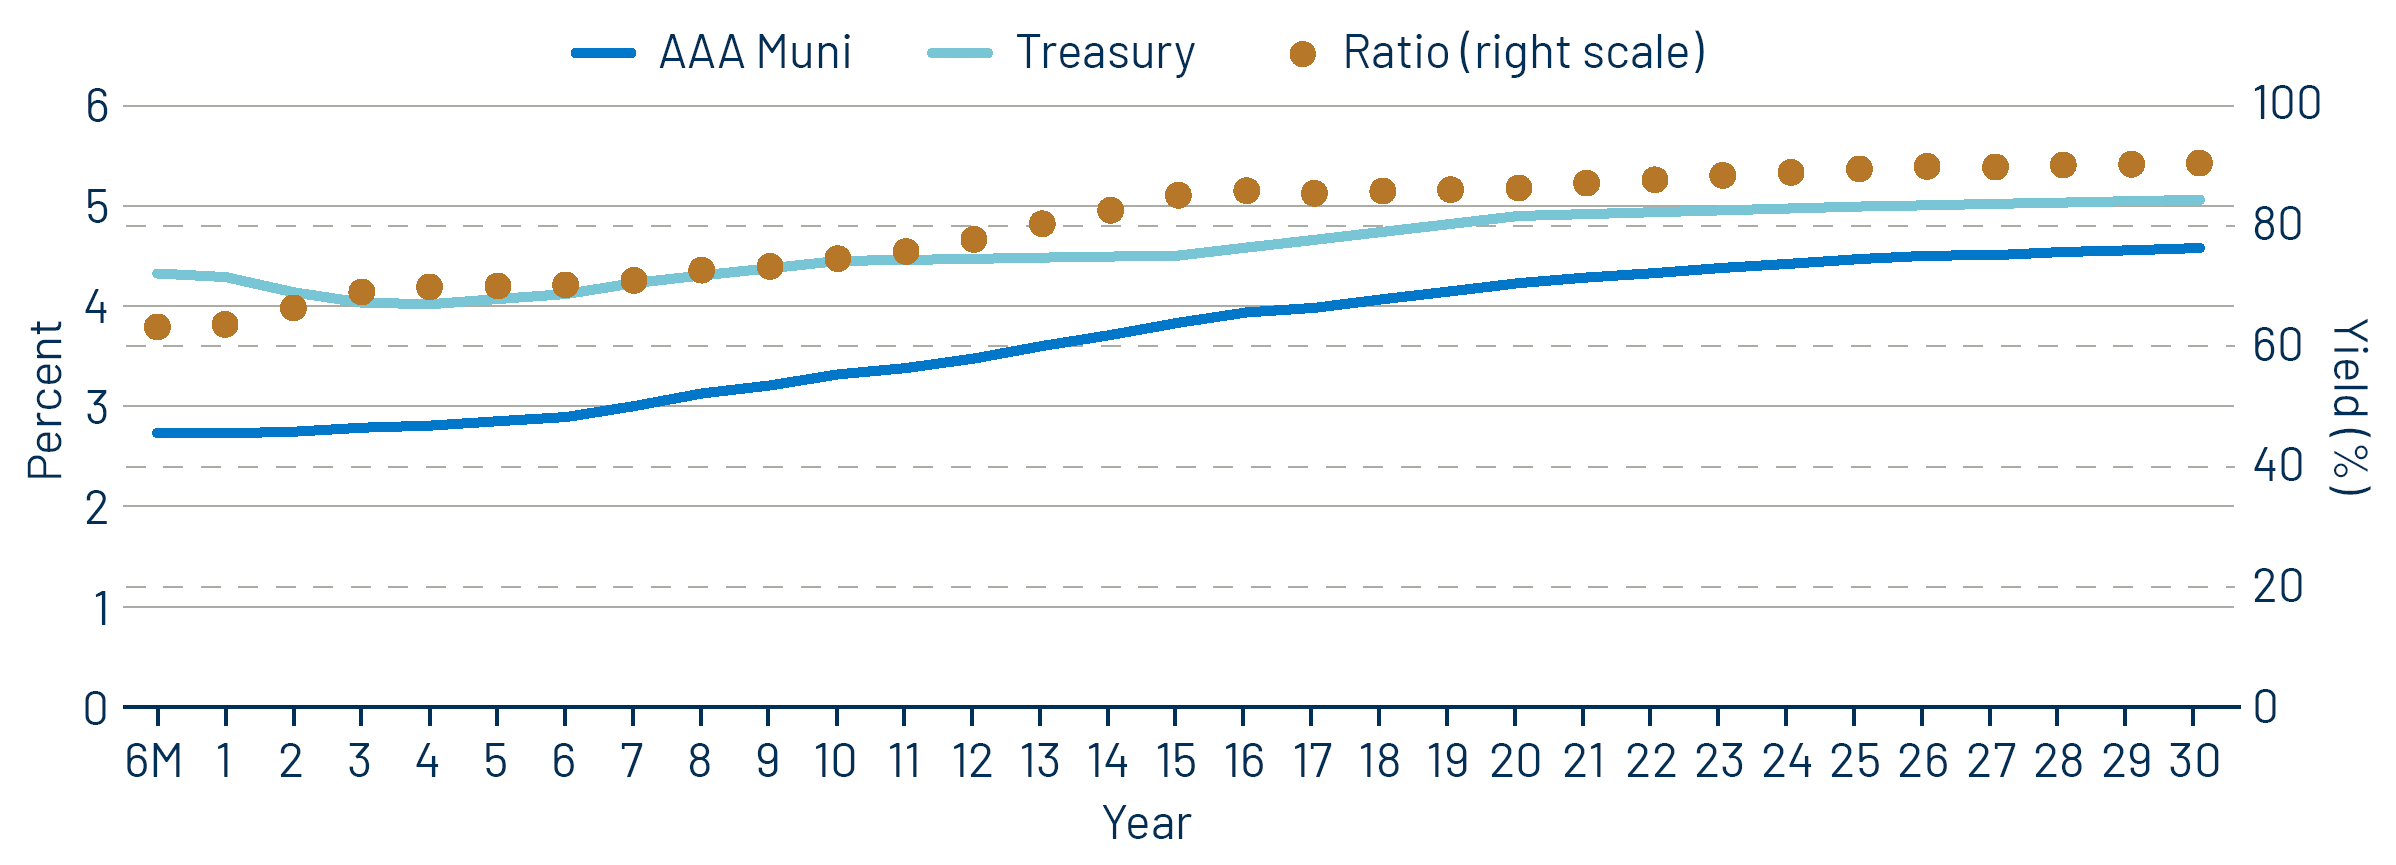
Municipal Credit Curves and Relative Value
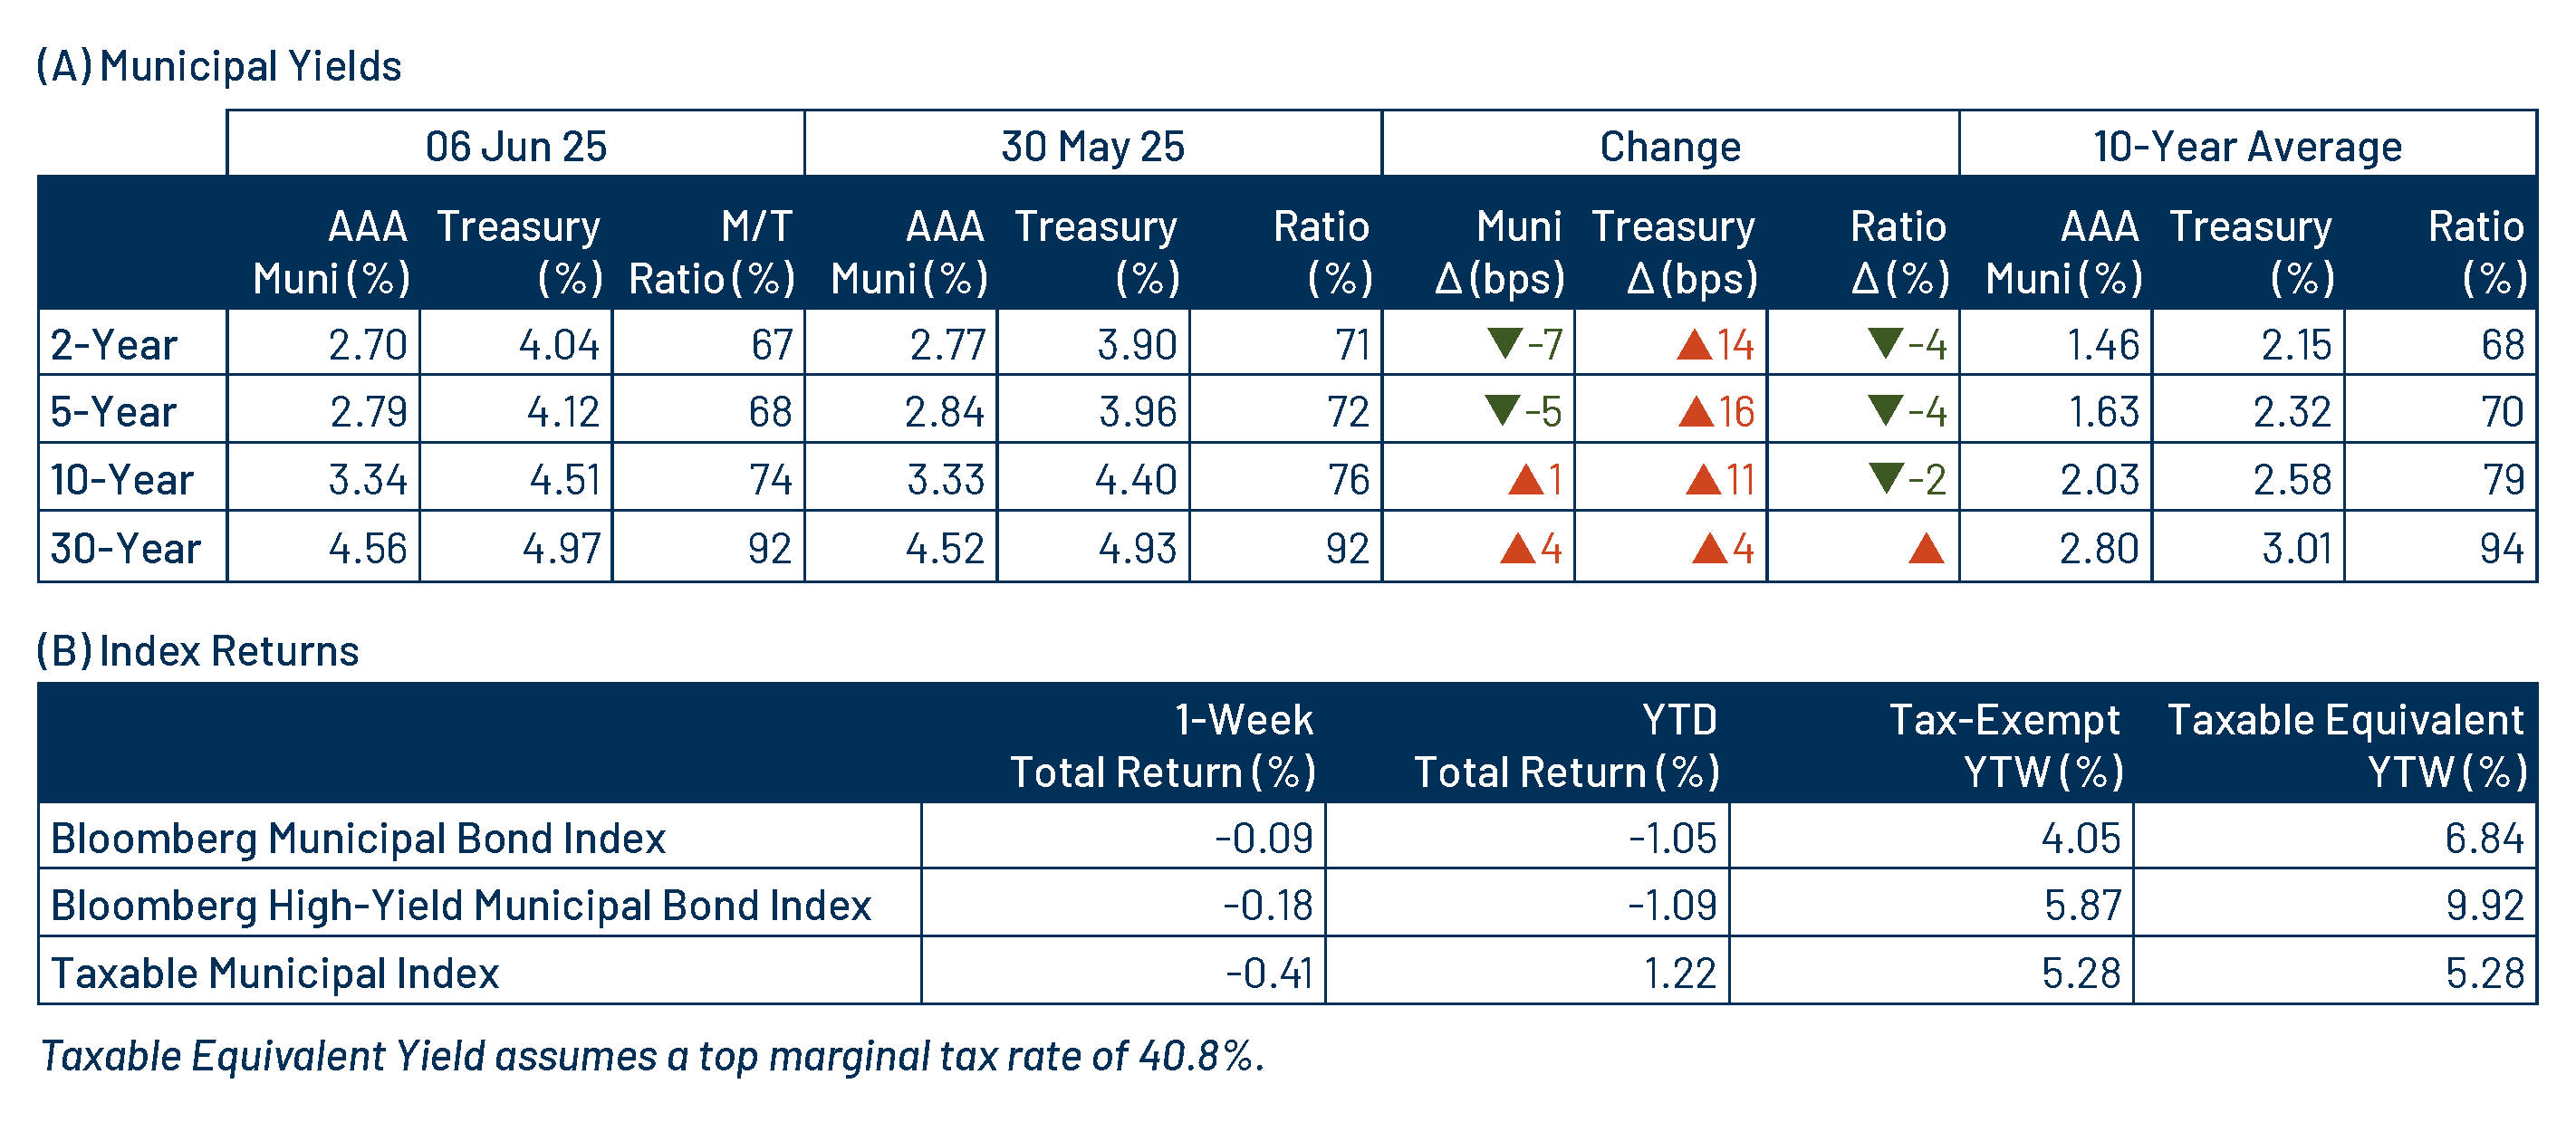
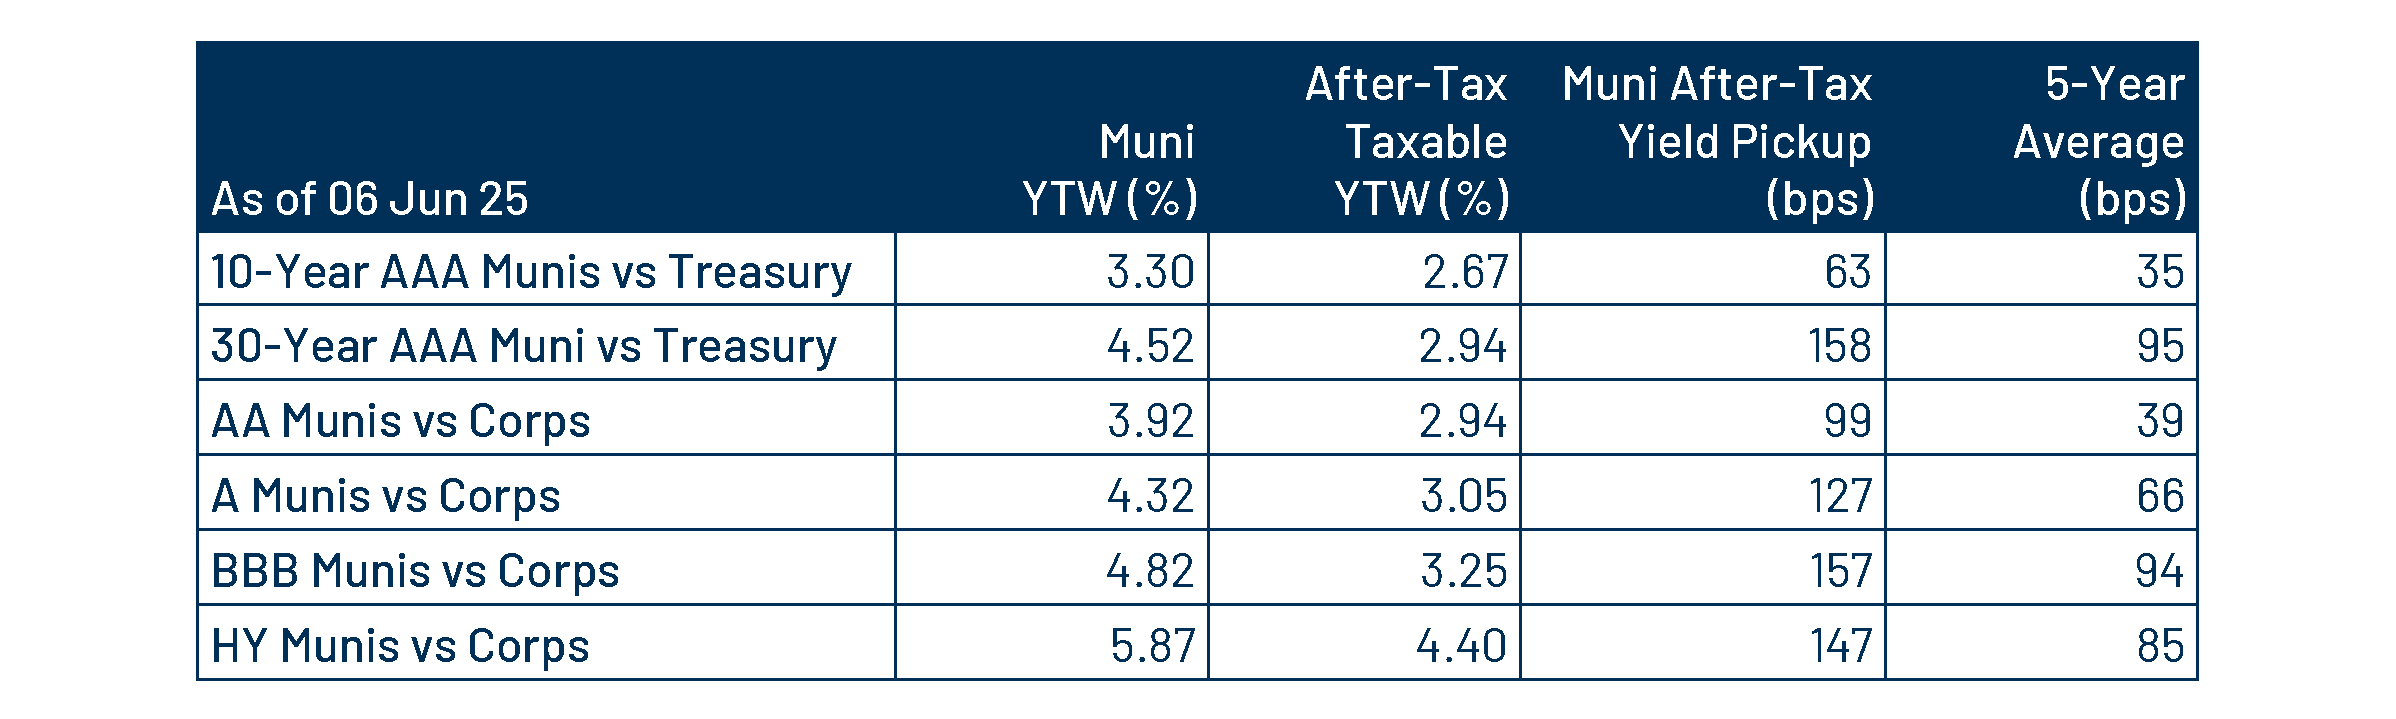
Theme #1: Municipal taxable-equivalent yields and income opportunities remain near decade-high levels.
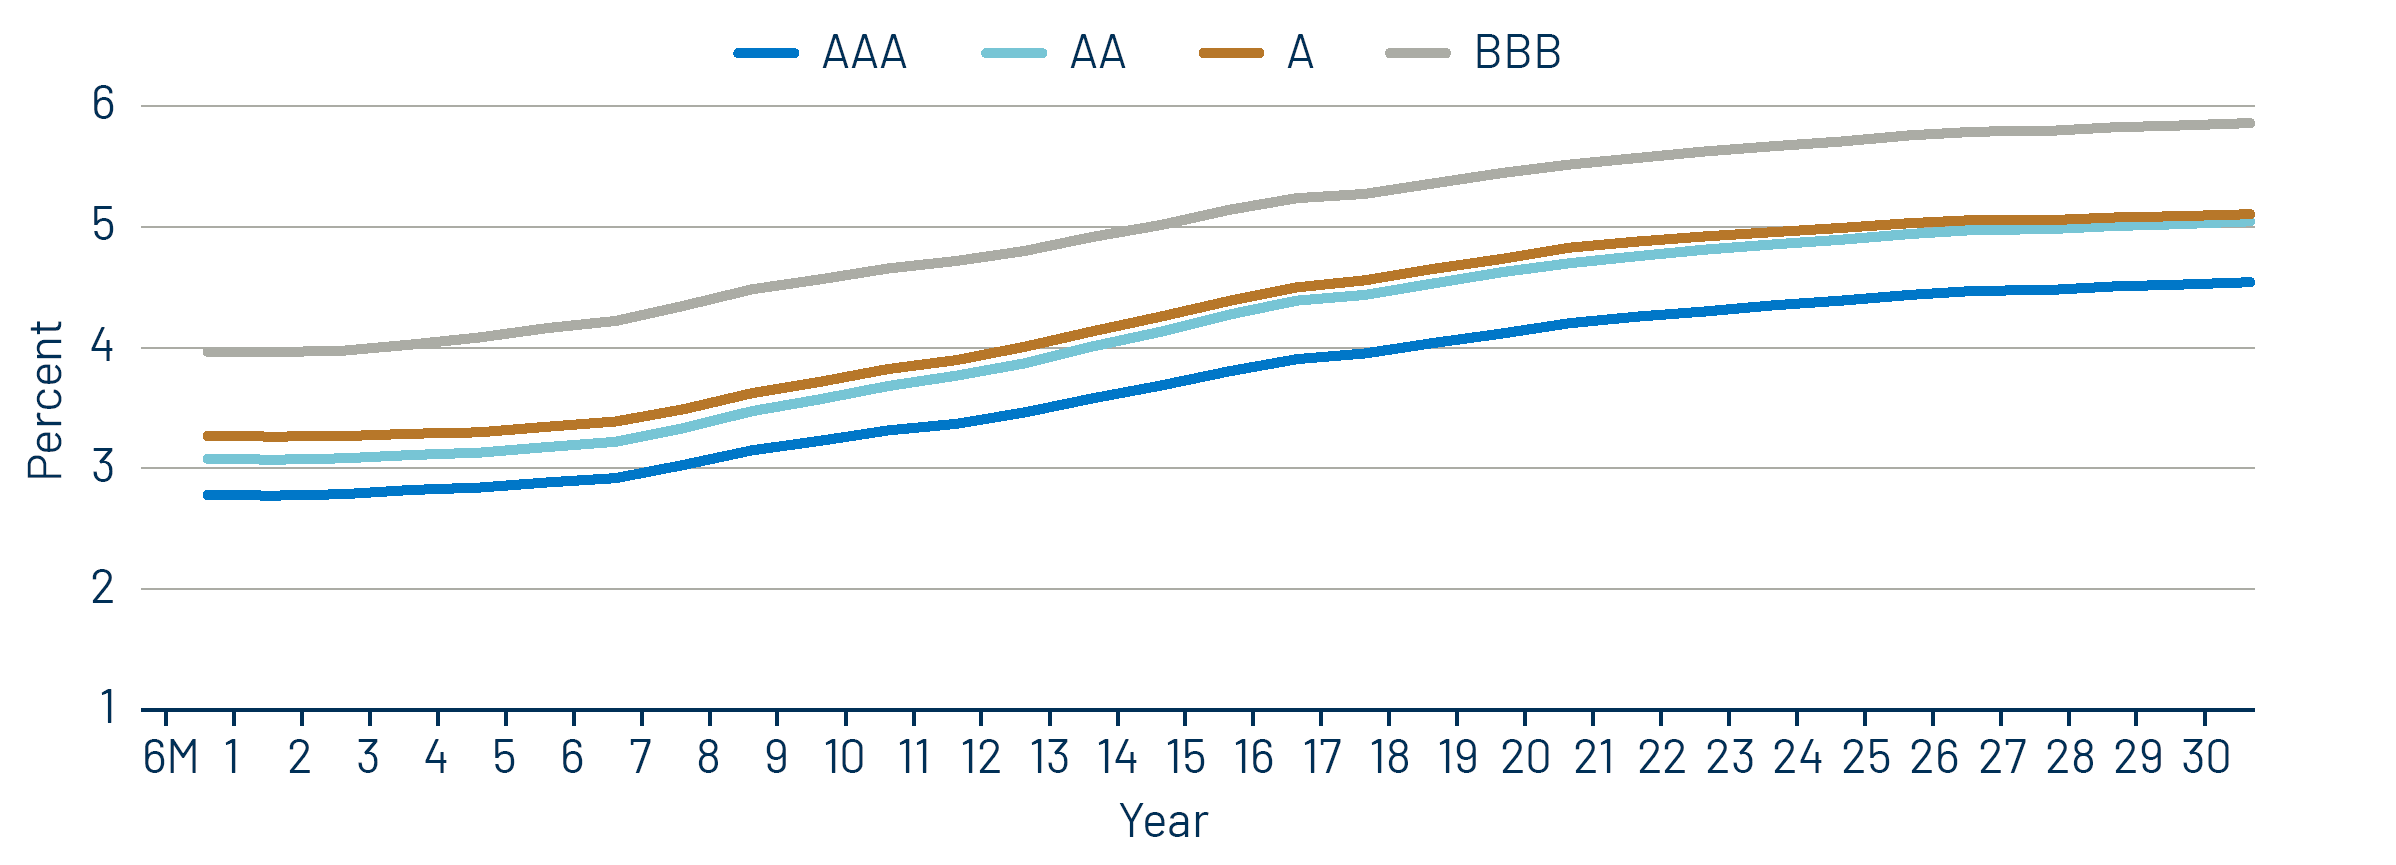
Theme #2: The muni curve has steepened, offering better value in intermediate and longer maturities.
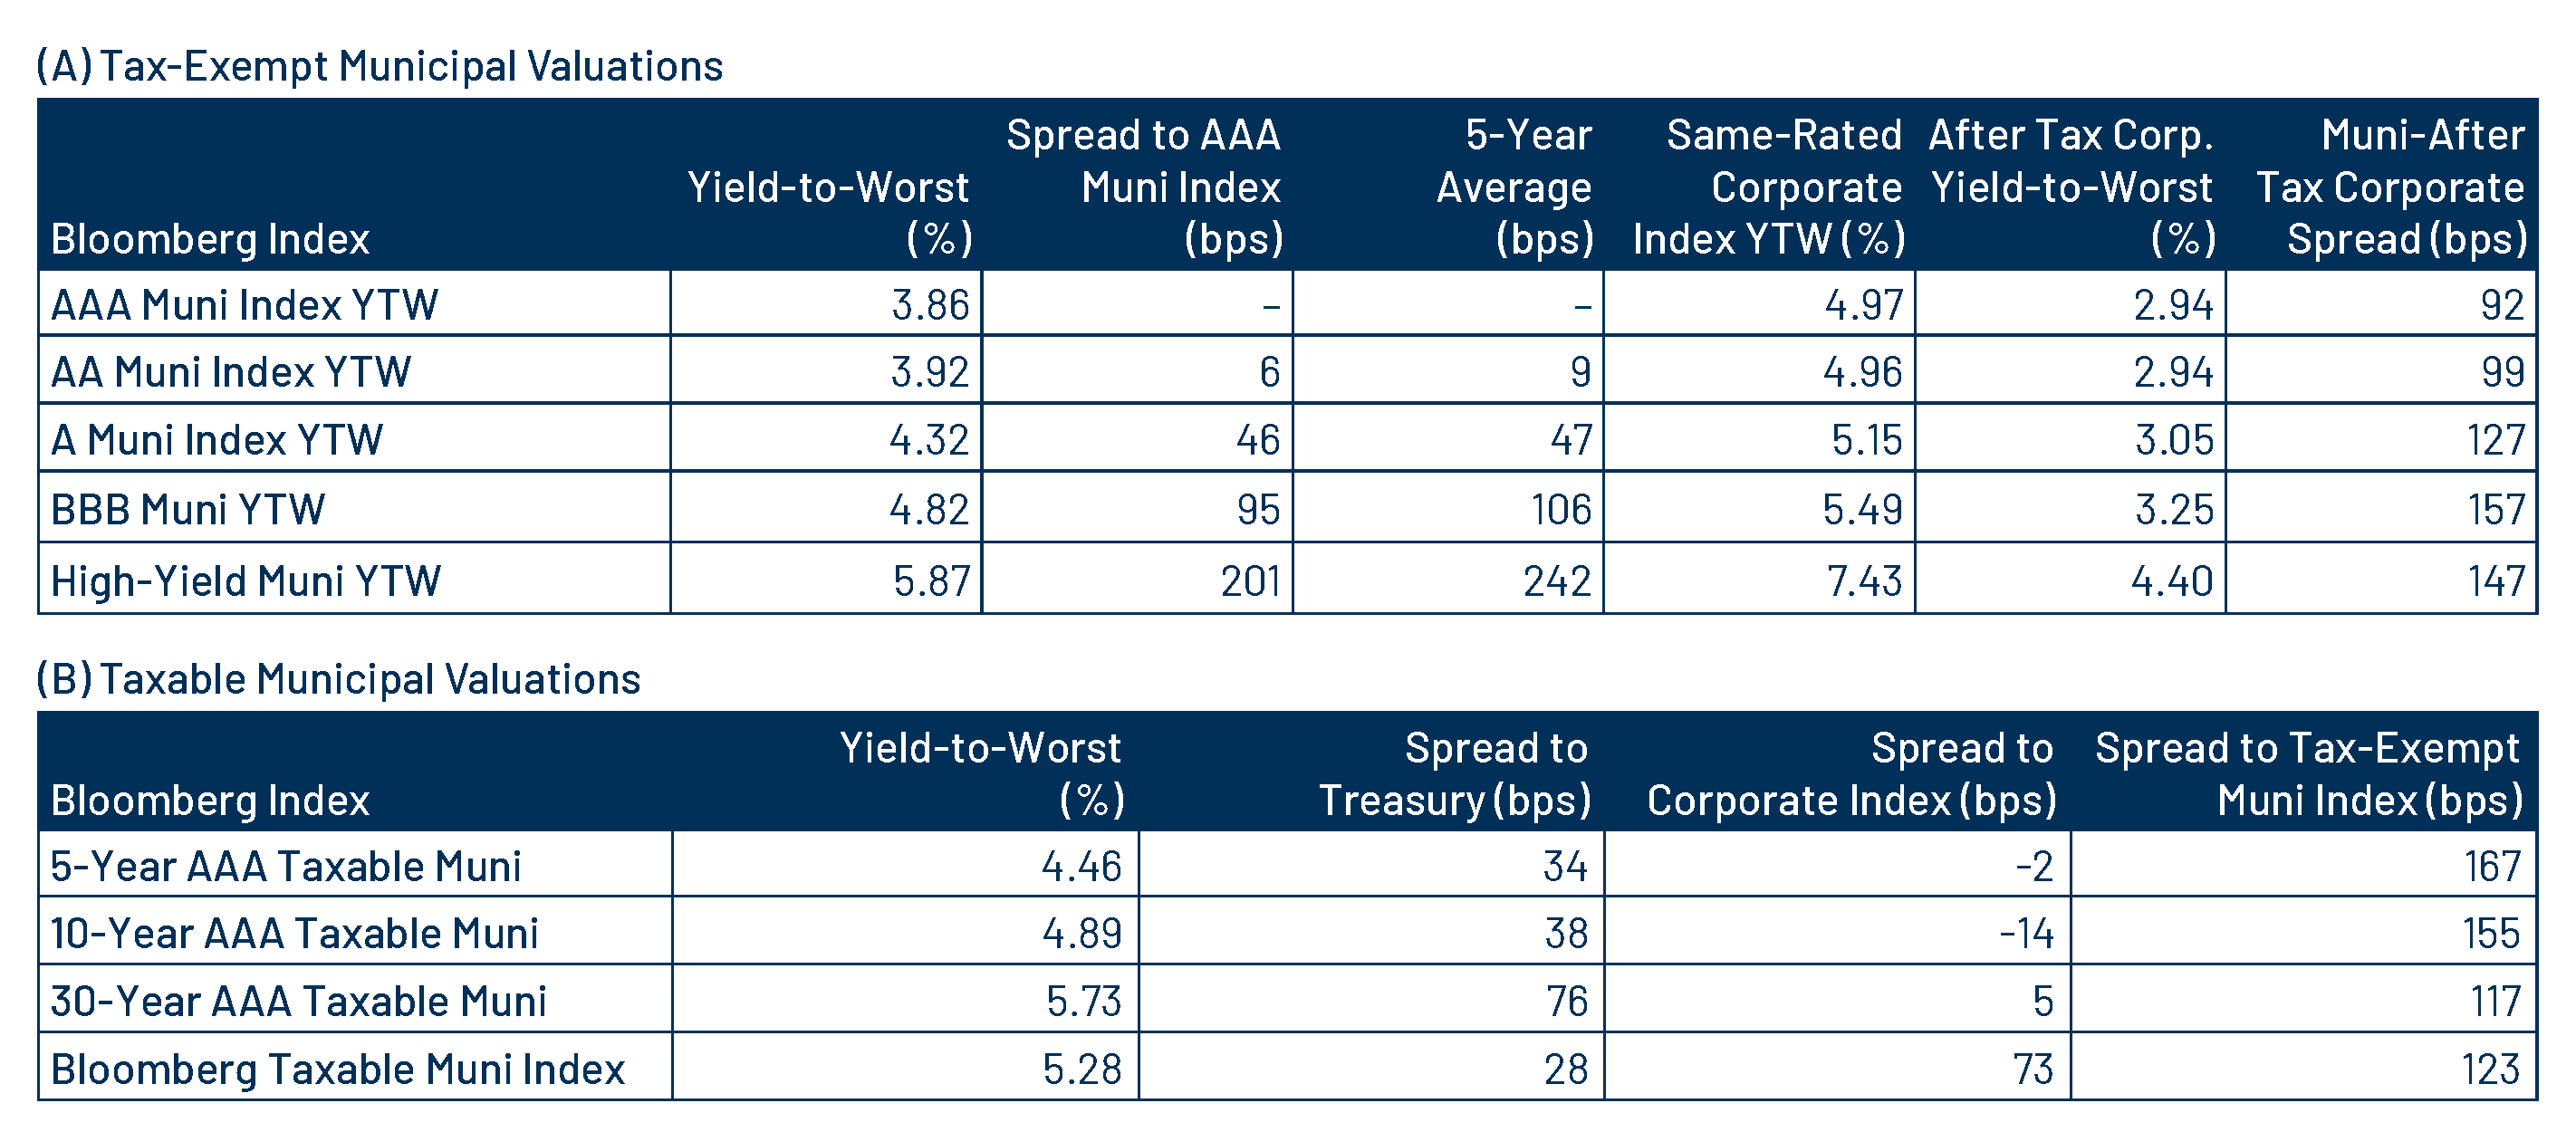
Theme #3: Munis offer attractive after-tax yield compared to taxable alternatives.