

Historically, when the Fed raised interest rates and market liquidity receded, those sectors of the economy where borrowing increased the most tended to have more challenges. In 1992, Hyman Minsky’s paper on the Financial Instability Hypothesis characterized the current situation well:
“... if an economy with a sizeable body of speculative financial units is in an inflationary state, and the authorities attempt to exorcise inflation by monetary constraint, then speculative units will become Ponzi units and the net worth of previously Ponzi units will quickly evaporate. Consequently, units with cash flow shortfalls will be forced to try to make position by selling out position. This is likely to lead to a collapse of asset values.”
Minsky classified debt into a few different categories, with the least stable labeled as Ponzi. Paraphrasing a bit, the more prevalent Ponzi debt is in the economy, the more unstable the economy becomes.
With that as background, our base case is that the US economy will slow, inflation will continue to decline closer to the Fed’s 2% target in the coming quarters, and the private sector is in reasonable shape. While borrowing rates have been a headwind to nominal growth, we aren’t expecting defaults to pick up materially as they did in 2020. In one of our previous posts on public credits, we highlighted that investors will demand a greater premium in private credit to compensate for liquidity and higher relative default risk versus public credit in mid-2022. In today’s post, we highlight multiple factors that support a better risk-adjusted opportunity in public versus private markets that address the issues of multiples, defaults and refinancing risk.
Monitoring Multiples
Empirically, the value of a company typically rises as borrowing rates decline and the value falls when rates rise (Exhibit 1). Looking at the median asset valuations or enterprise values (EV) of high-yield companies that have publicly traded equity, it’s clear that equity investors are less willing to pay high multiples for companies as the cost of debt has risen, and there is more uncertainty around growth. Since 2021, the median high-yield-rated company’s assets relative to its EBITDA have declined by about 30%, to 8.1x at year-end 2022, which can be seen using the left-axis on Exhibit 1 (left-hand chart). Interest rates on high-yield debt for those companies rose to nearly 10% from about 5% for the same period, which is on the right-hand axis (inverted). That said, asset coverage for the median high-yield company remains relatively high, but default risk is rising for the most levered companies as valuation multiples have declined.
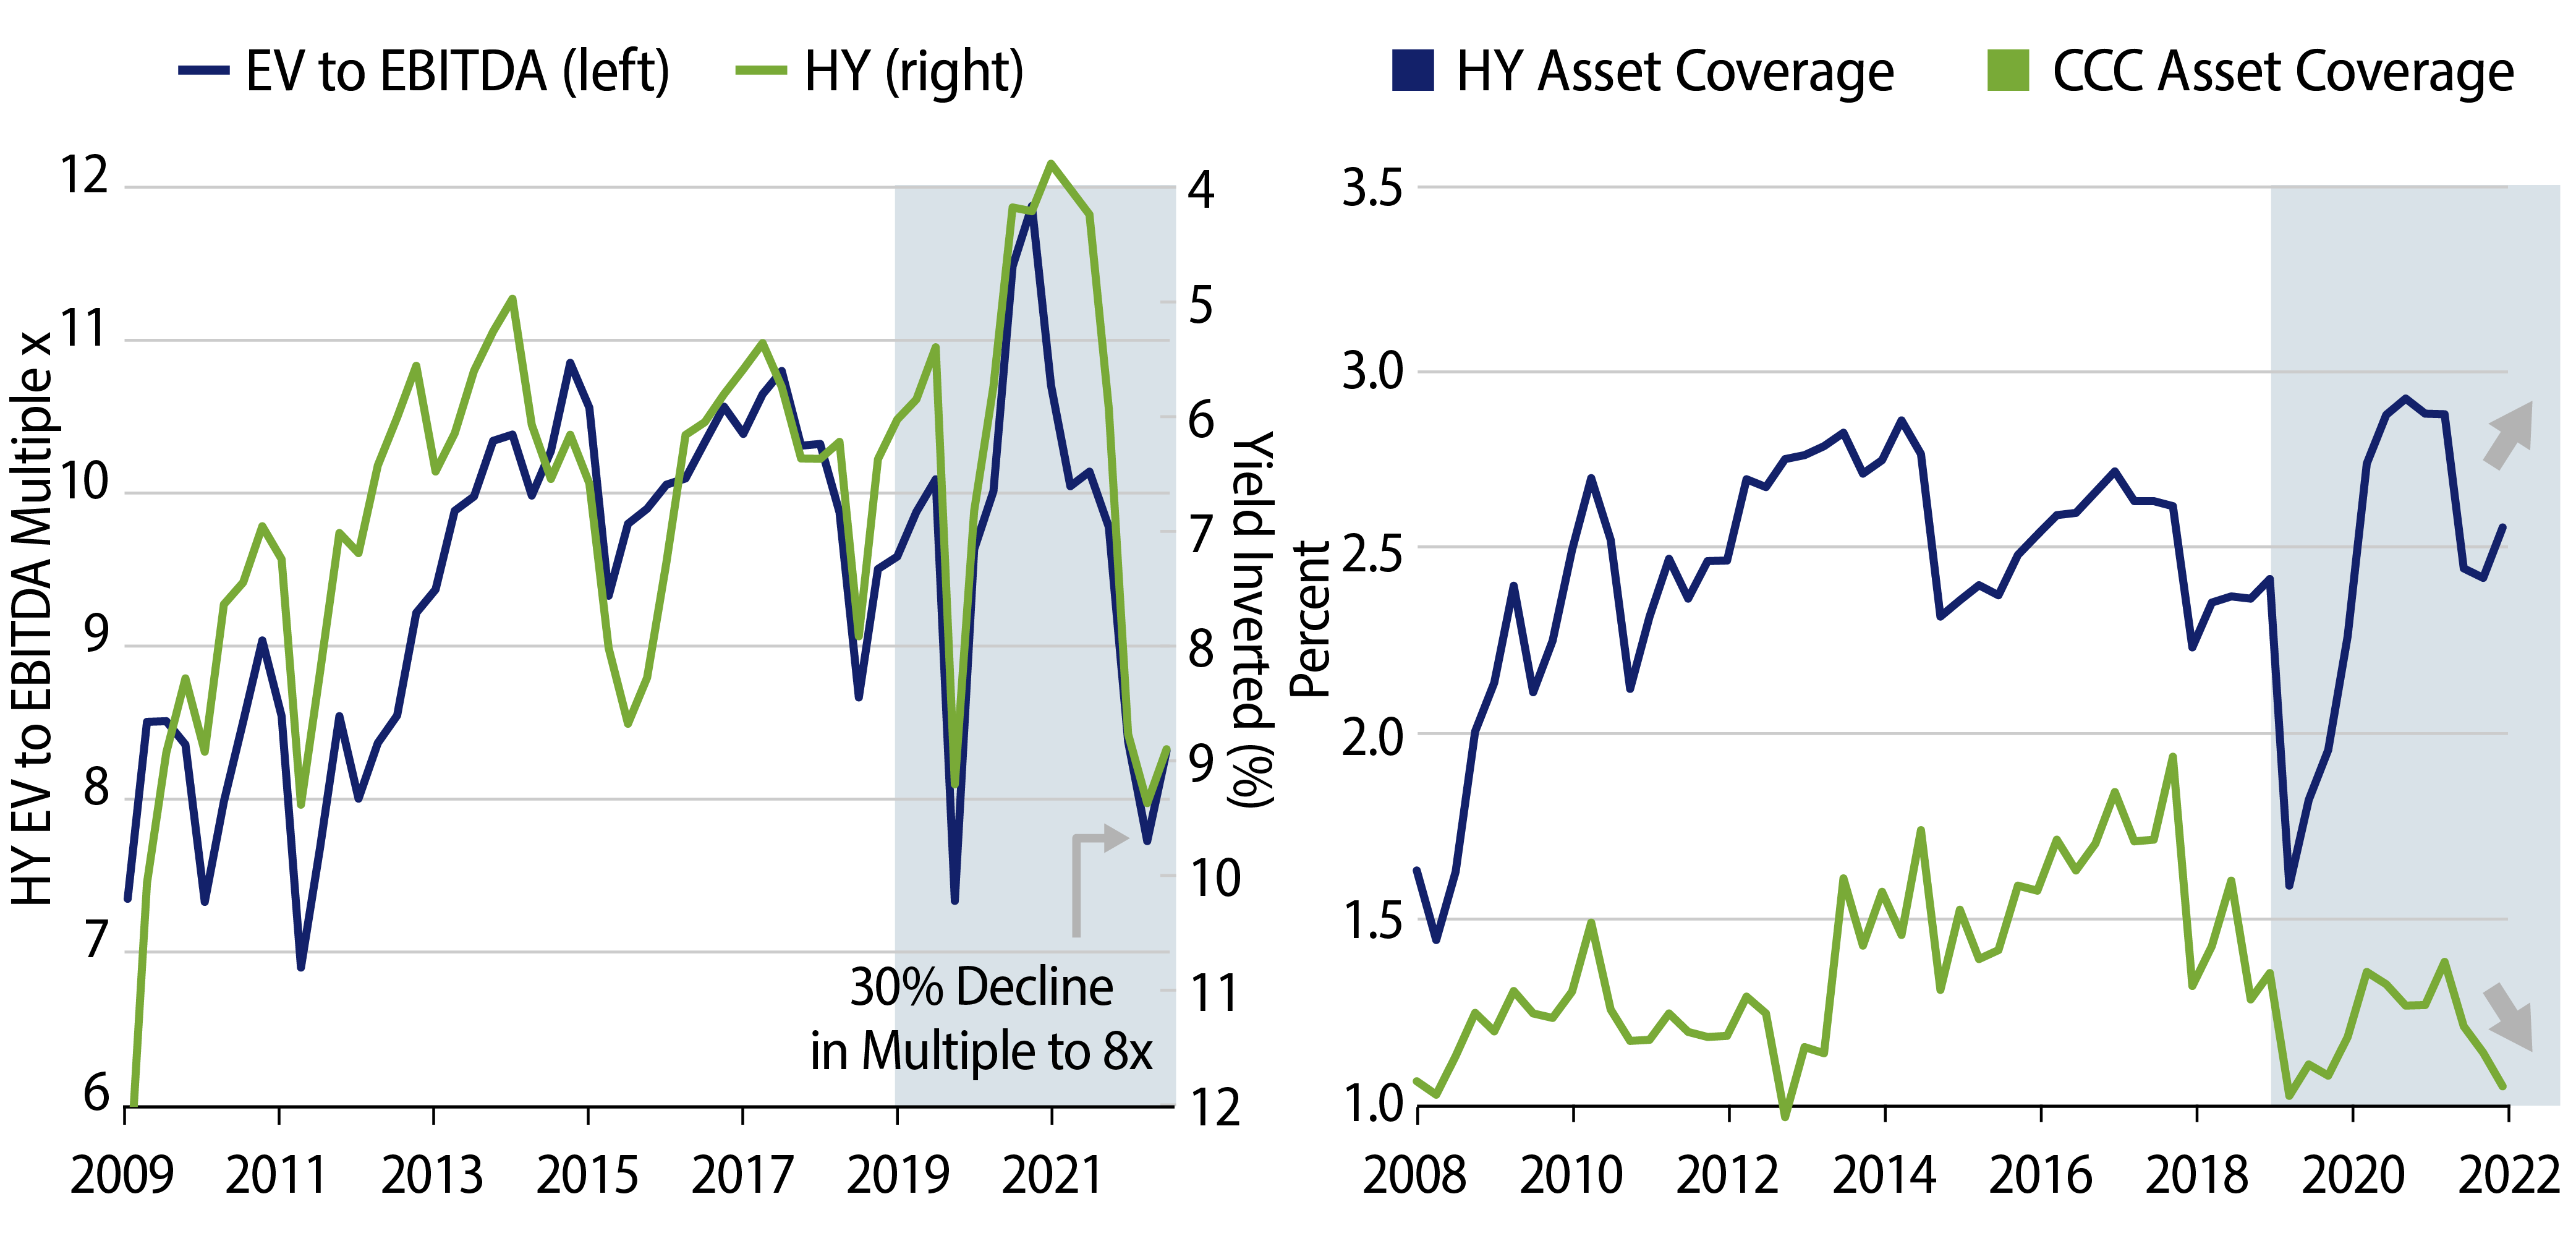
Equity valuations are very relevant for lenders to the company (i.e., credit investors), as they represent a current estimate of what other investors are willing to value the company’s expected future cash flows. The valuation of a company’s equity capital can be even more relevant around the time it may need to refinance its debt. In short, if there is a higher risk that a company’s assets decline to a point at which they fall below debt borrowed, then a lender will charge higher interest and usually require collateral to protect its loan.
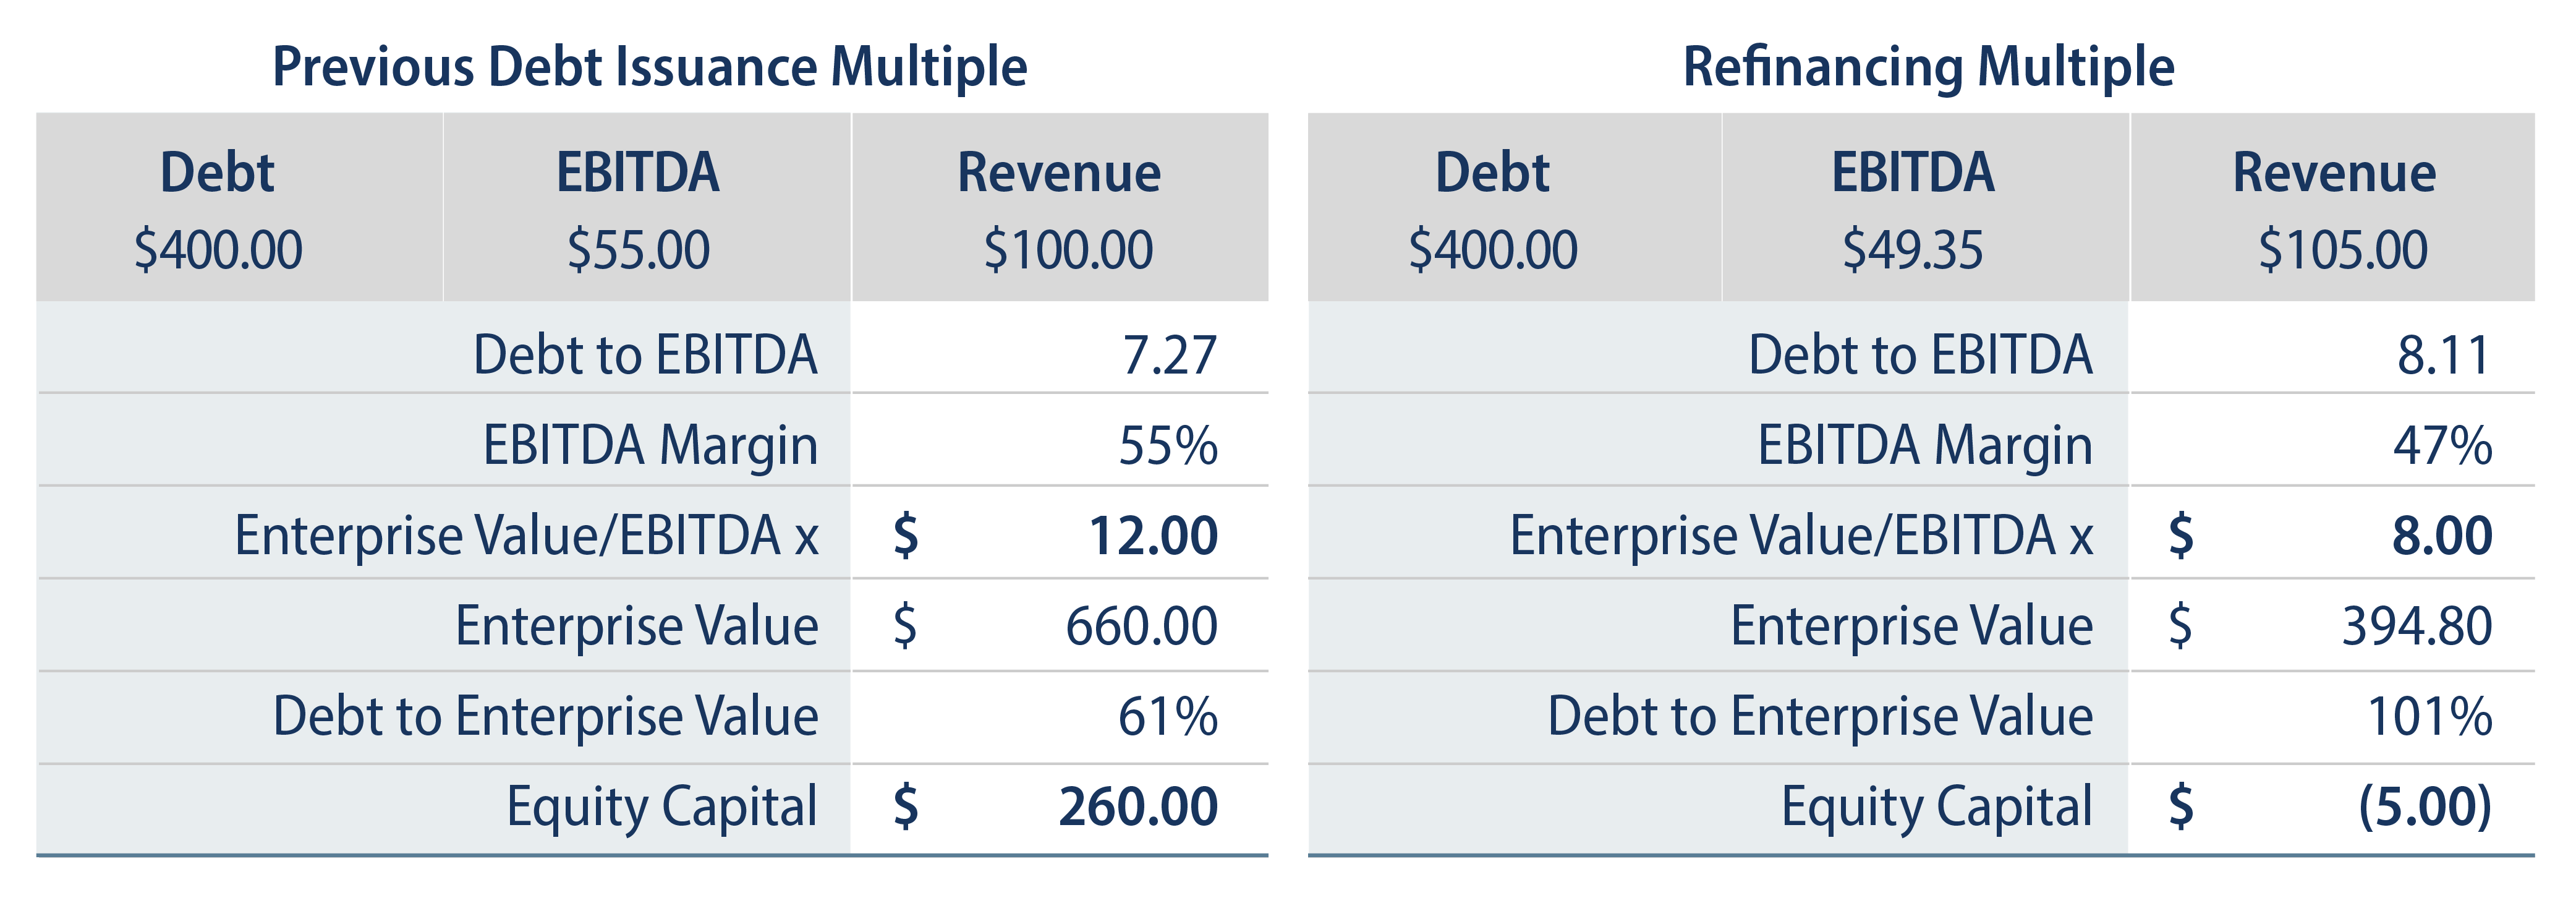
If we apply the same decline in asset multiples in the high-yield market to Middle Market sized loans for which equity prices and valuations are less transparent, it would be reasonable to assume that default risk has risen meaningfully. Exhibit 2 presents a hypothetical example of a company that issued $400 million of debt a few years ago, when buy-out and other M&A transactions valued the company around 12x EBITDA and a loan to value of ~60%. If we assume a modest growth in revenue and a small decline in margins, but the 30% decline in equity multiples that below-investment-grade corporates experienced, then this company will likely have some challenges refinancing. As you can see, if the market values the assets at 8x EBITDA today, the company will either have to issue equity, sell assets and reduce debt, or possibly default.
Recent Defaults
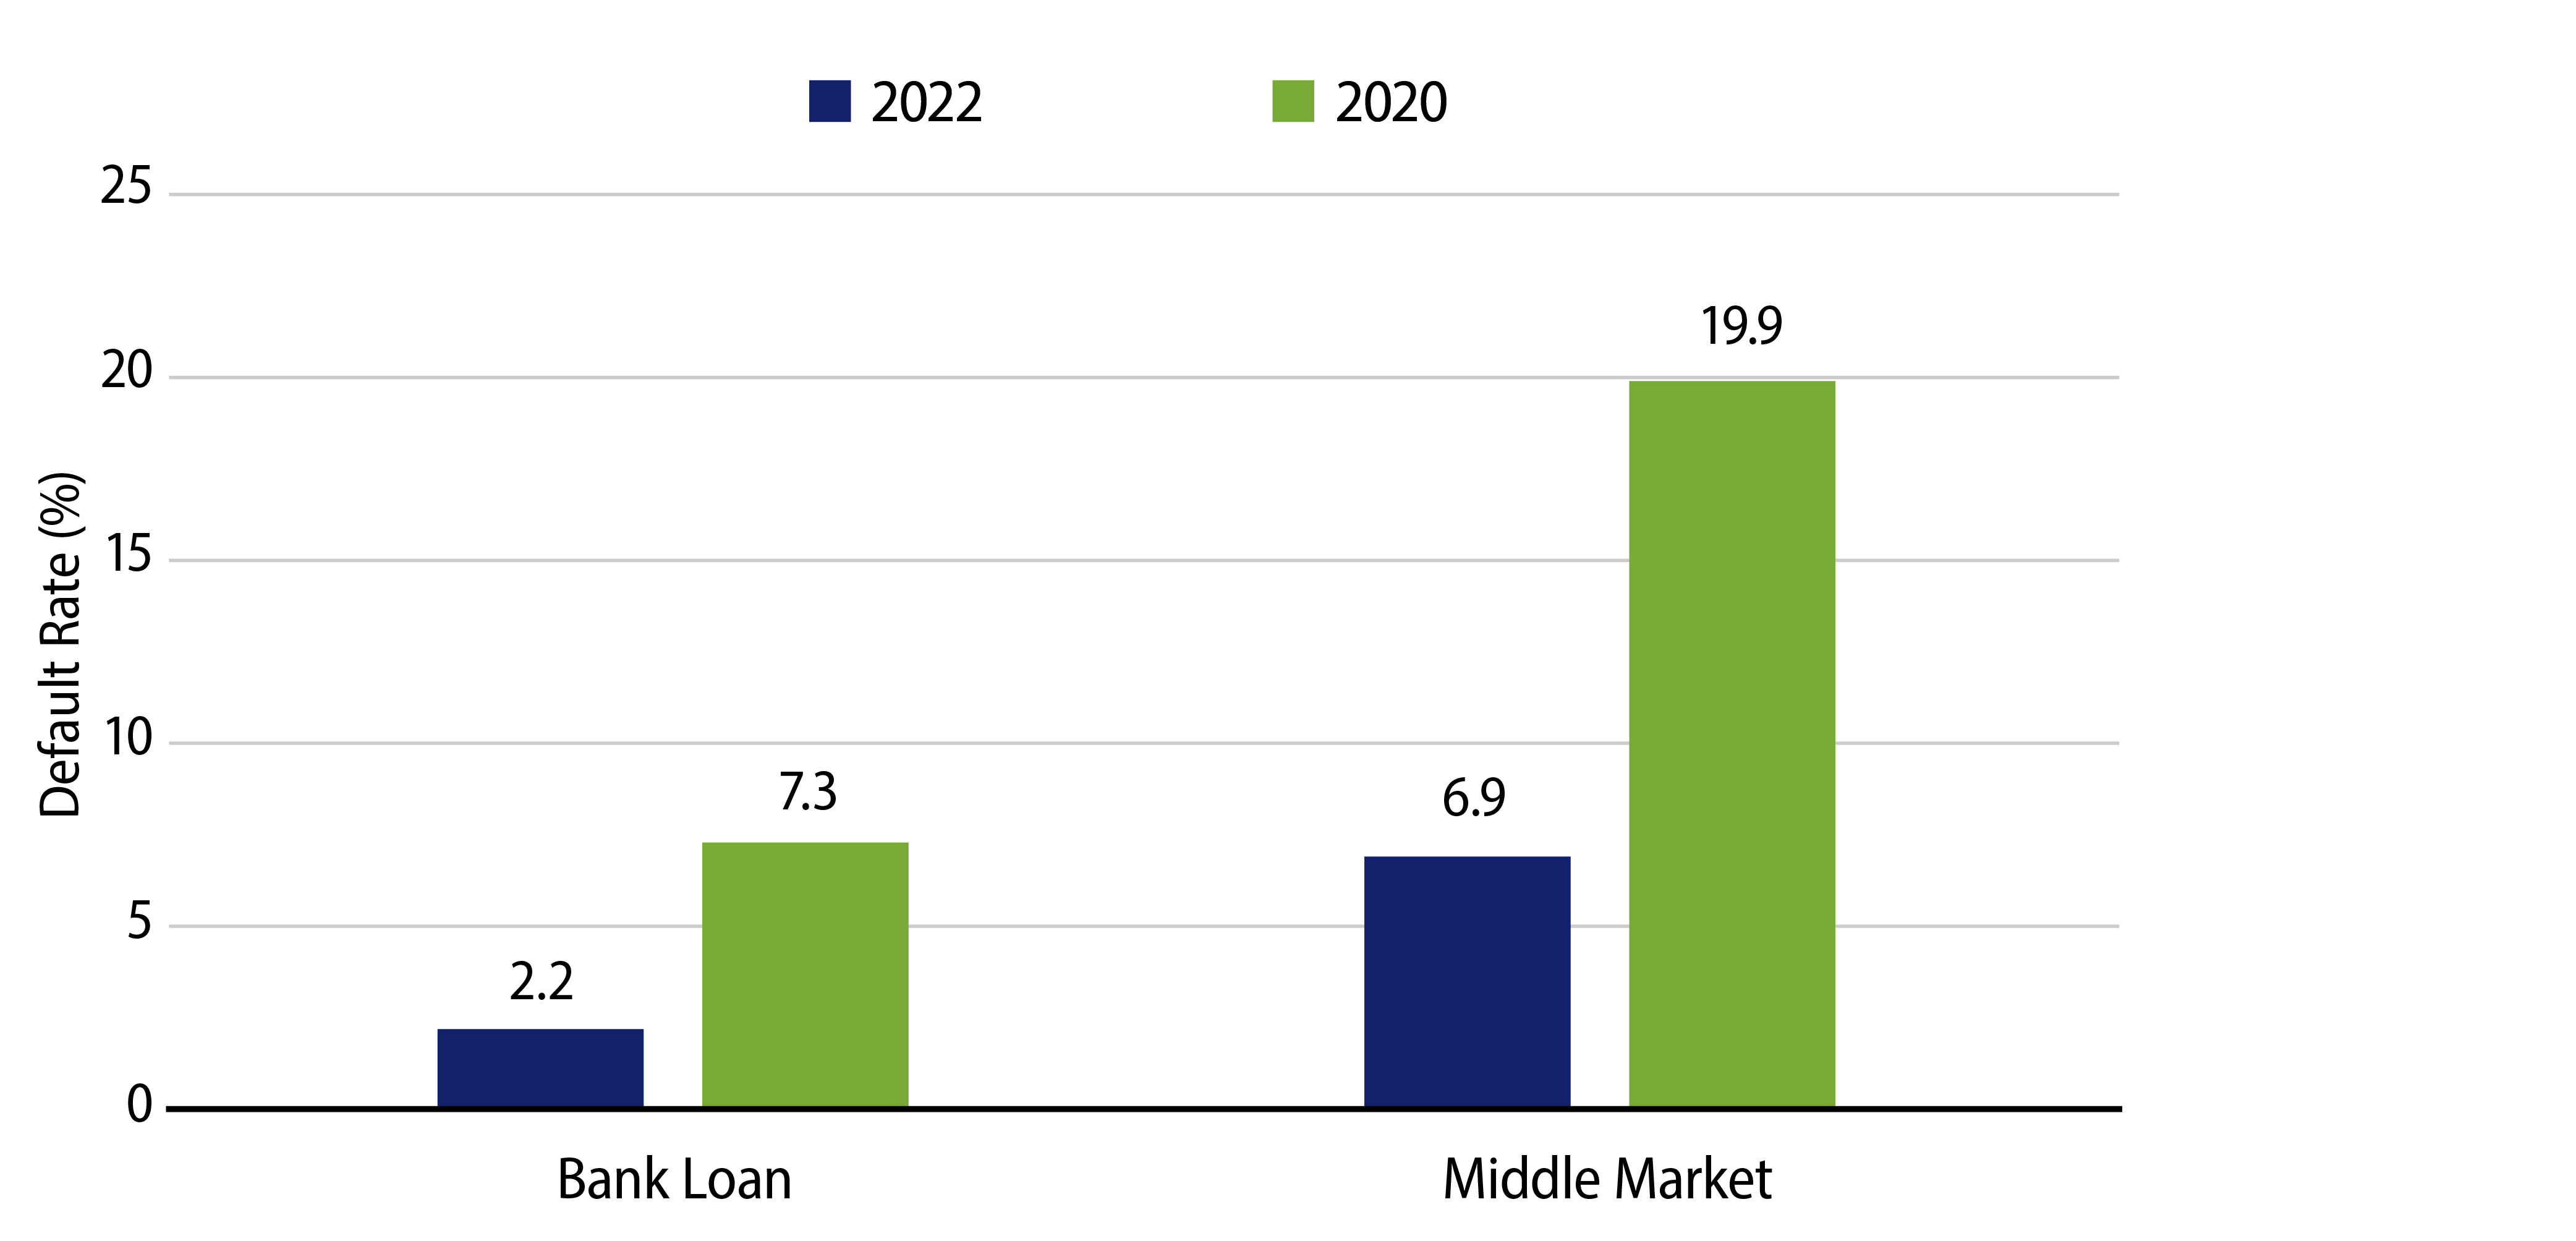
Defaults have increased in public credit for both high-yield and bank loans. In both public credit sectors, defaults rose from low levels to about 2% of the market, based on Moody’s 2022 analysis, and well below very long-term historical averages. In the bank loan market, we expect defaults will likely rise to about 4% for the market over the next year, which would still only reflect about half of the default rate during the 2020 recession. On the other hand, the Middle Markets—which are similar to bank loans because they’re a secured form of lending and floating-rate securities—have already seen default rates rise to about 7%, according to the Proskauer Index for companies that have EBITDA ranges of $25-$50 million.
Refinancing Risk
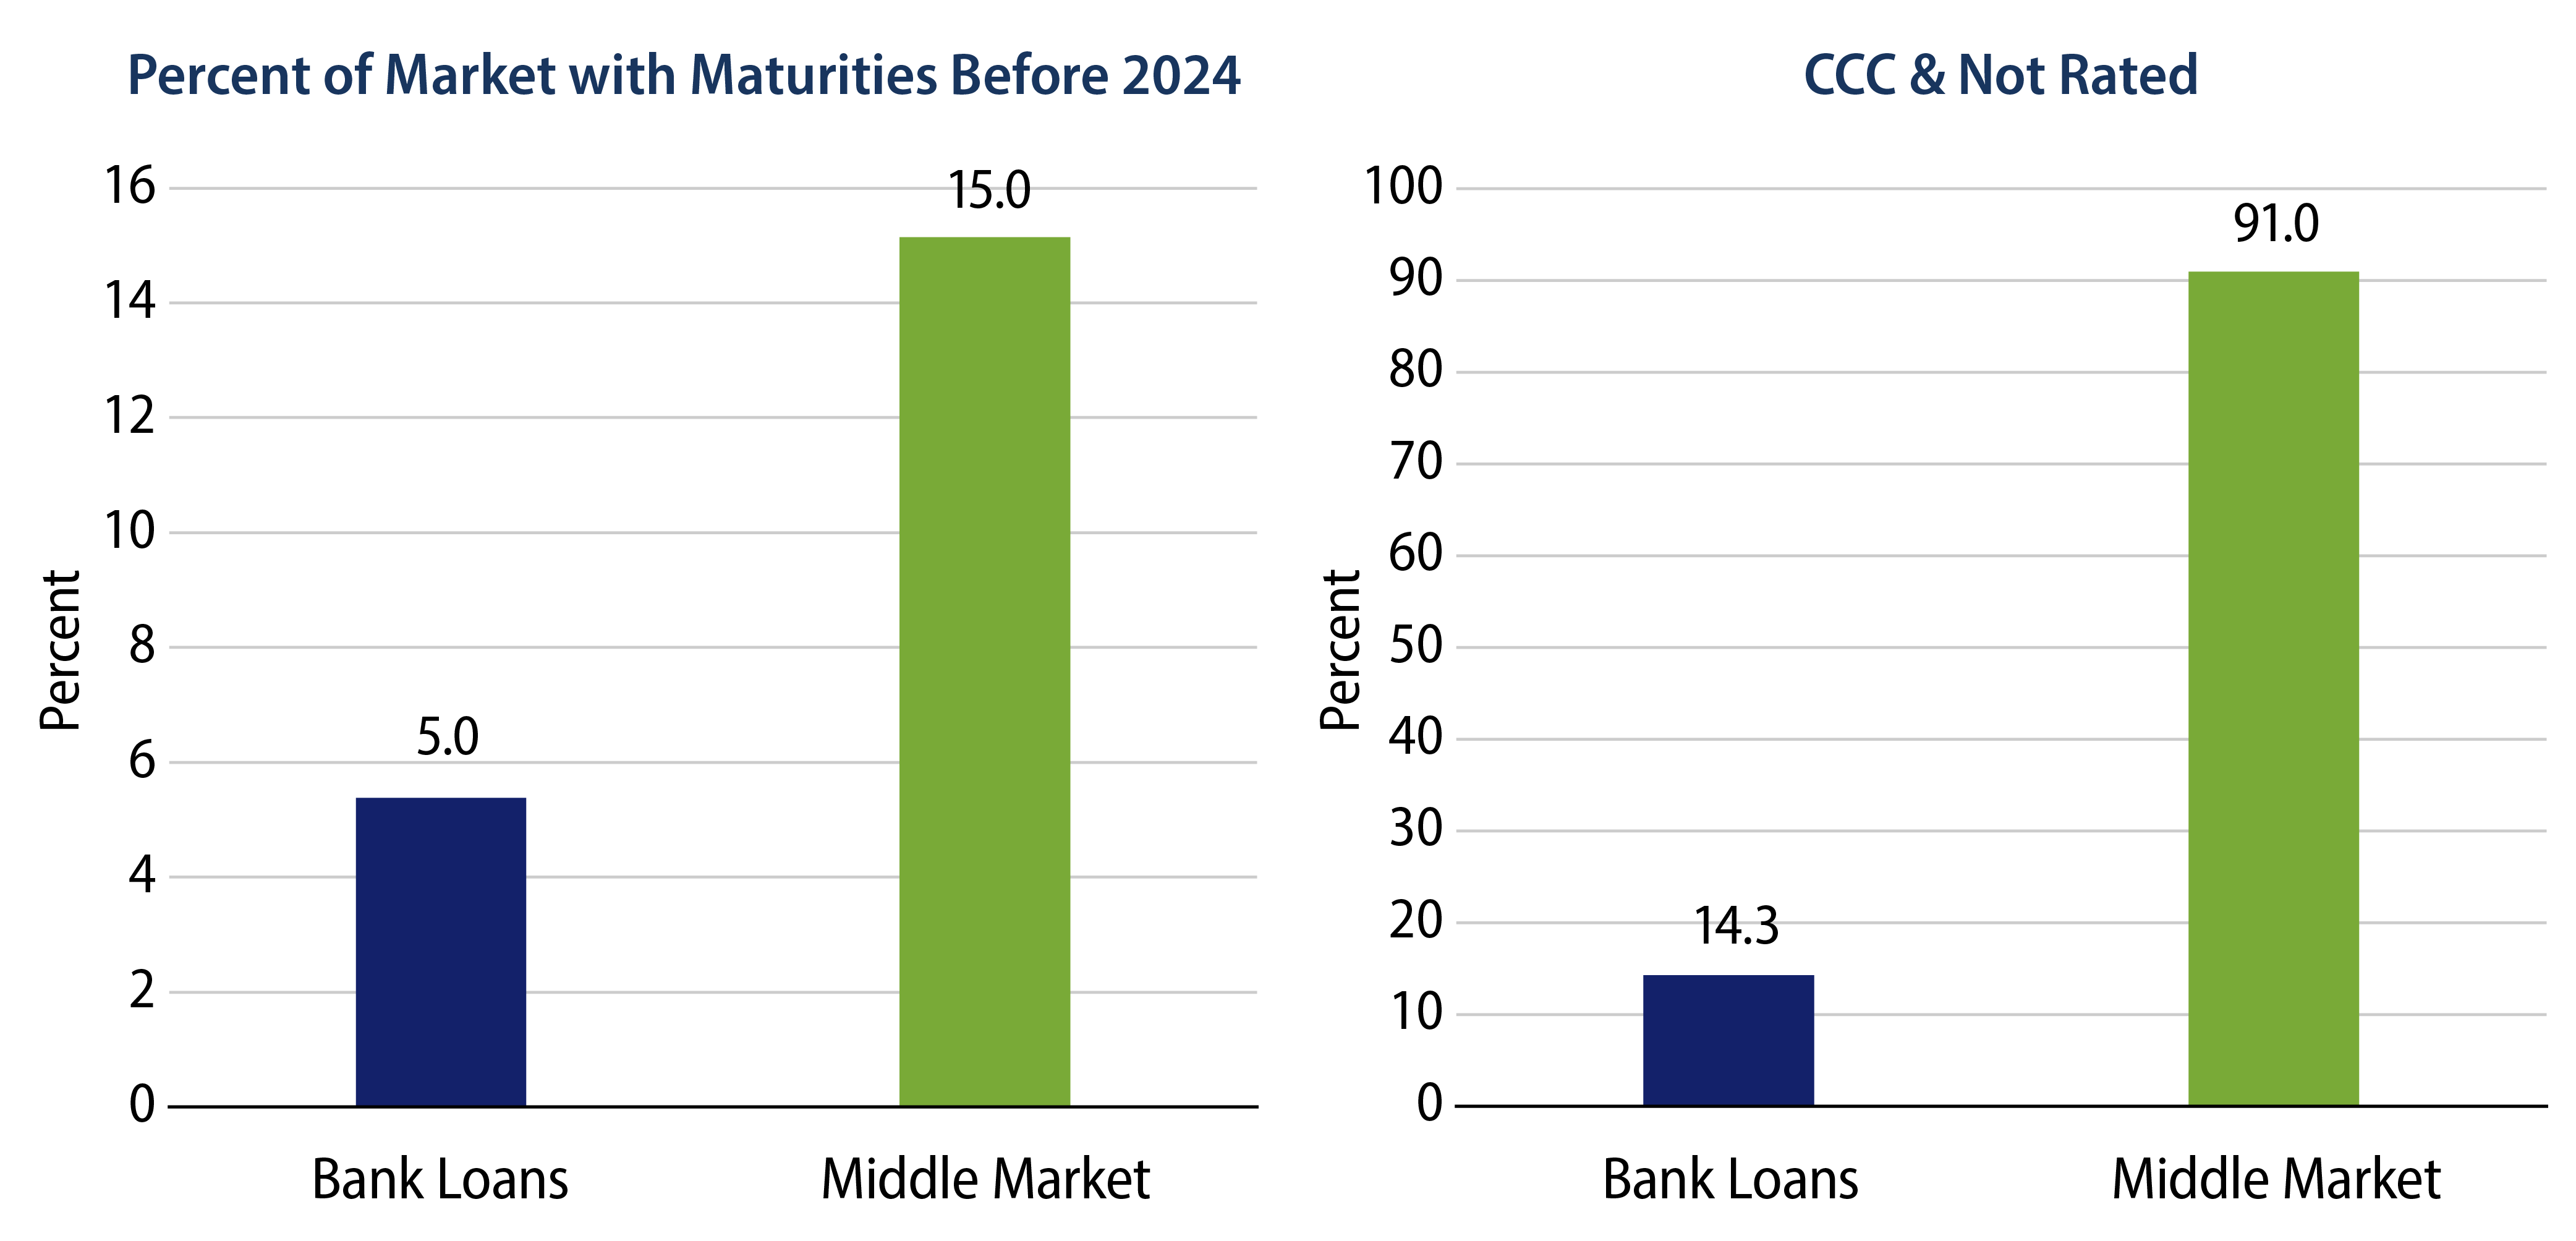
Another reason we may be seeing lower default rates in the bank loan and high-yield credits relative to Middle Markets is that many of the larger, more well-capitalized companies that have been through business cycles have termed-out their debt. In the bank loan markets, many of the larger issuers have also hedged some of their sensitivity to rising interest rates on their floating-rate liabilities. That said, these larger companies may have more financial flexibility and will likely not need to rely as much on capital markets in the next two years as do smaller Middle Market companies. While Middle Market loans are typically owned by investors that are less sensitive to daily market prices, they may have more default risk if they need to refinance during this period when access to capital is becoming very tight. Worth noting, about 5% of the over $1.0 trillion syndicated bank loan market in the US needs to refinance its debt before 2024. This compares to about 15% of the roughly $1.0 trillion Middle Market companies, according to BofA Merrill research. In addition, research focused on Middle Market collateralized loan obligations (CLOs) suggests more than 85% of the underlying collateral is either rated CCC or unrated, which is substantially more than the bank loan market at less than 15%, using the lower of Moody’s and S&P ratings.
Benefits of an Active, Flexible Approach
For background, from 2009 to 2022, the non-financial corporate debt and loan market in the US has grown at roughly 6% per year, according to the Fed’s Flow of Funds. The growth in debt is in line with corporate profits on average, but some industries and some sectors have been growing faster than others. Some measures of private credit markets suggest significantly faster growth than public markets, but it’s probably unfair to assert that all private credit is riskier simply because of fast market growth and fear of impact on markets from the Fed’s restrictive monetary policy aimed at bringing inflation down to 2%. Keep in mind, some of the growth in the market reflects a change in intermediation from banks to asset managers, not excesses in corporate borrowing or leverage.
At Western Asset, we manage over $15 billion in private credit across various strategies, as discretion allows, and we focus on sectors and industries where fundamentals and valuations are supportive. Currently, we see more opportunity in public credits on average, and remain selective in private credit markets—which may need to see a higher relative yield to compensate for liquidity and default risk. A flexible approach to high-yield and bank loans with limited exposure to private credit may offer equity-like returns over the next three to five years, but likely with much less volatility than equity, as history suggests. For higher return profile strategies, we see more value in CLO equity of active managers given structural advantages and better company diversification than levered alternatives. We are also finding value in structured credit, CLO debt included, and believe taking an active approach with independent research can help to reduce losses from defaults as financial conditions tighten and the economy slows.