High Grade Municipal Yields Moved Lower During the Week
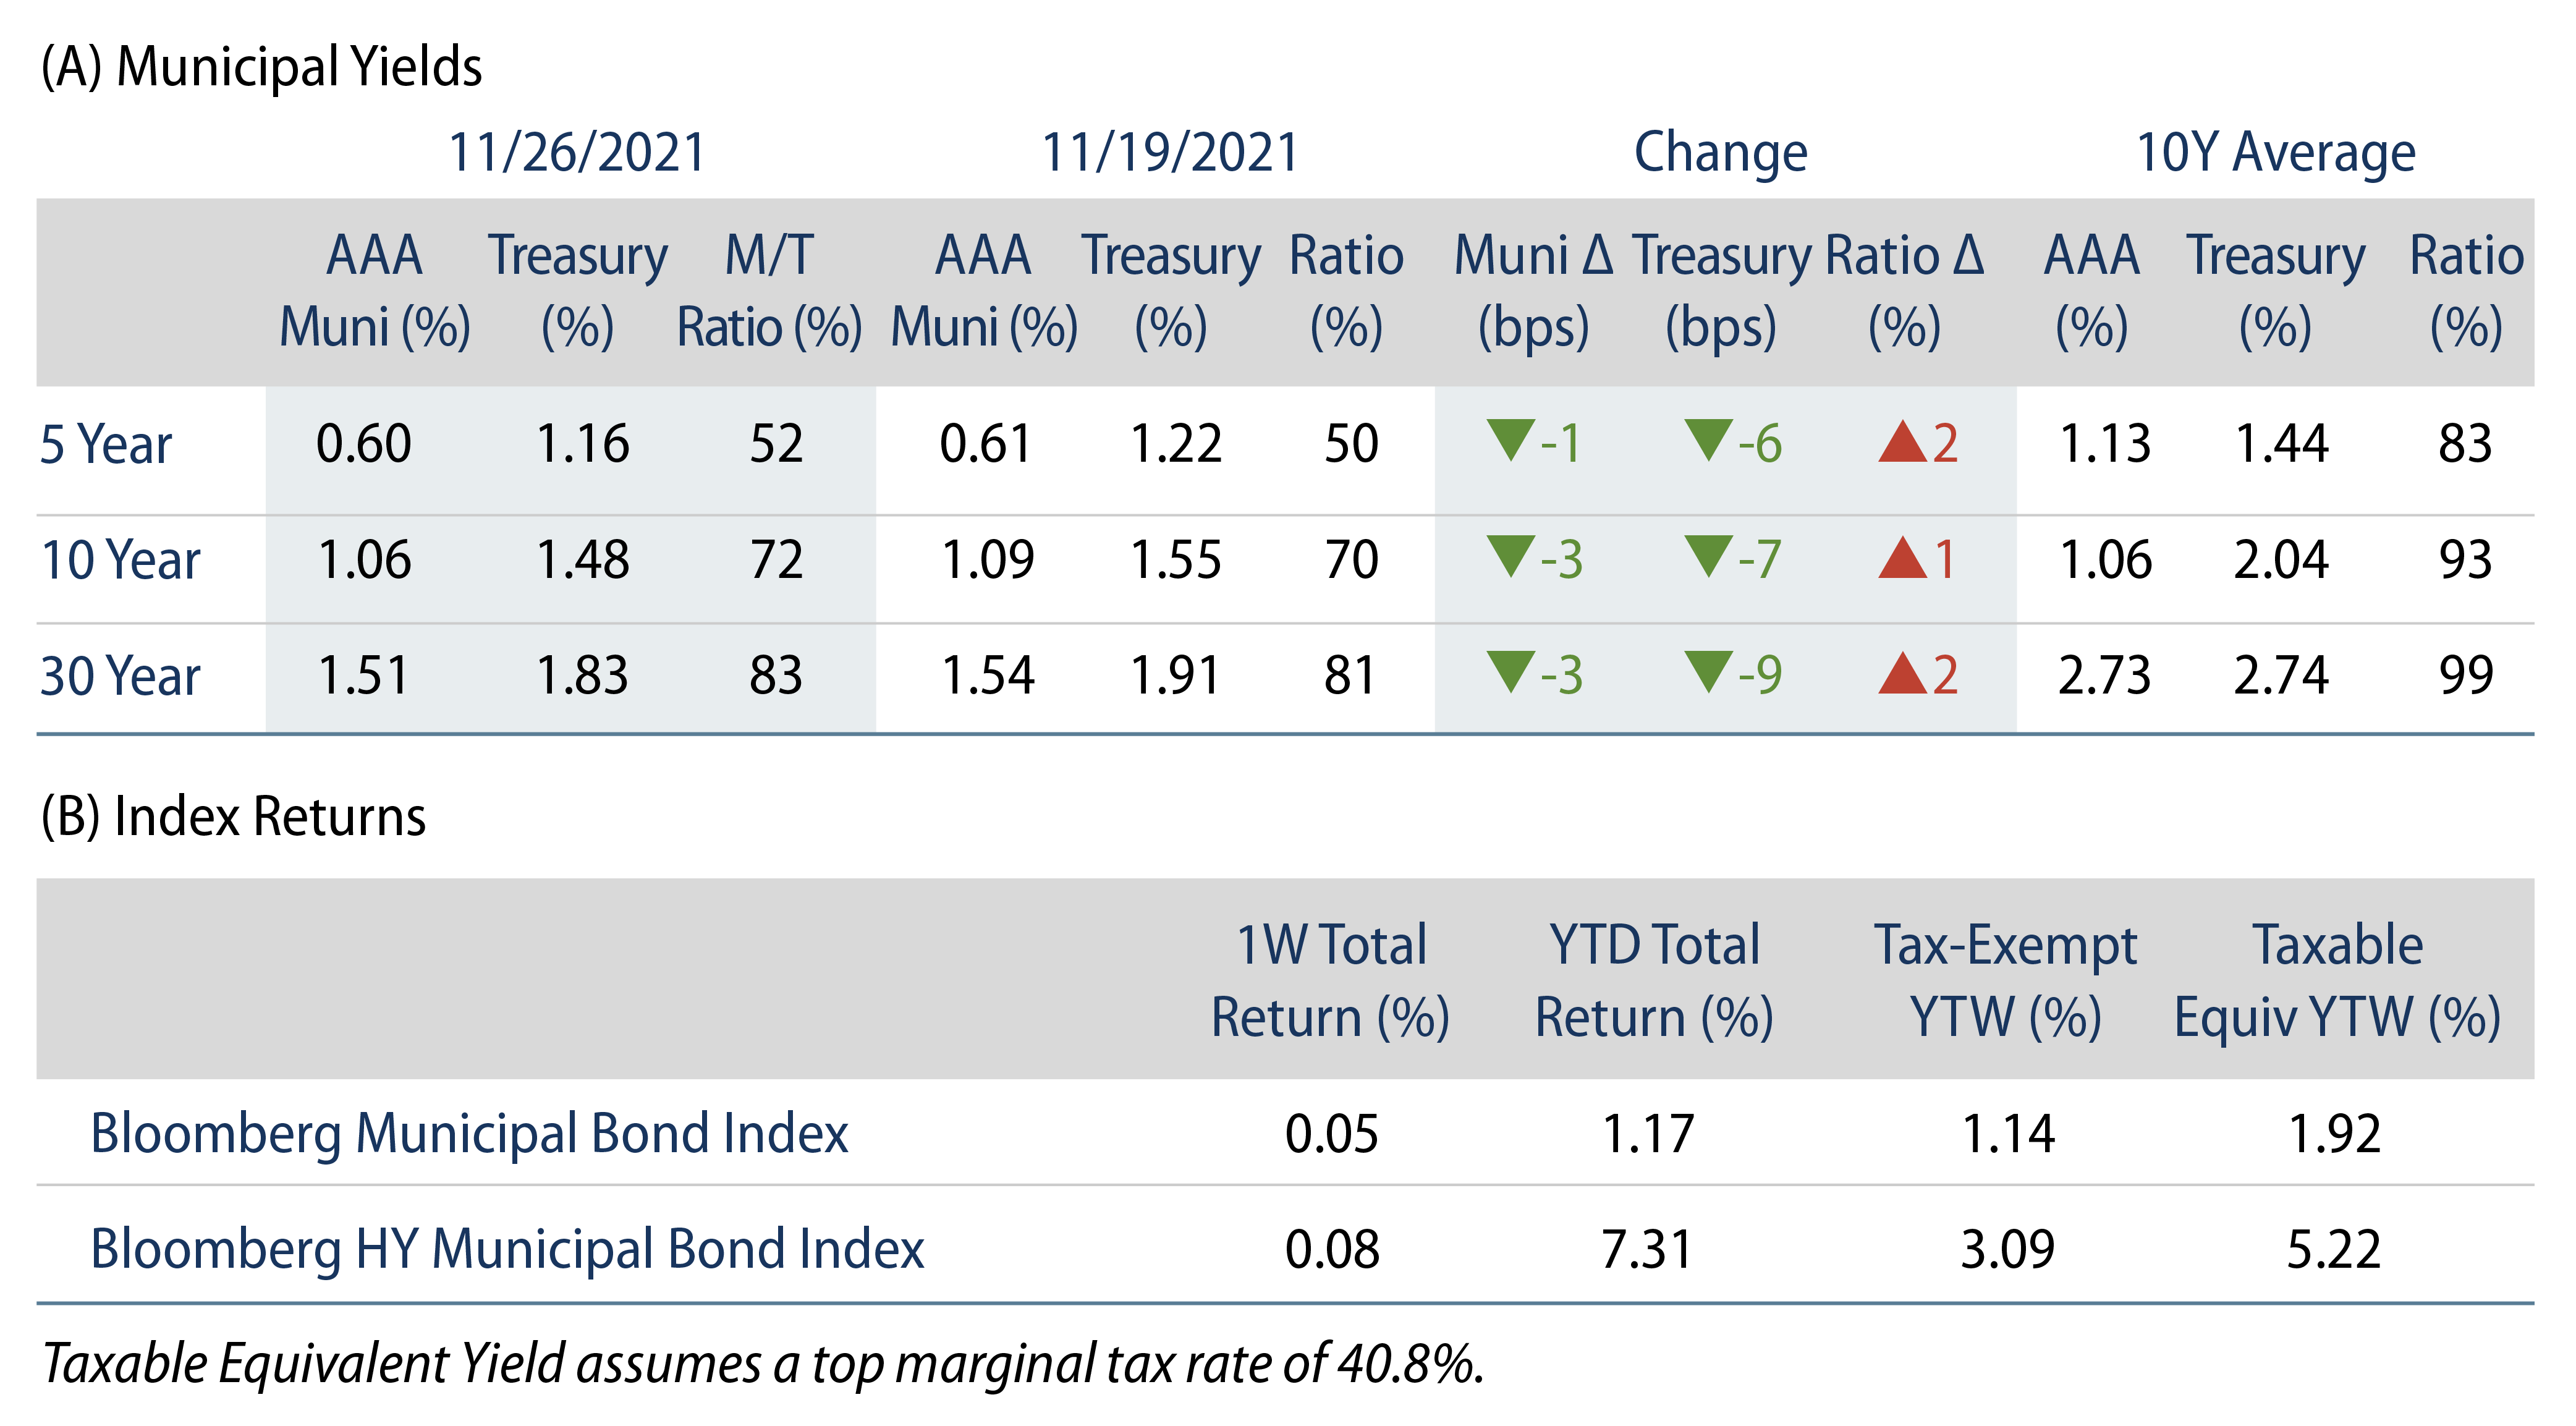
The AAA US muni yield curve moved 1-3 bps lower across the curve. Municipals underperformed Treasuries, resulting in modestly higher ratios. Fund flows extended a record amid limited supply in the holiday-shortened week. The Bloomberg Municipal Index returned 0.05%, while the HY Muni Index returned 0.08%. This week we look at the recently released state expenditure report from the National Association of State Budget Officers (NASBO), highlighting improving municipal credit trends.
Fund Flows Extend a Record Pace as Supply Dwindles
Fund Flows: During the week ending November 24, municipal mutual funds recorded $720 million of net inflows. Long-term funds recorded $745 million of inflows, high-yield funds recorded $408 million of inflows and intermediate funds recorded $244 million of inflows. Municipal mutual funds have now recorded inflows 79 of the last 80 weeks, extending the record inflow cycle to $158.3 billion, with year-to-date (YTD) net inflows surpassing a record calendar year pace at $97 billion.
Supply: The muni market recorded just $1.5 billion of new-issue volume during the holiday-shortened week, down 91% from the prior week. Total YTD issuance of $424 billion is 2% lower from last year’s levels, with tax-exempt issuance trending 7% higher year-over-year (YoY) and taxable issuance trending 22% lower YoY. This week’s new-issue calendar is expected ramp back up to approximately $11 billion. The largest deals include $4 billion Metropolitan Transportation Authority (MTA) Grant Anticipation Notes and $600 million Illinois Toll Highway Authority transactions.
This Week in Munis—Ongoing Budget Improvements Spur Upgrades
This month, NASBO released its 2021 State Expenditure Report, reflecting 16.2% YoY growth in state spending during the year. State spending of federal dollars rose 35.7% during the year, while expenditures from NASBO’s own coffers rose only 5.7%. The large federal spending increase was no surprise considering the COVID-19 spending associated with the approximately $500 billion of federal stimulus measures that directly supported states and localities. As we highlighted in this blog last month, State and Local Tax Revenues Shine, robust state and local revenue growth have more than offset the reported uptick in spending from state coffers during the year. This was also included in NASBO’s report, which described how 2021 state revenues increased 13% over fiscal-year 2020 levels.
The credit improvement is perhaps most staggering in the state of California. Following a fiscal year that initially estimated a $54 billion shortfall due to Covid concerns, California closed fiscal-year 2021 with a surplus of $47 billion. California’s budgetary strength has been driven by substantial growth in general fund revenues, driven by $25 billion in personal income tax growth and almost a $7 billion increase in corporate tax collections. In addition to the revenue gains, the state also received $27 billion in federal ARPA funds. Notably, under the 1979 State Appropriations Limit Law, spending increases are capped by inflation and population growth, and therefore California can’t just spend all of its windfall. Surplus funds are to be split evenly between the schools and taxpayers, or the state could choose to lower or rebate taxes, which we deem increasingly likely.

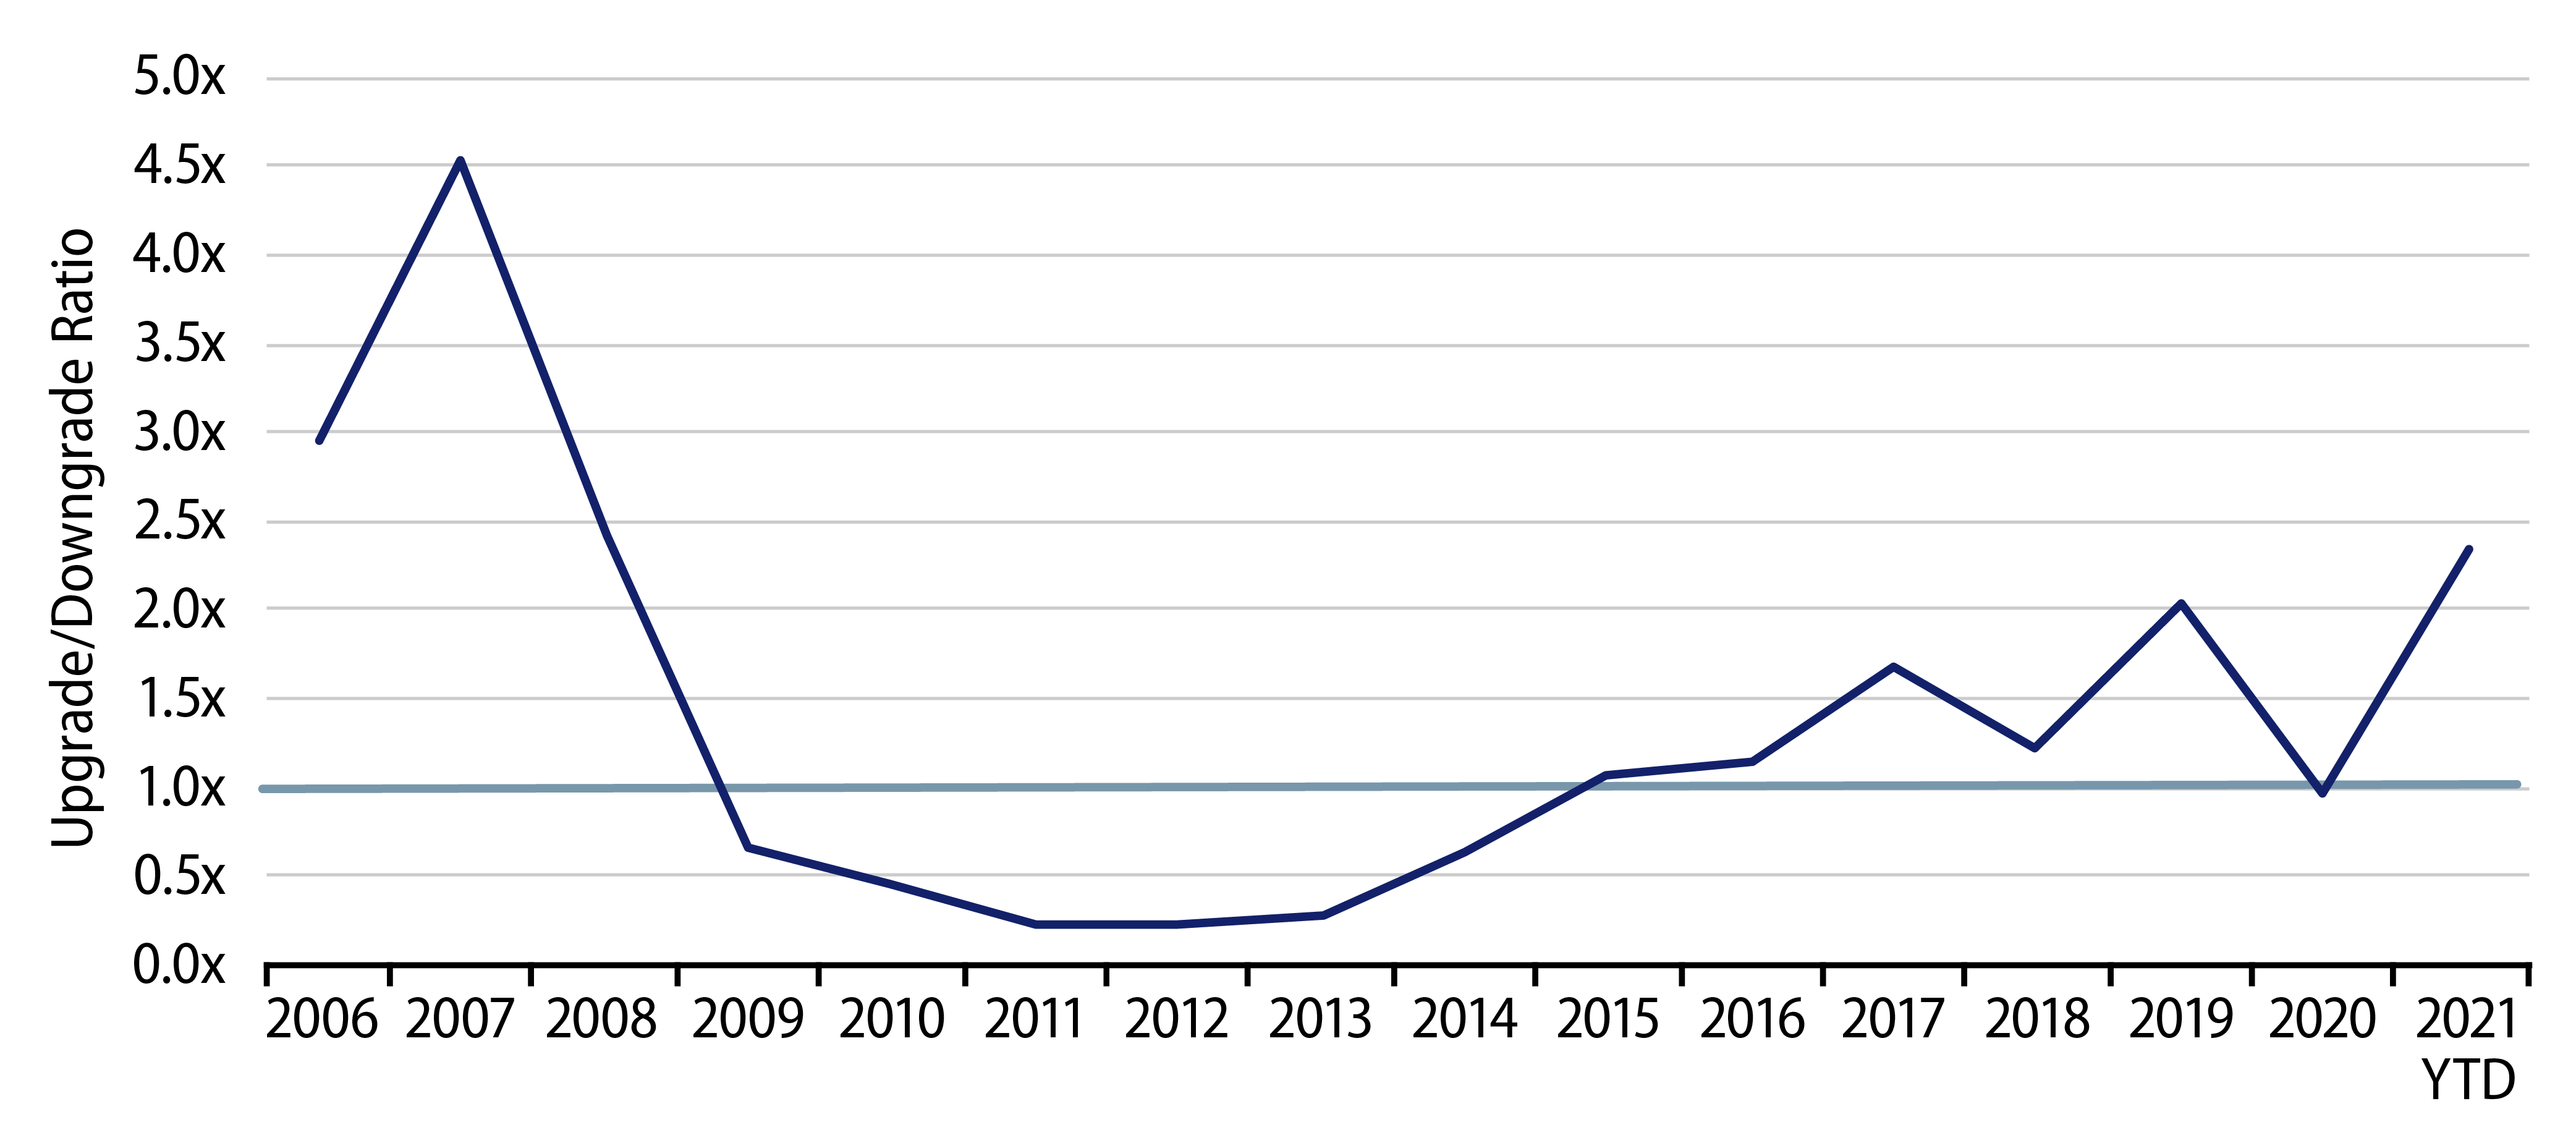
Rating agencies are also accounting for these budget improvements in their credit rating actions. In the first three quarters of 2021, Moody’s upgraded 393 issuers and downgraded 293 issuers, marking the highest year of upgrades relative to downgrades since 2008. We expect this positive trend to continue into early 2022. Issuers that have experienced heavy downgrade pressure over the last decade are receiving positive credit outlooks, and earlier this month S&P revised its outlook on Illinois’ BBB rating from stable to positive, joining Fitch, which improved its outlook to positive last June.


