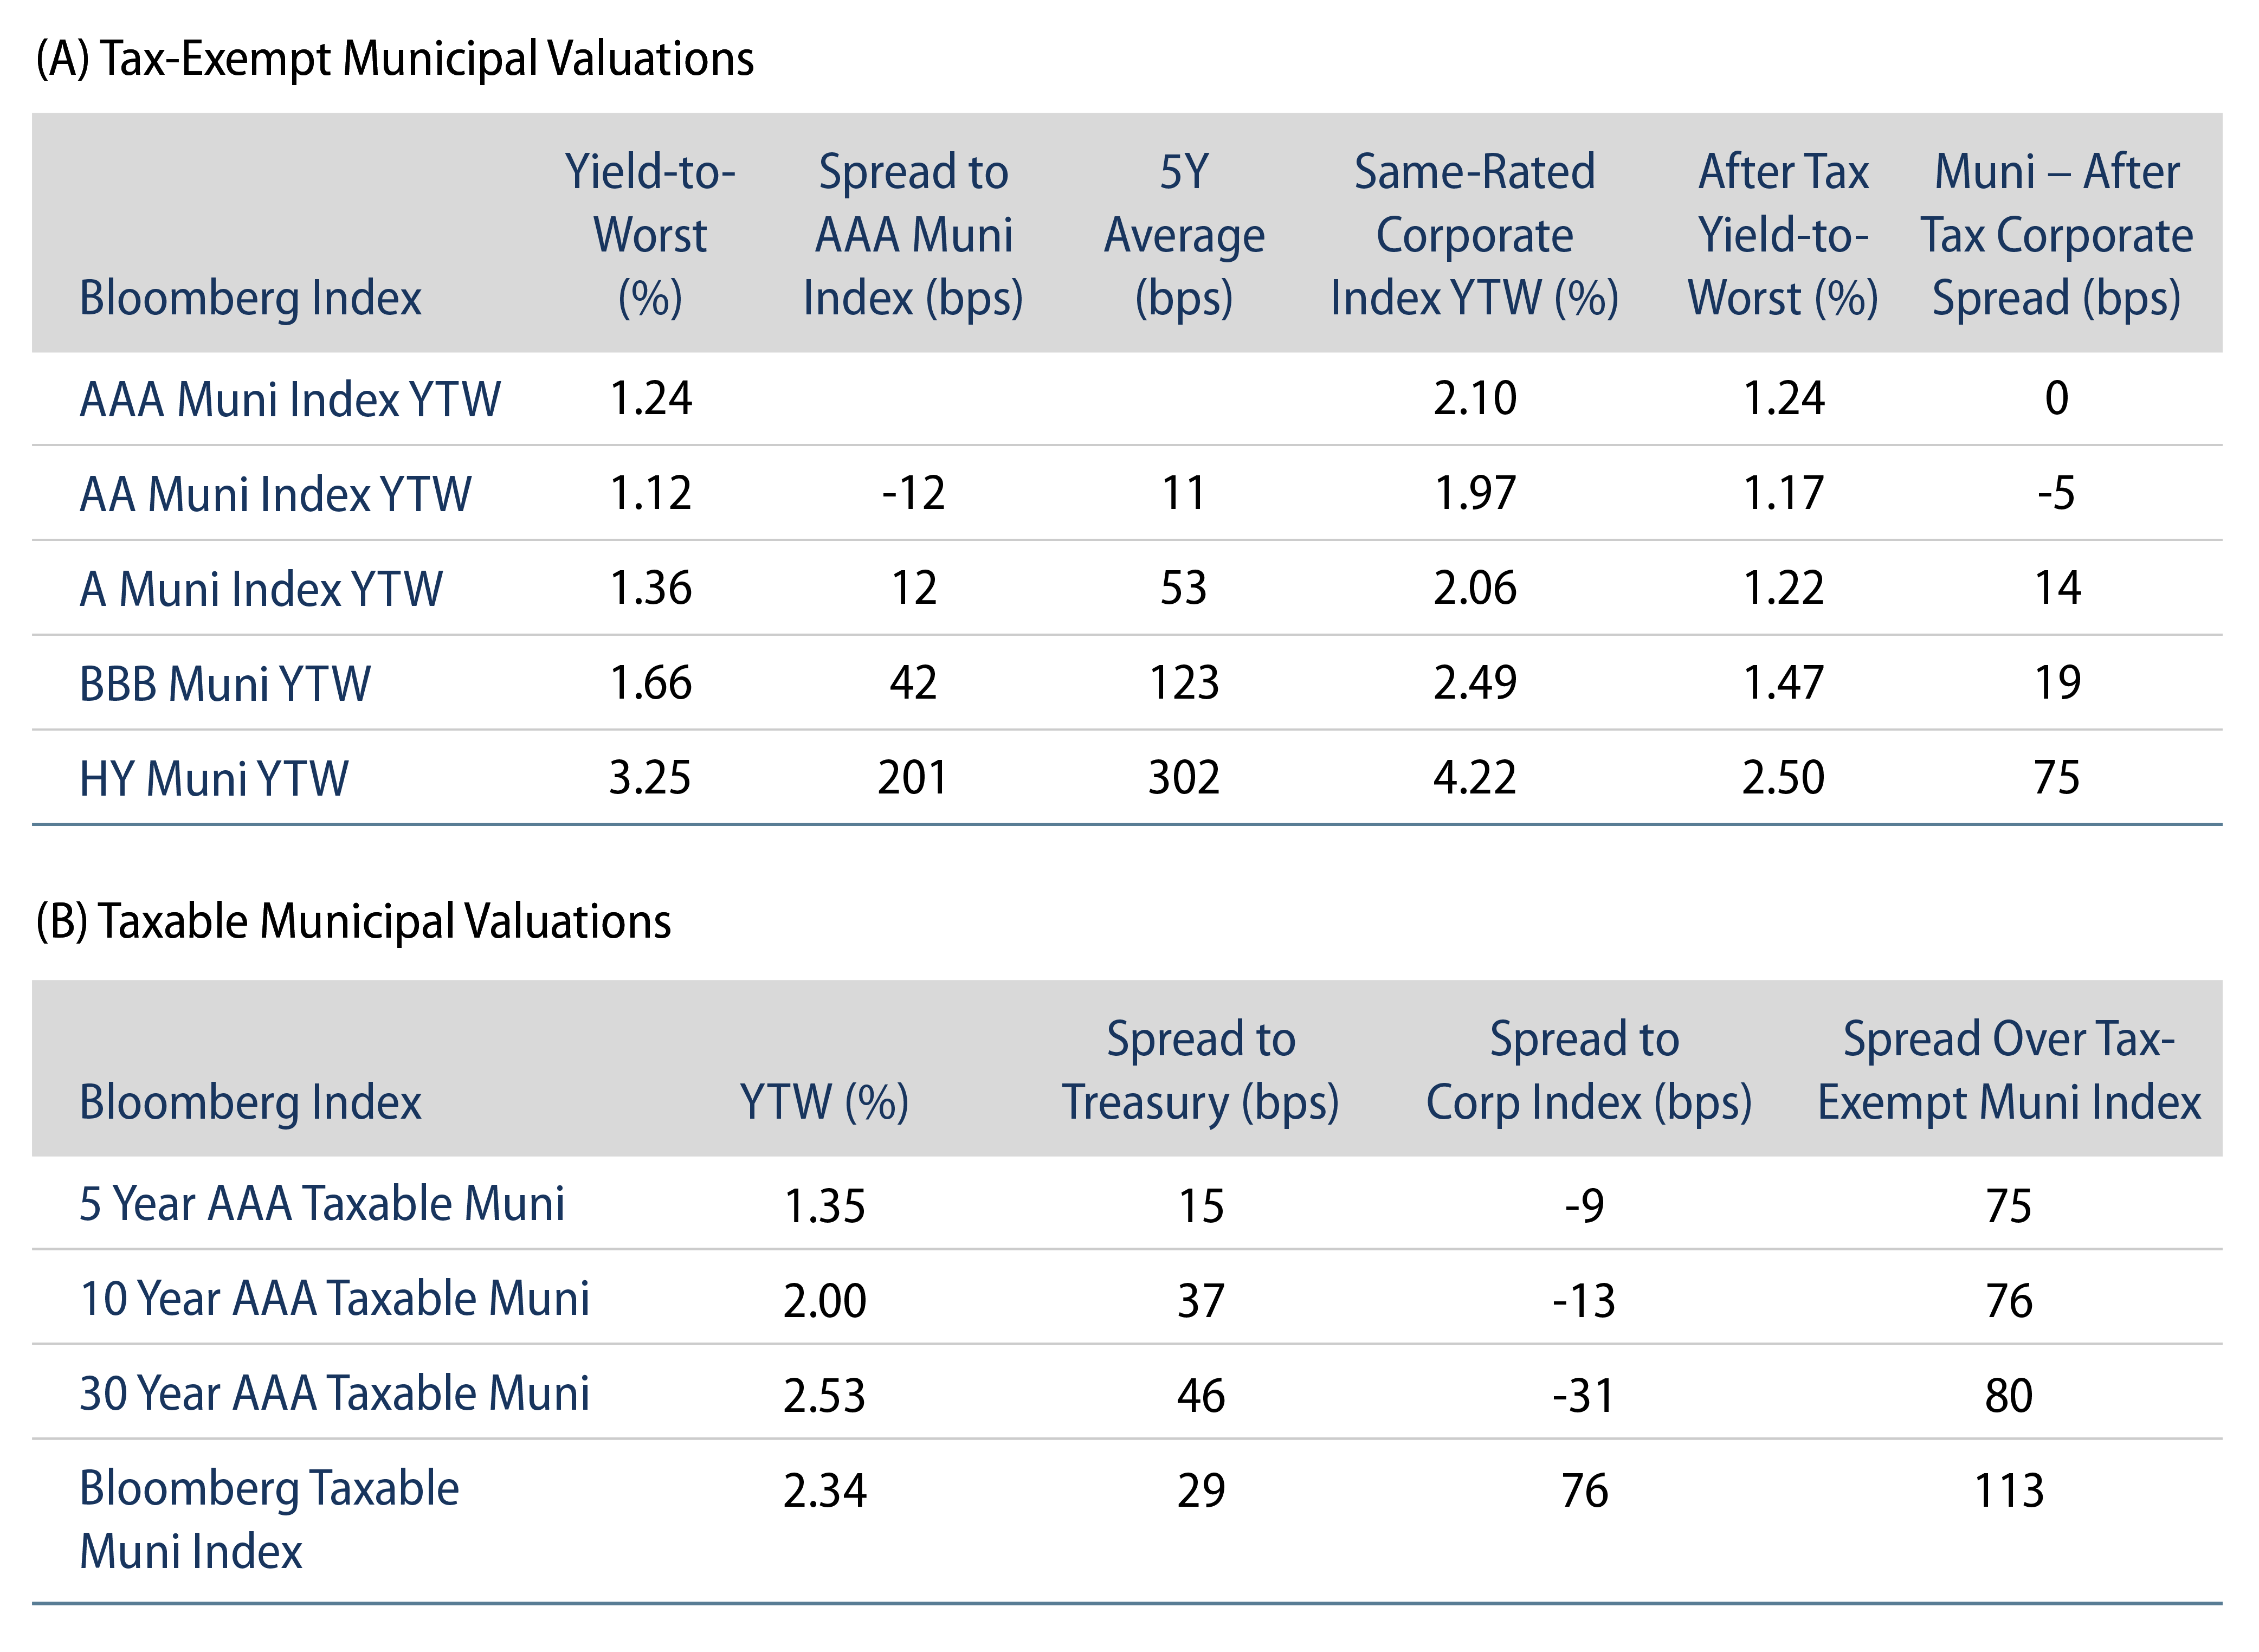
Municipal Yields Moved Higher Over the Week
US muni yields moved 5-8 bps higher across the curve. Municipals modestly underperformed Treasuries as ratios moved higher while technicals softened amid weakening demand and increased supply. The Bloomberg Municipal Index returned -0.29%, while the HY Muni Index returned -0.28%. This week we highlight recent state and local revenue trends, which have been supportive of municipal credit throughout the pandemic environment.
Technicals Soften Amid Elevated Supply and Slowing Demand
Fund Flows: During the week ending October 20, municipal mutual funds recorded $177 million of net inflows. Long-term funds recorded $44 million of outflows, high-yield funds recorded $58 million of outflows and intermediate funds recorded $147 million of inflows. Municipal mutual funds have now recorded inflows 74 of the last 75 weeks, extending the record inflow cycle to $152.5 billion, with year-to-date (YTD) net inflows also maintaining a record pace of $91 billion.
Supply: The muni market recorded $13 billion of new-issue volume during the week, up 43% from the prior week. Total issuance YTD of $380 billion is 1% higher than last year’s levels, with tax-exempt issuance trending 10% higher year-over-year (YoY) and taxable issuance trending 20% lower YoY. This week’s new-issue calendar is expected to decline to $9 billion of new issuance. The largest deals include $750 million Main Street Natural Gas and $708 million for the cities of Dallas and Fort Worth transactions.
This Week in Munis—State and Local Revenues Shine
Recent state and local revenue releases highlight the resiliency of municipal credit throughout the pandemic conditions. According to Census data released earlier this month, major state and local revenues declined just 1% in the 12 months ending June 2020 (coinciding with the fiscal year for most municipalities), despite the regional economic shutdowns and tax filing delays that pushed fiscal 2020 revenues into fiscal 2021.
As the recovery continued over the following 12 months ending June 2021, state and local major tax revenues increased 21%. Individual income taxes collections were most impacted by the filing delays and increased 71% YoY. Corporate income taxes increased 35%, property taxes increased 13% and sales taxes increased 10%. Right-sizing for the timing associated with delayed tax collections, average annual state and local revenues over the prior two years were 15% higher than average levels observed from 2017 to 2019. States attribute the favorable tax collections to the relative resilience of the higher income service sector, and improved sales tax collections supported by an increase in online transactions and disposable income related to the federal stimulus measures.
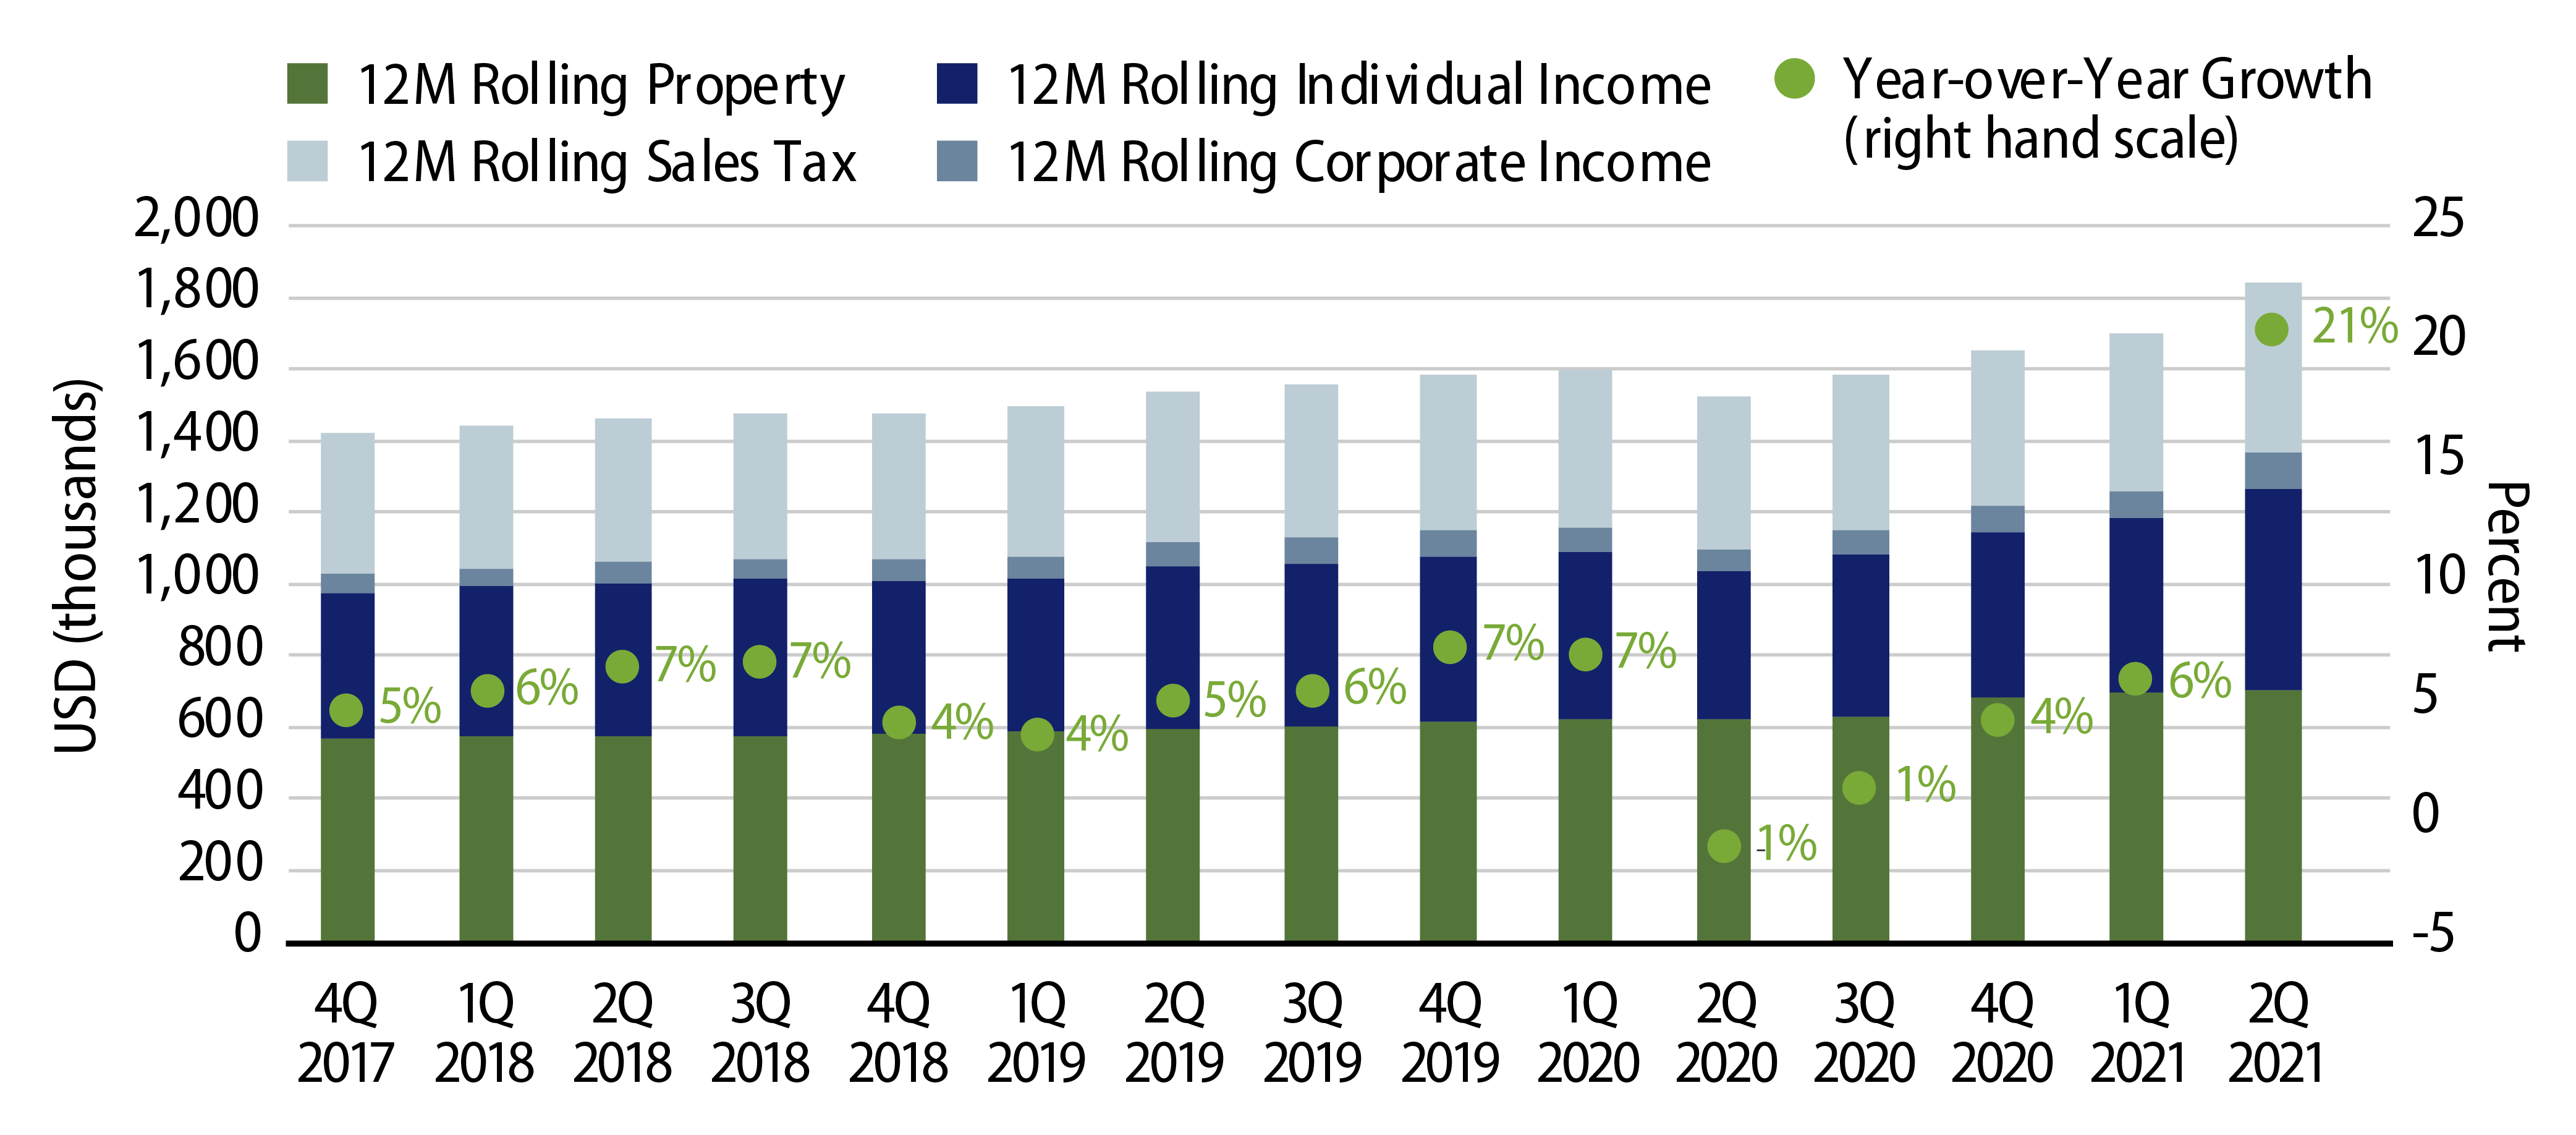
Importantly, revenue growth by state has been driven by the underlying economic composition, and not all states are reporting the same pace of recovery. The tax revenue growth has been less pronounced in states that are more reliant on tourism (Florida, Hawaii, Nevada) and oil production (Alaska, North Dakota, Wyoming). Meanwhile, higher-income states (Connecticut, California, Utah and New York) were among the states that observed the largest growth in tax collections.
The effect of higher tax collections has thus far had a positive impact on tax-backed municipal bond valuations. Lower-rated general obligation and tax-backed securities have outperformed over the past year, where spreads for some of the stronger security structures narrowed more modestly. Fundamentally, we continue to anticipate state and local tax collections will be supported by reopening trends that should be supportive of income and sales tax collections, recent home price appreciation and rebounding demand for crude, which should support revenues of the states that have lagged over the past year.