
In his latest market commentary, Western Asset CIO Michael Buchanan examines the impact of rising public debt and market concerns over government fiscal policies. Elevated debt levels and fiscal policies have increased bond market volatility. Michael discusses the implications of global debt burdens by region with Western Asset’s key macro decision-makers.
KEY TAKEAWAYS
- Public debt in many countries has risen to historical highs relative to output. There are concerns that the sustainability of government debt burdens and the risk of higher government bond yields, particularly in longer maturities, could escalate the cost of servicing debt.
- Elevated debt and concerns over debt sustainability and fiscal policies have been factors behind the increase in volatility in government bonds, especially in countries with higher debt levels such as the US, UK and France.
- As discussed in our recent blogs, concerns about the extent and impact of the Trump administration’s tariffs and the direction of US fiscal policy have raised questions about the global demand for USTs and other major government bonds by non-domestic investors.
- We recognize that over short periods some investors may seek to impose fiscal discipline on governments they perceive as profligate for raising their borrowing costs. Over longer periods, however, we are confident that trends in inflation, economic growth and central bank policy will remain the primary determinants of DM bond yields.
- Higher tariffs could impact prices, clouding inflation and monetary policy outlooks, but the scale, persistence and policymaker responses are highly uncertain. We expect inflation to slow gradually to central bank targets, which should facilitate further rate cuts, especially if economies falter. These macro fundamentals should underpin bond market valuations despite significant and persistent government borrowing needs.
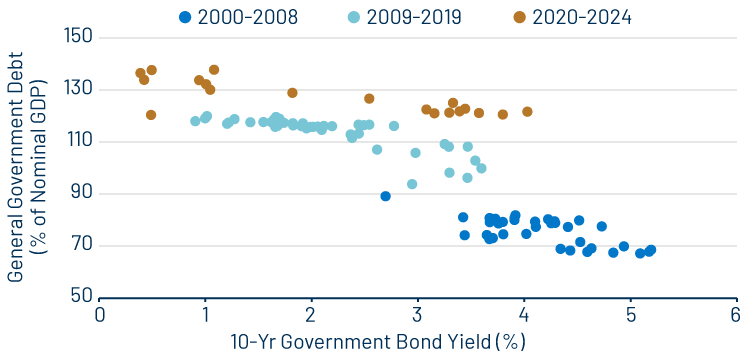
The rise in public sector debt that we have witnessed in the last 25 years accelerated during two major crises: first, during the global financial crisis (GFC) in late 2008 and 2009 and then during and in the years following the 2020 COVID-19 pandemic. Both periods saw policymakers sanction unprecedented increases in debt-financed public spending to support their economies and ensure financial stability. Elevated debt levels and budget deficits along with loose fiscal policies have seen rating agencies downgrade the credit ratings of a number of sovereign debt issuers to leave only a handful of AAA rated countries. Rising inflation and interest rates are increasing debt service costs and potentially making fiscal dynamics more fragile. To what extent will investors factor these trends into their allocations to government bonds in each region?
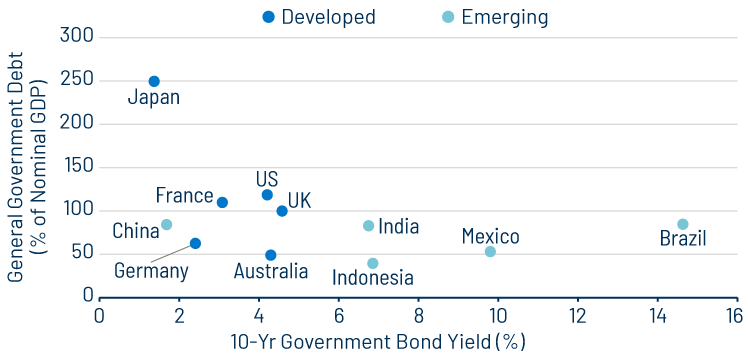
Government Debt data as of 31 Dec 23.
* GDP-weighted average of Australia, Canada, France, Germany, Italy, Japan, Norway, Spain, Sweden, UK, US.
GLOBAL PERSPECTIVES
,
United States

Mark S. Lindbloom
Deputy CIO & Head of Broad Market Portfolios

Nicholas J. Mastroianni, CFA
Portfolio Manager
From 2001 to year-end 2024, the ratio of publicly held debt-to-GDP in the US surged from 32% to 98% and total debt-to-GDP surged from around 55% to an estimated 122%. This dramatic increase is attributed to several factors, including the Bush- and Trump-era tax cuts, extraordinary fiscal responses to the GFC and the Covid pandemic, rising health care costs, an aging population and growing net interest expenses. While both sides of the political aisle have voiced concerns over fiscal sustainability, neither has been able to implement credible solutions, which would likely involve a combination of entitlement reform, increased tax revenue, reduced spending and/or policies aimed at increasing growth, productivity and labor force participation.
Looking ahead, a recent report from the Congressional Budget Office projects US publicly held debt-to-GDP will rise from 98% to 118% by year-end 2035. If realized, this would easily be the highest debt-to-GDP ratio in US history, and the likely extension of the expiring Tax Cuts and Jobs Act would push this estimate higher still. Net interest costs are just over 3% of GDP, close to 10% of tax revenues, and comprise almost half of the federal deficit. With net interest costs continuing to rise as a percentage of future deficits, the prospect of a “debt spiral” and the associated consequences remain top-of-mind for bond investors.
While it’s tempting to conclude that higher levels of government debt will always result in higher yields and inflation, history tells us there are exceptions. When assessing the impact of rising debt-to-GDP on yield levels, one must consider country-by-country factors including business and credit-cycle conditions, inflation dynamics, demographics and central bank credibility. For the US, global reserve currency status and flight-to-quality properties of US Treasuries (USTs) have often meant lower yields during periods of market or geopolitical turmoil, even in the face of rising supply. Moreover, UST yields generally have a stronger correlation to inflation and official interest rates than they do to increases in government debt. That said, we are highly attuned to the risk that this time could be different given recent geopolitical developments, alternative “safe haven” bond assets globally and inadequate political consensus to make requisite budgetary changes in the US.
As deficits have risen, concerns about a supply/demand mismatch in the market for USTs have also increased. With the shift away from a world dominated by quantitative easing (QE), demand for USTs in recent years has moved back toward price-sensitive buyers. Households (including hedge funds), mutual funds and pension funds have increased their share of total USTs outstanding, while the Federal Reserve, foreign public institutions and US banks have decreased their holdings. Several factors tend to influence demand from these distinct investor groups, including the level of yields, the shape of the yield curve, regulatory conditions, and the prevailing correlations among risk-free and non-UST assets. Much scrutiny is likely to remain on the evolution of the overall buyer base, and uncertainty around the absorption of increasing supply is likely to lead to increased volatility and on average a higher term premium relative to the days of zero interest rate policy and extensive QE.
Improving debt-to-GDP ratios necessitates a delicate balance of moderate inflation, positive GDP growth and stable longer-term bond yields. Moderate inflation levels erode the value of real debt and tend to correlate with higher nominal GDP and higher tax revenue. As long as longer-term inflation expectations remain well anchored, debt servicing costs can stay relatively stable. As we saw in the fall of 2023, bond yields tend to respond more negatively to increasing UST supply at times when inflation readings are elevated and more volatile.
Our base case anticipates that real GDP growth will range from 1% to 2% in 2025, not far below recent trends. Although there are concerns about public sector borrowing “crowding out” more productive private sector spending and investment, we have not observed this effect at current interest rate levels. However, in lower-probability recession scenarios, we worry that the government’s ability to implement countercyclical policies may be limited due to already high debt levels. Conversely, other governmental initiatives could negatively impact various sectors of the economy, dampening consumer spending and sentiment. If this path is followed in 2025, there may be a “flight to quality” that supports demand for USTs. In such a scenario the level of UST debt will not be a concern, leading to a decline in interest rates.
| Sov | General Gov Balance (% of GDP)1 | Current Acct Surplus (% of GDP)2 | Foreign Ownership (% of outstanding bonds)3 | Sov Debt Rating4 |
|---|---|---|---|---|
| US | -7.1 | -3.3 | 30-35 | Aaa/AA+/AA+ |
| Canada | -0.6 | -0.7 | ~30 | Aaa/AAA/AA+ |
2Current account balance data shown as percentage of GDP, according to the World Bank. As of 31 Dec 23;
3BofA Global Research, Bloomberg, central government websites;
4Sovereign debt ratings (from left to right: Moody’s, S&P, Fitch), according to Bloomberg. As of 20 Mar 25.
Europe

Richard A. Booth
Portfolio Manager
Fiscal spending in Europe has garnered significant attention over the last few years, and indeed even more in the first quarter of this year. Recently, we have seen significant new EU-wide defence spending proposals as well as German defence and infrastructure fund plans. German and other eurozone government bond yields have risen relative to other developed market (DM) yields in response to these announcements, predominantly due to the potential upward effects on growth and inflation and as the market anticipates the possibility of additional net borrowing.
German government debt is roughly 60% of GDP. This remains very low compared to its eurozone economy peers as a result of the strict self-imposed limits of the German debt brake that restricts both state and federal spending. This has ensured Germany’s Aaa/AAA sovereign rating has remained intact. The unprecedented German spending plans represent roughly 21% of current GDP but split over several years. Defence spending typically has a much smaller spillover to the broader macroeconomy. The infrastructure spending bill has the potential to boost economic activity and confidence and revive the ailing German economy but the ramp-up is expected to be slow. The German economy has been operating below its potential in recent years. Reasons include a historical lack of infrastructure investment, an aging population, the threat of deglobalisation and competition from lower-cost producers overseas. The latter factors remain in play and continue to be headwinds to a rebound in growth. Significant upside inflationary pressures are also unlikely given the current spare capacity in the economy. We expect the European Central Bank (ECB) to continue with rate cuts this year with eurozone headline inflation on track to meet the ECB’s 2% target and service inflation beginning to soften. We maintain a modest overweight duration position via both nominal and real yields.
Other core and peripheral eurozone economies face greater challenges with respect to their fiscal positions. For example, French fiscal policy remains under sharp scrutiny with a recent credit rating downgrade by Moody’s in December 2024 to Aa3. A disagreement over the 2025 fiscal budget amid broader political turmoil last year saw French government bonds underperform their German counterparts. As such, outside of Germany we expect the bulk of any additional defence spending to be funded by reduced spending elsewhere rather than by meaningfully higher budget deficits.
| Sov | General Gov Balance (% of GDP)1 | Current Acct Surplus (% of GDP)2 | Foreign Ownership (% of outstanding bonds)3 | Sov Debt Rating4 |
|---|---|---|---|---|
| Germany | -2.6 | 5.9 | 40 | Aaa/AAA/AAA |
| France | -5.5 | -1 | 46 | Aa3/AA-/AA- |
| Italy | -7.2 | 0 | 20 | Baa3/BBB/BBB |
| Spain | -3.5 | 2.7 | 32 | Baa1/A/A- |
2Current account balance data shown as percentage of GDP, according to the World Bank. As of 31 Dec 23;
3BofA Global Research, Bloomberg, central government websites;
4Sovereign debt ratings (from left to right: Moody’s, S&P, Fitch), according to Bloomberg. As of 20 Mar 25.
United Kingdom

Dean French
Portfolio Manager
Public finances in the UK have been under the spotlight several times recently, including at the beginning of this year. On this occasion, though, it did not stem from any new domestic news, but rather the result of a rise in global government bond yields, which eroded Chancellor Rachel Reeves’ “fiscal headroom” versus her self-imposed fiscal rules, exacerbated by softer-than-forecast economic growth. The subsequent decline in yields and some better-than-feared economic data has provided some relief for UK government bonds even though they remain substantially higher than levels prevailing when the Labour government took office in July 2024.
It was reassuring to see that a recent announcement for additional defence spending, albeit relatively modest, did not put UK government bond yields under renewed pressure. This was in large part due to the planned spending expected to come from reduced foreign aid and the Chancellor’s commitment to fiscal discipline. Ahead of updated forecasts by the Office for Budget Responsibility and the Spring Budget Statement at the end of this March, markets have been comforted by reports that the Chancellor will look to restore the fiscal headroom by reduced spending.
The Bank of England (BoE) has been reducing its Bank Rate to lower the restrictiveness of monetary policy as inflation is forecast to return to target over the forecast horizon. The market is discounting a slowing in the pace of interest rate cuts later this year as base effects, largely related to energy prices, will lift headline inflation in the coming quarters. The BoE has emphasised the importance of considering underlying inflation pressures, however, and it has continued to ease policy. Slack returning to the labour market should provide additional confidence for the BoE to withdraw monetary policy restraint beyond what the market is currently discounting as discussed in our blog. This is something that the Chancellor would certainly welcome.
| Sov | General Gov Balance (% of GDP)1 | Current Acct Surplus (% of GDP)2 | Foreign Ownership (% of outstanding bonds)3 | Sov Debt Rating4 |
|---|---|---|---|---|
| UK | -6 | -2 | ~30 | Aa3/AA/AA- |
2Current account balance data shown as percentage of GDP, according to the World Bank. As of 31 Dec 23;
3BofA Global Research, Bloomberg, central government websites;
4Sovereign debt ratings (from left to right: Moody’s, S&P, Fitch), according to Bloomberg. As of 20 Mar 25.
Japan

Hiroyuki Kimura
Head of Investment Management, Tokyo
Japan’s debt-to-nominal-GDP ratio was extremely high at 250% (total outstanding amounts of Japanese government bonds [JGBs] vs. nominal GDP) at the end of 2024, and the sovereign rating of JGBs was lower than those of other DM countries. On the other hand, JGB yields are relatively stable and the sovereign risk premium seems to be well contained due to (a) the fact that the majority of government debt is domestically financed by the Japanese private sector with huge savings on the back of the massive amount of current account surplus, and (b) the Bank of Japan’s (BoJ) QE efforts mean the central bank currently holds approximately 50% of the outstanding JGBs. Importantly, despite the BoJ beginning to normalize monetary policy through policy rate hikes and quantitative tightening (QT), we are yet to see a significant rise in yields. In addition, the debt-to-nominal-GDP ratio has improved by approximately 10% due to high inflation. In conclusion, the rising sovereign debt level may be problematic, but it has not been a big issue so far in Japan.
Risks of lower long-term economic growth and higher inflation cannot be ruled out in the long run. The BoJ’s normalization of policy, especially a failure to implement QT, a further downgrade of credit ratings of JGBs and increases in overseas investment, partly due to a weakening home bias, all have the potential to push JGB yields higher. Should JGBs be downgraded further, we would expect the cost of financing in the private sector also to be adversely impacted. If JGB yields increase significantly, the BoJ likely would be heavily involved in public debt management by purchasing JGBs, which could lead to a collapse of credibility in JGBs. As we shared in our outlook for BoJ monetary policy, less credible Japanese government debt could trigger higher inflation from a weaker Japanese yen, negative real policy rates with elevated inflation expectations, the spiral of the domestic currency’s depreciation and soaring inflation expectations.
The implications for fixed-income investment in Japan would be complicated as the probability of the aforementioned risks is uncertain. In essence, it depends on fiscal discipline. Therefore, it is necessary to work urgently to build a sustainable fiscal structure through rationalization and efficiency expenditures and social security reforms. In our view, the primary goal would be to secure market confidence in public finances to avoid the risk.
| Sov | General Gov Balance (% of GDP)1 | Current Acct Surplus (% of GDP)2 | Foreign Ownership (% of outstanding bonds)3 | Sov Debt Rating4 |
|---|---|---|---|---|
| Japan | -4.2 | 3.6 | 10-15 | A1/A+/A |
2Current account balance data shown as percentage of GDP, according to the World Bank. As of 31 Dec 23;
3BofA Global Research, Bloomberg, central government websites;
4Sovereign debt ratings (from left to right: Moody’s, S&P, Fitch), according to Bloomberg. As of 20 Mar 25.
Australia

Anthony Kirkham, CFA
Deputy CIO & Head of Investment Management, Asia and Australia
Sovereign debt levels in Australia have been a topic of great concern in the aftermath of the pandemic and as the federal government has faced greater challenges in balancing the budget due to the demands on public services, in particular health care, infrastructure and other support programs.
Australia’s gross government debt remains relatively manageable compared to other DM countries at around 50% of GDP (based on IMF data), but the recent rapid upward trajectory has raised concerns. The nation’s debt-to-GDP ratio was in the mid-20s prior to the pandemic, and it was at just 5% before the GFC. Forecasts by the current government of marginal growth in normal times before ultimately flattening have driven concern. The issue has also piqued the public interest as yields rose in the wake of inflationary pressures, and the cost of funding debt became more topical for everyone.
Critically, Australia continues to maintain AAA/Aaa/AAA ratings from the major rating agencies Standard & Poor’s, Moody’s and Fitch, respectively. These ratings continue to highlight the country’s strong economic fundamentals and its ability to meet all debt obligations and are all currently stable.
In summary, the local market issues are less concerning in the short term than the impact of debt levels of other DM countries where increasing supply concerns are pressing on markets. The impact on Australian government bonds stems primarily from the natural pricing relativities between the yield levels of say the US versus Australia, rather than local gross debt levels. Also, the need to attract capital for investment always remains an important driver, even though in recent times the Australian economy has entered a period where the level of national savings has surpassed investment, and Australia has become a net exporter of capital.
Finally, while global inflation is considered a risk and as bond supply increases, overall yields pressing higher will ultimately push local bond yield levels as well, particularly in longer maturities. This will then impact the level of interest paid on debt, and therefore the future budgets of the Australian government. Consequently, slower growth rates are likely if the yields globally are higher globally, with the more indebted nations taking the greatest hit. Fortunately, for now, Australia will fare well on these metrics.
| Sov | General Gov Balance (% of GDP)1 | Current Acct Surplus (% of GDP)2 | Foreign Ownership (% of outstanding bonds)3 | Sov Debt Rating4 |
|---|---|---|---|---|
| Australia | -0.9 | 0.3 | ~45 | Aaa/AAA/AAA |
| New Zealand | -3.3 | -6.8 | 61 | Aaa/AA+/AA+ |
2Current account balance data shown as percentage of GDP, according to the World Bank. As of 31 Dec 23;
3BofA Global Research, Bloomberg, central government websites;
4Sovereign debt ratings (from left to right: Moody’s, S&P, Fitch), according to Bloomberg. As of 20 Mar 25.
Latin America

Prashant Chandran, CFA
Interim Head of US Emerging Markets
In most of Latin America, sovereign debt levels as a share of GDP increased steadily during 2019-2025, reflecting increased net borrowing during the pandemic and ongoing fiscal pressures following the economic recovery. Debt-to-GDP levels in Latin America’s major economies are on pace to average a new high of 55% this year—well below the global debt level of 93%—but still high by Latin America’s historical standards and the region’s capacity to borrow.
Sovereigns like Brazil and Mexico have contained exchange rate risk by: (a) developing their local capital markets, often through pension reform, (b) borrowing primarily in local currency in the domestic market and (c) building up their stock of gold and foreign exchange (FX) reserves. Sovereigns in the region have also issued a high share of their liabilities through long-term fixed-rate debt, making them less vulnerable to rollover risk from sudden spikes in interest rates.
The combination of higher debt and recently high global interest rates has worsened the interest burden of most sovereigns, with financing costs averaging well above advanced economies and other emerging market (EM) economies. Sustained higher borrowing costs from high and sticky inflation should weigh on short-term growth while a more polarized world will also lower long-term growth potential across the region.
Latin America’s average growth rate is forecast at 2% in 2025, which is below the growth rate in other EM regions. Slow growth will make it difficult, absent fiscal reforms, to run moderate fiscal deficits and thereby contain the burden of sovereign debt. Fiscal discipline should also help tame inflation, which would ease the pressure on monetary policy—Argentina under the Milei administration is a shining example.
Local real interest rates across most of Latin America continue to look attractive. Despite market volatility, positive total returns driven by carry should be the base case in the coming months. Our recommendation is one of cautious optimism in local rates over the medium-term while taking a more tactical view on currencies in the region. Given the dispersion in growth and inflation across the economies in Latin America and the beta to tariffs, differentiated analysis in viewing each country’s fundamentals independently rather than the region as a whole will be key.
| Sov | General Gov Balance (% of GDP)1 | Current Acct Surplus (% of GDP)2 | Foreign Ownership (% of outstanding bonds)3 | Sov Debt Rating4 |
|---|---|---|---|---|
| Brazil | -7.6 | -1 | 10 | Ba1/BB/BB |
| Mexico | -4.3 | -0.3 | 14 | Baa2/BBB/BBB- |
2Current account balance data shown as percentage of GDP, according to the World Bank. As of 31 Dec 23;
3BofA Global Research, Bloomberg, central government websites;
4Sovereign debt ratings (from left to right: Moody’s, S&P, Fitch), according to Bloomberg. As of 20 Mar 25.
Asia (ex. Japan)

Desmond Soon, CFA
Head of Investment Management, Singapore
While China’s debt levels are high, they remain domestically anchored and supported by a closed capital account and high savings levels at around 45% of GDP. There are concerns about off-balance-sheet fiscal financing, such as Chinese local government debt. These off-balance-sheet liabilities can cloud the fiscal picture and may pose risks to fiscal stability and investor confidence. Chinese leadership is aware of the significant risk of local government off-balance-sheet debt, specifically that in local government financing vehicles. Work is in progress to reduce local government financing demands while issuing debt at the central government level at lower borrowing costs. In the medium term, it would take debt swaps as well as continued commitment for the central government to take on more fiscal responsibilities to reduce local government and off-balance-sheet financing risks.
While deflationary pressures remain and confidence is weak amidst property market concerns, sentiment is improving, albeit from a low starting point. For now, even as growth challenges persist with trade tensions high, it does appear that domestic conditions are improving. Fiscal stimulus has been announced with support for local government debt refinancing with fiscal deficit rising to an unprecedented 4%. The People’s Bank of China (PBoC) has signalled a shift in policy to economic recovery. PBoC Governor Pan has stressed that China will cut rates and the reserve requirement ratio (RRR) when the window of opportunity emerges.
Away from China, sovereign debt levels broadly across Asia ex-Japan are relatively low and at manageable levels. That being said, Asia ex-Japan is a geographically large region with disparate economies. As a result, sovereign debt levels and servicing abilities vary significantly across different countries within the region.
We think it’s important to segregate our discussion between DM Asia and EM Asia. DM Asia, in general, has stronger fiscal health compared to its global peers, and has a track record of current account surpluses. There are sufficient savings to anchor its domestic government bond market. Well-anchored supply-demand dynamics at the long-end of the Asian government bond market results in a lack of term premium. As a result, yield curves are generally flatter than their DM peers.
On the other hand, EM Asian economies (e.g., Indonesia, India and the Philippines) have current account deficits (CADs), and require foreign capital and direct financing. EM Asia may face significant challenges in attracting foreign capital, in part due to the US push to attract capital. Countries with high CADs, high debt-to-GDP levels and significant foreign ownership can make the EM Asia domestic government bond market particularly vulnerable to capital withdrawals and currency weakness, especially amid a strong US dollar backdrop.
Currently, inflation in Asia is generally low, except for volatile food prices. The low inflation impulse allows for more accommodative monetary policies in this cycle. The stable fiscal environment, accommodative monetary policy and well-anchored bond markets in DM Asia present attractive opportunities for fixed-income investors. Low term premiums and sound fiscal health contribute to DM Asia bonds providing alpha and diversification opportunities compared to traditional DM government bond markets. Potential capital outflows and currency volatility suggest the need for a cautious and selective approach to EM Asia, favouring countries with better fiscal management and lower CADs. Investors should closely monitor off-balance-sheet liabilities (for example in China and Indonesia) for hidden risks that can impact sovereign credit ratings and bond market stability.
| Sov | General Gov Balance (% of GDP)1 | Current Acct Surplus (% of GDP)2 | Foreign Ownership (% of outstanding bonds)3 | Sov Debt Rating4 |
|---|---|---|---|---|
| China | -6.9 | 1.4 | <10 | A1/A+/A+ |
| Hong Kong | -5.7 | 9.2 | Aa3/AA+/AA- | |
| South Korea | -0.7 | 2.1 | ~20 | Aa2/AA/AA- |
| Malaysia | -4.6 | 1.6 | 21 | A3/A-/BBB+ |
| Singapore | 3.5 | 19.8 | Low | Aaa/AAA/AAA |
| Thailand | -2 | 1.4 | ~10 | Baa1/BBB+/BBB+ |
| Philippines | -4.4 | -2.7 | <5 | Baa2/BBB+/BBB |
| Indonesia | -1.6 | -0.2 | 14.50 | Baa2/BBB/BBB |
| India | -8.3 | -0.9 | <5 | Baa3/BBB-/BBB- |
2Current account balance data shown as percentage of GDP, according to the World Bank. As of 31 Dec 23;
3BofA Global Research, Bloomberg, central government websites;
4Sovereign debt ratings (from left to right: Moody’s, S&P, Fitch), according to Bloomberg. As of 20 Mar 25.
CONCLUSION
"Despite the heightened debate over the sustainability of public debt levels, our view is that over the long-term, government bond returns will continue to be driven by inflation, economic growth and the path of monetary policy."
,
Government debt levels have risen faster than national income in many countries over the last few decades. Fiscal dynamics appear increasingly unstable given the rising costs of debt service and absent determined efforts to tighten fiscal policies. During the era of ultra-easy monetary policy that followed the GFC, interest rates at or close to zero ensured that government debt ratios were, in large part, sustainable, even as growth remained moribund. The surge in inflation as the global economy emerged from the pandemic in 2022 and the sharp tightening of monetary policy have seen the cost of servicing government debt inflate materially. At the same time, deteriorating demographics are placing increased demands on health and social security spending. In addition, the pursuit of global environmental sustainability has been supported by public funds, and rising geopolitical tensions have catalysed more publicly funded defense spending. While the importance of each of these factors will no doubt ebb and flow over time, the fundamental issue remains; government finances are facing increasing demands.
While we recognize the near-term concerns with rising debt levels, we think it is important to take a step back and view the situation from a wider lens. There is little relationship to support the argument that higher debt levels lead to higher government bond yields, as theory would imply. This aligns with the input from our global macroeconomic research teams. It also supports our view that, over the long term, government bond returns are primarily driven by fundamental factors such as inflation, economic growth and central bank policy. We continue to expect a gradual slowing of inflation back to central bank targets. The decline in inflation should allow key DM central banks to continue to reduce policy rates. Ultimately, in our opinion, it is these macro fundamentals that will underpin bond market valuations despite significant and persistent government borrowing needs.