

What the New Mortality Tables Mean to Your Defined-Benefit Plan
Executive Summary
- Coming changes to actuarial mortality tables will raise a typical DB plan’s liability valuation by something in the neighborhood of 6%–8%.
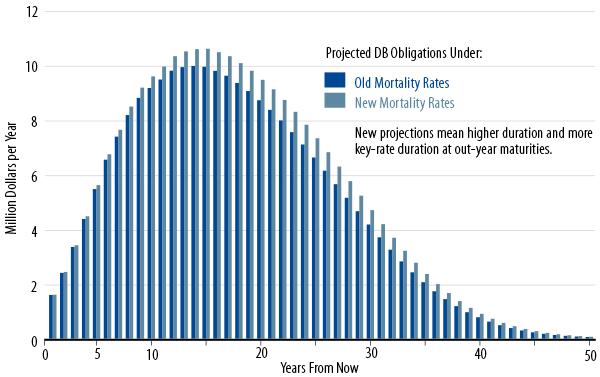
- Since mortality rates will drop most sharply for older beneficiaries, the duration of plans’ liabilities will increase, especially the key-rate-durations of long-dated cash flows.
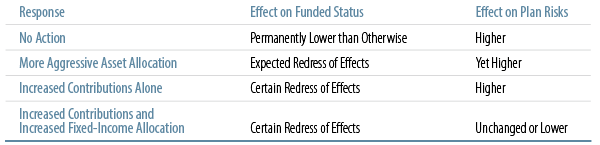
- While plans’ natural inclination to the changed mortality rates would be to shift to more aggressive asset allocations, they might do well to rethink this response, given the heightened risks associated with such action, thanks to the higher durations of liabilities.
- An alternative response would be to increase cash contributions, possibly even increasing plan assets’ duration.
- The appropriate combination of increased cash contributions and changes in asset allocation will depend on each plan’s assessment of its own unique features and appetite for risk.
A Defined-Benefit (DB) pension plan’s obligations to its beneficiaries are estimated by applying assumed mortality rates to the plan’s census of beneficiaries, both active and retired. As one would guess, the longer beneficiaries can be expected to survive and collect benefits, the larger will be the liabilities of the plan, and, so, the lower the funded status. The American Society of Actuaries (SOA) has announced that it will introduce new mortality projections this year and that these projections will result in longer projected life expectancies for most cohorts. We analyze here the effects of those changes and discuss strategies plan sponsors might take to cope with the coming changes.
Scales RP-2000, AA, and BB Giving Way to MP-2014 and RP-2014. Life expectancy has been steadily increasing in the US over the last century, so much so that mortality tables based on past experience can be expected to overstate future mortality rates and thus understate future longevity. As this has been the case for some time, the SOA has taken to publish mortality improvement tables, tables that prompt actuaries to determine how much they should reduce projected mortality rates below what is indicated by existing mortality tables proper. Presently, the SOA members utilize RP-2000 mortality tables, enhanced with mortality improvement rates known as Scale AA.
In 2012, the SOA announced the intention to shift to a Scale BB that featured even faster improvements in mortality than did Scale AA1. In announcements early this year, it further upgraded Scale BB to an enhanced improvement scale called MP-2014, and it also introduced new, base mortality tables RP-20142. When both these tools are fully implemented by actuaries, assumed mortality rates will be much lower than previously, resulting in substantial increases in DB liability valuations and similar declines in funded status.
That’s not all. As it happens, most of the coming decline in mortality rates will be for very old beneficiaries. That is, while projected mortality rates for young workers will be only slightly different, those for older workers and for retired “annuitants” will be more significantly higher. And even more importantly, mortality rates will be assumed to decline even more rapidly in the future, so that life expectancy for a person who will be, say, 85 in 2025, will increase even more than that for someone who is 85 today.
Percent Change in Due Value of Annuity for Male Beneficiaries by Current Age*
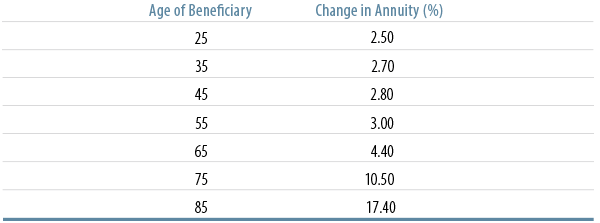
Source: Society of Actuaries (2014-1) Table 1.1 etc.
A Defined-Benefit (DB) pension plan’s obligations to its beneficiaries are estimated by applying assumed mortality rates to the plan’s census of beneficiaries, both active and retired. As one would guess, the longer beneficiaries can be expected to survive and collect benefits, the larger will be the liabilities of the plan, and, so, the lower the funded status. The American Society of Actuaries (SOA) has announced that it will introduce new mortality projections this year and that these projections will result in longer projected life expectancies for most cohorts. We analyze here the effects of those changes and discuss strategies plan sponsors might take to cope with the coming changes.
Scales RP-2000, AA, and BB Giving Way to MP-2014 and RP-2014. Life expectancy has been steadily increasing in the US over the last century, so much so that mortality tables based on past experience can be expected to overstate future mortality rates and thus understate future longevity. As this has been the case for some time, the SOA has taken to publish mortality improvement tables, tables that prompt actuaries to determine how much they should reduce projected mortality rates below what is indicated by existing mortality tables proper. Presently, the SOA members utilize RP-2000 mortality tables, enhanced with mortality improvement rates known as Scale AA.
In 2012, the SOA announced the intention to shift to a Scale BB that featured even faster improvements in mortality than did Scale AA1. In announcements early this year, it further upgraded Scale BB to an enhanced improvement scale called MP-2014, and it also introduced new, base mortality tables RP-20142. When both these tools are fully implemented by actuaries, assumed mortality rates will be much lower than previously, resulting in substantial increases in DB liability valuations and similar declines in funded status.
That’s not all. As it happens, most of the coming decline in mortality rates will be for very old beneficiaries. That is, while projected mortality rates for young workers will be only slightly different, those for older workers and for retired “annuitants” will be more significantly higher. And even more importantly, mortality rates will be assumed to decline even more rapidly in the future, so that life expectancy for a person who will be, say, 85 in 2025, will increase even more than that for someone who is 85 today.
Time Profile of Typical DB Plan Liabilities & Stylized Description of Changes from New Mortality Tables
A Defined-Benefit (DB) pension plan’s obligations to its beneficiaries are estimated by applying assumed mortality rates to the plan’s census of beneficiaries, both active and retired. As one would guess, the longer beneficiaries can be expected to survive and collect benefits, the larger will be the liabilities of the plan, and, so, the lower the funded status. The American Society of Actuaries (SOA) has announced that it will introduce new mortality projections this year and that these projections will result in longer projected life expectancies for most cohorts. We analyze here the effects of those changes and discuss strategies plan sponsors might take to cope with the coming changes.
Scales RP-2000, AA, and BB Giving Way to MP-2014 and RP-2014. Life expectancy has been steadily increasing in the US over the last century, so much so that mortality tables based on past experience can be expected to overstate future mortality rates and thus understate future longevity. As this has been the case for some time, the SOA has taken to publish mortality improvement tables, tables that prompt actuaries to determine how much they should reduce projected mortality rates below what is indicated by existing mortality tables proper. Presently, the SOA members utilize RP-2000 mortality tables, enhanced with mortality improvement rates known as Scale AA.
In 2012, the SOA announced the intention to shift to a Scale BB that featured even faster improvements in mortality than did Scale AA1. In announcements early this year, it further upgraded Scale BB to an enhanced improvement scale called MP-2014, and it also introduced new, base mortality tables RP-20142. When both these tools are fully implemented by actuaries, assumed mortality rates will be much lower than previously, resulting in substantial increases in DB liability valuations and similar declines in funded status.
That’s not all. As it happens, most of the coming decline in mortality rates will be for very old beneficiaries. That is, while projected mortality rates for young workers will be only slightly different, those for older workers and for retired “annuitants” will be more significantly higher. And even more importantly, mortality rates will be assumed to decline even more rapidly in the future, so that life expectancy for a person who will be, say, 85 in 2025, will increase even more than that for someone who is 85 today.
Possible Responses to and Consequences of Effects of New Mortality Tables
A Defined-Benefit (DB) pension plan’s obligations to its beneficiaries are estimated by applying assumed mortality rates to the plan’s census of beneficiaries, both active and retired. As one would guess, the longer beneficiaries can be expected to survive and collect benefits, the larger will be the liabilities of the plan, and, so, the lower the funded status. The American Society of Actuaries (SOA) has announced that it will introduce new mortality projections this year and that these projections will result in longer projected life expectancies for most cohorts. We analyze here the effects of those changes and discuss strategies plan sponsors might take to cope with the coming changes.
Scales RP-2000, AA, and BB Giving Way to MP-2014 and RP-2014. Life expectancy has been steadily increasing in the US over the last century, so much so that mortality tables based on past experience can be expected to overstate future mortality rates and thus understate future longevity. As this has been the case for some time, the SOA has taken to publish mortality improvement tables, tables that prompt actuaries to determine how much they should reduce projected mortality rates below what is indicated by existing mortality tables proper. Presently, the SOA members utilize RP-2000 mortality tables, enhanced with mortality improvement rates known as Scale AA.
In 2012, the SOA announced the intention to shift to a Scale BB that featured even faster improvements in mortality than did Scale AA1. In announcements early this year, it further upgraded Scale BB to an enhanced improvement scale called MP-2014, and it also introduced new, base mortality tables RP-20142. When both these tools are fully implemented by actuaries, assumed mortality rates will be much lower than previously, resulting in substantial increases in DB liability valuations and similar declines in funded status.
That’s not all. As it happens, most of the coming decline in mortality rates will be for very old beneficiaries. That is, while projected mortality rates for young workers will be only slightly different, those for older workers and for retired “annuitants” will be more significantly higher. And even more importantly, mortality rates will be assumed to decline even more rapidly in the future, so that life expectancy for a person who will be, say, 85 in 2025, will increase even more than that for someone who is 85 today.
Endnotes
- See Society of Actuaries (2012) “Mortality Improvement Scale BB Report,” and Society of Actuaries (2013) “Questions and Answers Regarding Mortality Improvement Scale BB.”
- Society of Actuaries (2014-1) “Exposure Draft RP-2014 Mortality Tables” and Society of Actuaries (2014-2) “Exposure Draft Mortality Improvement Scale MP-2014.”
- In Society of Actuaries (2012), P. 4, the SOA estimated that the switch from scale AA to scale BB would raise liability valuations by something like 2% to 4%. The estimates cited in the text include, in addition, the effects of the switch from RP-2000 to RP-2014 and from scale AA to MP-2014.
- This is so since ERISA plans use corporate bond yields to evaluate benefit obligations. For public DB plans, the relevant discount rate is the expected rate of return on assets. As this rate need not be directly related to interest rate levels, public plans will not face increased liability duration per se, but their liabilities will be more sensitive to changes in return assumptions.
- Under the current combination of FAS 87 and FAS 158, changes in actuarial assumptions such as those due to RP-2014 and MP-2014 have full, immediate impact on the plan sponsor’s balance sheet. However, the impact on the income statement is amortized over a period equal to the average life expectancy of beneficiaries. Since scales RP-2014 and MP-2014 will increase average life expectancies, they will actually lengthen the period over which the costs of their effects can be amortized.
- For a more detailed account of these points, see “Don’t Sweat the Small Stuff,” a March 2014.
- This issue is analyzed in detail in “Effective LDI: Keeping Up With Your Liabilities,” October 2013.