

Executive Summary
- Defined benefit (DB) pension liabilities will inevitably experience higher average returns than matched UST or corporates.
- In order for their fixed-income assets to keep up with or surpass their liabilities, DB plans need to resort to active management: standard (tactical) active management and/or innovative (strategic) modification of their benchmarks.
- Excess returns provide the best comparison of the prospective returns on DB assets and liabilities. The 90 bps to 100 bps per year average historical excess return of standard DB liabilities is far larger than historical excess returns on long UST (zero) or long credit (near zero).
- An example of active strategies analyzed here combines long UST with high-yield bonds. Historically, this combination has provided superior average returns with little or no increase in tracking error compared with those provided by more conventional long duration indices.
- Other possible sources of substantial excess return might be EM bonds or non-agency mortgages, or any fixed-income sector that has meaningfully outperformed UST.
Introduction
A pension plan’s assets need to achieve a total return that matches or exceeds that of its liabilities. Merely achieving asset returns that fluctuate in line with liability returns—minimizing tracking error—is good, but it will not be enough if assets underperform liabilities over time. Achieving sufficient return is as crucial a component of liability-driven investing (LDI) as reducing tracking error, and it is not a simple task.
Because corporate defined benefit (DB) pension plans use corporate bond yields to discount their pension obligations, the resulting liability valuations will tend to achieve returns equal to the yields on corporate bonds. So liability returns will exceed those on matching-duration US Treasuries (UST), because of the higher yields on corporate bonds than UST. Liability returns will also exceed those on matching-duration and matching-quality corporate bonds, because realized returns on the latter will fall below the level suggested by their yields due to the effects of credit events, downgrades and defaults—afflictions not suffered by DB liabilities. In effect, pension liabilities have the yield of corporate bonds, but the credit quality of UST, making it all but impossible for passive, conventional LDI mandates to keep up with them over time.
We emphasize “passive” mandates above because active asset management offers ways to attempt to enhance total asset returns and so better match or exceed those of liabilities. Plans can seek tactical and/or strategic approaches to active management. Tactical active management is just traditional active management: temporarily varying sectors or issue selection relative to a passive benchmark. Strategic active management alters the asset mix on an ongoing basis, toward sectors not typically associated with LDI. Active management can boost returns, but it also raises tracking error, so the trick is to find active strategies and tactics that can raise returns without material increases in tracking error.
Again, a plan can engage in active strategies and/or active tactics in attempting to boost returns. An obvious example of an active strategy is the combination of long-duration and equities, but actually, another example is (passive) long credit itself. The lower average credit quality of long credit (A-) than AA discounted liabilities effectively induces some quality mismatch between assets and liabilities in order to better keep up with liability returns. Both of these strategies leave something to be desired in terms of historical performance, the former because of the high tracking error between equities and DB liabilities (even upon matching duration), the latter because the historical excess return on passive long credit has been insufficient to match those of standard liability valuations (as we’ll see below).
Applying tactical active management to long credit is one approach to addressing these issues. However, there are others, such as allocating assets to “higher-beta” fixed-income sectors that have achieved more favorable excess returns historically, sectors such as high-yield, emerging markets (EM), non-agency mortgages or others. While such allocations might appear out of place in an LDI allocation, they are clearly less so than allocations to equities. Furthermore, we’ll show here that combinations of high-yield and long UST may also provide satisfactory tracking error to liabilities, since the bulk of duration is achieved in UST, where it can be reasonably relied upon in times of financial stress (such as from 2007 through 2009), while all spread exposure is achieved in sectors that have exhibited substantial historical excess returns.
These strategies won’t be ideal for all firms. No strategy could be. We don’t recommend them for all plans. We merely present them here as alternatives. Each plan can decide for itself what works for it.
In the analysis here, we focus on historical excess returns as the best measure of comparing asset returns to liability returns, because excess returns abstract from issues of duration-matching or of historical trends in yields. We find that historical excess returns on DB liabilities have far exceeded those on standard LDI indices such as Barclays Long Credit, Barclays Long Government/Credit (Long G/C), or Barclays Long Governments. As an example of an alternative LDI strategy, we analyze a combination of high-yield and long UST, finding the combination provided higher returns while incurring tracking error against DB liabilities that was only slightly higher—and possibly lower—than standard LDI indices. Its performance looked especially favorable during the 2007–2009 crisis.
This is only one of a range of alternate strategies. We focus on it because high-yield has an historical track record that spans the range of our data on liability returns and because it has achieved substantial excess returns. The findings with respect to this example could be indicative of other active strategies as well.
Passive Long Duration Underperformed Liability Returns By 90 to 100 Basis Points Per Year
In this section, we illustrate the problems of keeping up with liability returns by comparing historical excess returns on passive long duration indices with those on DB liabilities. Such comparisons avoid the possible distortions that can arise when fixed-income indices’ durations are boosted via leverage.
That is, DB liabilities generally have longer duration than standard long-duration indices such as Long Credit or Long G/C. The duration of such indices can be raised to that of the liabilities by adding an overlay equivalent to a total return swap on long governments or long credit. However, with recent history featuring an ongoing downtrend in Treasury yields, adding duration exposure via leverage should enhance returns, even though there is no presumption that such an overlay will be profitable in the future. Similarly, with spreads widening in recent decades, an overlay of spread duration is sure to detract from returns, also with no expectation that this will be the case going forward. So, it would be difficult to know whether the results from such an analysis are viable or tainted by the features/biases of the historical sample.
Comparing excess returns abstracts from these problems. Excess returns for a bond or bond index are defined as total return less the return on duration-matched UST. Such duration-matched Treasury portfolios are constructed without resort to leverage (or overlays), so excess returns are not biased by the historical trends of yields. When we know the excess return on DB liabilities, we know how much duration-matched assets must beat UST in order to keep up with DB liabilities. By definition, the excess return on UST is zero, so the excess return on liabilities is a measure of how much they will outperform matching-duration UST. And to the extent that realized excess returns on credit are lower than those we find for DB liabilities, the differences measure how much long-duration credit indices will fall behind equal-duration liabilities.
In a previous paper, we introduced two liability return series spanning 1989 through 2012.1 One was derived by discounting a standard set of DB cash flows with corporate spot yield curves estimated using the Treasury’s methodology as per the Pension Protection Act of 2006.2 We call this series “A-AAA liabilities,” since the Treasury’s yield curve is estimated from the universe of bonds with ratings ranging from A to AAA. The second series used the same curve estimation and liability valuation methodology, but with AA bonds only, and we refer to it as “AA liabilities.”
For that paper, we also constructed portfolios of Treasury STRIPS that matched the key-rate durations (KRD) of the liability returns. These portfolios exactly match the definition of duration-matched UST relevant for calculating excess returns. Comparing our liability returns to those of the KRD-matched STRIPS implies that average excess returns over 1989–2012 were 90 basis points (bps) per year for AA liabilities and 100 bps per year for A-AAA liabilities.
So, DB assets should seek to outperform duration-matching UST by 90 bps to 100 bps per year or more, depending on their choice of discount method, if they want to keep up with or surpass their liabilities. The actual historical performance of standard long-duration indices has not been nearly so good.
Cumulative Excess Returns on Broad Credit Indices
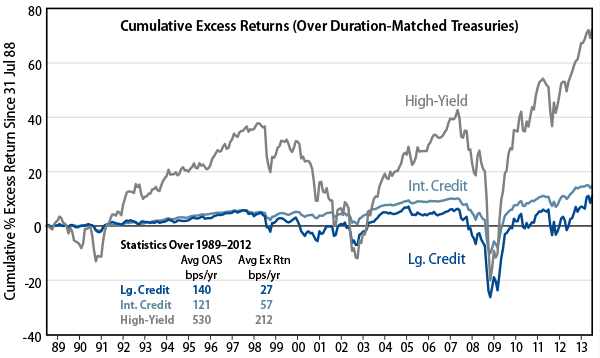
Exhibit 1 shows cumulative excess returns on long- and intermediate-duration investment-grade credit and on high-yield credit, all as published by Barclays.3 As seen there, over 1989–2012, long credit achieved an average excess return of only 27 bps per year. Note also that cumulative excess returns on long credit were zero as recently as June 2012, so average excess returns were zero as of then as well.
That 27 bps historical average compares to an average option-adjusted spread (OAS) of 140 bps per year. With no spread changes and no credit losses, long credit should have seen excess returns of about 140 bps per year. Instead, it has “harvested” only 27 bps per year, with all of the 23 years’ net cumulative excess returns occurring in the last 12 months.
Out of 113 bps per year of shortfall of realized excess returns relative to average OAS, attribution analysis suggests that about 41 bps per year were due to net spread widening, leaving 72 bps per year apparently due to credit events, downgrades and defaults. This estimate is comparable to the 62 bps to 73 bps per year of estimated shortfalls of excess returns on long credit versus those on AA and AA-AAA liabilities.4
An Alternative Strategic LDI Allocation
So, historical experience suggests that for a typical DB liability valuation, passive duration-matched UST would fall short of liability returns by 90 bps to 100 bps per year, while a passive duration-matched long credit allocation would fall short by 63 bps to 73 bps per year or more.5 A plan might attempt to make up all of this difference by aggressive active management of a long duration allocation (active tactics). Or, it might seek a combination of active strategies and active tactics, by allocating some assets to sectors that have achieved more substantial historic excess returns.
One example of such active strategies analyzed here is a combination of long UST and high-yield. Historical excess returns on credit can be seen to have been better toward the lower end of the quality spectrum, and this is especially true for high-yield, where excess returns have averaged 212 bps per year since 1989. While high-yield duration is well below that of DB liabilities, long governments generally show longer duration than most DB liability valuations, so a combination of mostly long governments and modest amounts of high-yield comes close to matching the duration of DB liabilities. Furthermore, seeking the preponderance of duration via long governments can give the portfolio a reliable source of duration during financial crises, exactly when a DB plan needs duration the most. We call these allocations “barbell” portfolios, because most of their duration is achieved in UST, while all of their spread duration is achieved in high-beta high-yield.
What is a suitable allocation to high-yield within an LDI context? Regression analyses indicate optimal allocations to high-yield of about 20% against AA liabilities and about 35% against A-AAA liabilities. Optimal in this context means that these allocations minimize the combination of tracking error and average miss (underperformance) relative to liability returns.6 With annual average excess returns on long governments and high-yield equal to zero and 212 bps, respectively, a 20% allocation to high-yield could be expected to produce 43 bps per year of asset excess return against the 90 bps average excess returns for AA liabilities. Bumping the high-yield allocation to 25% would boost asset excess returns to 53 bps per year, but with some increase in tracking error. A 35% allocation to high-yield would be expected to produce 74 bps of asset excess return against the 100 bps excess returns of A-AAA liabilities.
Tracking Errors for Treasury/High-Yield Combinations Versus Standard Long Duration, 1989–2012 Sample
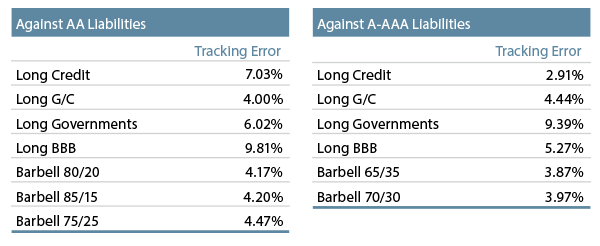
Exhibit 2 shows the tracking error results for such allocations relative to those of standard LDI indices. Notice that the barbell combinations produce tracking error to liabilities that is either lower than that for long credit (for AA liabilities) or only somewhat higher (for A-AAA liabilities). In both cases, average returns for the barbell portfolio are superior to those of long credit, reflecting the better excess return performance of high-yield. The tracking error of the barbell varies similarly relative to the Long G/C, depending on which liability set is used, but in both cases here as well, with significantly higher average returns.
Notice also in the table that reducing high-yield exposure beneath the optimal amounts stated above (and increasing Treasury exposure) raises tracking error. As volatile as exposure to high-yield might sound within an LDI context, it does indeed address liabilities’ spread risks, a fact that is also attested by the much lower tracking error of the barbell than long governments. Notice finally the much higher tracking errors for long BBB portfolios.7
Annual Tracking Errors for LDI Strategies for Long AA Discount Rate
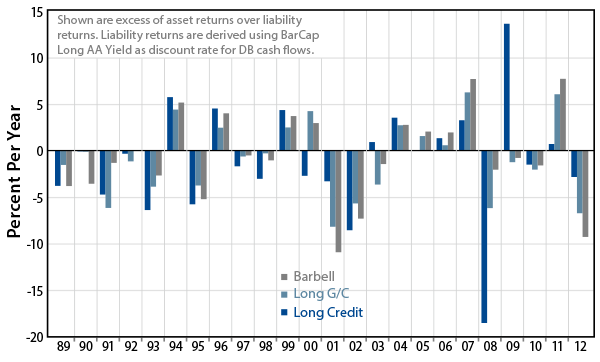
Once again, an advantage of the barbell combination is that the bulk of its duration comes from UST, whose duration can be counted on during periods of financial crisis. In contrast, over 2008 to 2009, extremely volatile spread movements made the “stated” duration of long credit assets much less reliable. This can be seen in Exhibit 3, which shows annual “misses” for Long Credit, Long G/C, and the barbell against AA liability returns. Not only does the Treasury/high-yield combination show low tracking error across the sample period, but also it performed exceptionally well during the 2008 to 2009 crisis as well as during the credit crisis and recession over 1997 to 2001.
In effect, the barbell combination offers a DB plan diversification benefits. Also, such strategies are not chasing the same pool of long corporates that other long credit managers are (with limited liquidity in recent years by the way). Meanwhile, again, the Treasury component of the allocation is extremely liquid and can be expected to perform well when systemic risk erupts.
The Barbell Is Not Quite Enough To Fully Match Liability Returns
While the barbell portfolio produced superior average returns with comparable tracking error against DB liability returns over the historical sample, the 43 bps to 74 bps per year of average excess returns it delivered under optimized allocations failed to fully match the 90 bps to 100 bps of excess returns of DB liabilities. Still, allocation to a barbell portfolio could reasonably be expected to reduce asset “underperformance” to the range of 25 bps to 50 bps, small enough to be addressed via tactical active management. So, at worst, such an active strategic allocation may provide a good first step toward better matching liability returns. Larger strategic allocations to high-yield might also be contemplated, but these would raise tracking error relative to our results.
We would also repeat that the “active strategic” example of UST and high-yield is but one possibility. Allocations to other risk sectors such as EM debt or non-agency mortgages might also be considered. We have not examined these other sectors here, because their historical track records do not track so far back as that of high-yield. However, over the historical range for which they are available, returns for these series look attractive. USD-denominated EM sovereign bonds have delivered average excess returns of 332 bps per year since 1994. Non-agency mortgages have delivered total returns in the double-digit range since the 2008 crisis and better than 7% including the crisis years (i.e., since mid-2007).
The general idea behind such allocations is to seek opportunistic returns in sectors that have a track record of substantially positive excess returns and combine this with interest rate exposure provided by long UST. High-yield, non-agency MBS, and EM debt all look attractive in this regard, and all could be reasonably expected to deliver tracking error against DB liabilities that is far lower than those of equity allocations. Also, these sectors in combination with long UST offer DB plans the potential for tactical active management that could further close the gap between returns on assets and liabilities.
Our analysis has covered the historical experience since 1989. Going forward, with corporate finances generally in very good shape presently and credit spreads relatively wide, there is reason to believe that investment-grade credit could provide compelling excess returns in the future. However, in that case, the excess returns on high-yield and other risk sectors could also be expected to exceed historical experience (as would excess returns on liabilities, should better prospective credit performance imply declining spreads). Thus, even in a better environment for credit, the case for pursuing alternative active allocations in order to keep up with liabilities will remain, and active strategies like those discussed here could still be expected to offer better opportunities than passive, standard LDI allocations.
The issues and results shown here are most relevant for DB plans that have allocated assets exclusively or almost exclusively to fixed-income. However, even for plans with substantial allocations to equities, the issues discussed here are still in play. Equities display substantial “spread” sensitivity, about as much as long credit. Combining equities, high-yield, and UST might produce more spread sensitivity in DB assets than in liabilities, but this will also be the case if long credit and equities are combined.8 So, the more relevant issue for a DB plan is whether to combine equities with any credit exposure rather than whether to focus that credit exposure in long credit or high-yield.
Conclusions
With DB liabilities featuring the yield of corporate bonds, but the creditworthiness of UST, keeping up with them over time using standard, passive long duration tools is an all but impossible task. So, the application of active management techniques is necessary, either on the strategic or tactical side, or both. The simplest way we can pose the problem is that DB plans need to achieve asset returns that exceed those on equal-duration UST by about 90 bps to 100 bps per year, and standard indices have failed to do this.
We have seen that despite foreboding optics, the example of the “barbell” combination of high-yield and long governments can go a long way toward matching DB liability returns, even while it can be expected to induce only slight or no increases in tracking error relative to standard LDI allocations. What’s more, such active strategies would seem to perform well during credit crises, given our findings over the 2008–2009 and 1997–2001 episodes. This is but one example of an alternative LDI strategy, and similar opportunities could be expected from allocations combining long UST with non-agency mortgages, EM debt, or a combination of these and other high-beta spread sector assets.
Such strategies are worth at least a look from plans seeking to sustain or modestly improve funded status via LDI operations. Such strategic allocations are also amenable to attempts to further boost asset performance via active management tactics, more so than would be the case were a DB plan to seek “opportunistic” returns in equities or elsewhere outside the fixed-income space.
References
Bazdarich, Michael (2013) "LDI And The Persistence of Tracking Error"
Girola, James A., (2007) "The Corporate Bond Yield Curve For The Pension Protection Act," U.S. Department of the Treasury, October 11, 2007
Dynkin, Lev, Jay Hyman, and Vadim Konstantinovsky (2001), “Quantitative Portfolio Strategy: Annualizing Excess Returns,” Lehman Brothers, November 5, 2001.
Endnotes
- See Bazdarich (2013).
- See Girola (2007).
- Cumulative excess returns in the chart are calculated as per the definitions specified in Dynkin et al (2001).
- This shortfall would exactly equal the effects of credit events were spread sensitivities—average quality and spread duration—the same for long credit as for the liability valuations. Again, however, long credit involves some quality mismatch relative to DB liabilities. So the estimated shortfall of excess returns on long credit versus those on liabilities reflects both credit event effects on long credit and varying spread sensitivities due to that quality mismatch and differing spread durations.
- The shortfall could be higher given that all of long credit’s historical excess return has occurred in the last year—and so is suspect—and given also that in order to match duration and spread duration, cash investments would have to be concentrated in the longest maturities of long credit, where excess return performance is likely even more subdued, given the apparent inverse relation between maturity and excess return.
- The regression coefficients in this analysis become optimal portfolio weights once we constrain them to sum to one via a Wald restriction. Also, to mimic the spirit of asset returns, the constant term is suppressed in our regressions. As a result, residuals for the regression will not sum to zero. Rather, each residual will equal the total miss between asset and liability returns. It is then clear that because the regression process minimizes the sum of squared residuals, it also identifies that fixed-weight portfolio that minimizes the sum of (squared) tracking error and (squared) average misses. It is equivalent to say that the regression process identifies the portfolio that minimizes root mean squared error.
- The results reported just above showed raw, as-reported indices against DB liability return measures, without adjusting for duration differences. We had already reported average returns on a duration-matched basis in the preceding section, when we analyzed excess returns, and our intent here is to show that an alternative LDI allocation, with better historical excess return performance, could also provide tracking errors comparable to those of standard long-duration indices. For the record, though, we’ll briefly report duration-matched results.
Exhibit 4 (below) shows tracking error against DB liabilities for long credit under two different duration-matching schemes: increasing duration via a leveraged allocation to long credit or via a leveraged allocation to long governments (both equivalent to total return swaps). The former matches both duration and spread duration (though quality mismatch remains). The latter matches duration only. Neither results in much difference in tracking error compared with those seen for “straight” long credit in Exhibit 2. Similarly, duration-matching imparts little change in tracking error for the long BBB or barbell allocations. With a downtrend in yields in place over the historical sample, these leveraged (overlay) allocations do raise historical average returns of the allocations, but in a way that cannot be counted on going forward. And, again, even with this leveraged duration-match, tracking error results are little different from what we have already seen with unmatched allocations.

- The combination of long credit and large-cap equities produces a bit more spread sensitivity than long credit by itself, and long credit has more spread sensitivity than DB liabilities, because of the lower average credit quality of long credit than DB liabilities.