Macros, Markets and Munis
Munis posted positive returns but underperformed Treasuries last week. Fixed-income markets were focused on Federal Reserve (Fed) Chair Jerome Powell’s speech at this year’s Jackson Hole Symposium amid a quiet week of economic data. Jobless claims moved higher while housing sales came in above expectations. At Jackson Hole, Powell indicated that the “shifting balance of risks may warrant adjusting our policy stance.” Treasuries rallied across the curve during the week. Municipals underperformed Treasuries as the yield curve steepened, with high-grade yields generally moving lower in short maturities and slightly higher in the long end. Meanwhile, municipal demand improved and supply declined while remaining elevated. This week we touch on significant performance differences across the municipal market, underscoring the potential value of active management.
Muni Funds Post Outflows as Supply Remained Elevated
Fund Flows ($2 billion of net inflows): During the week ending August 20, weekly reporting municipal mutual funds recorded $2.3 billion of net inflows, according to Lipper. Long-term, intermediate and short-term categories recorded $2.0 billion, $154 million and $130 million of inflows, respectively. Last week’s inflows led year-to-date (YTD) inflows higher to $23 billion.
Supply (YTD supply of $379 billion; up 23% YoY): The muni market recorded $9 billion of new-issue supply last week, marking the first week of less than $10 billion issuance since the July 4 holiday. The YTD new-issue supply of $379 billion is 23% higher than the prior year, with tax-exempt issuance up 25% year-over-year (YoY) and taxable issuance up 1%, respectively. This week’s calendar is expected to remain elevated at $12 billion. The largest deals include $1.8 billion State of Illinois General Obligation Bond and $1.4 billion Massachusetts School Building Authority transactions.
This Week in Munis: Valuation Swings Underscore Active Opportunities
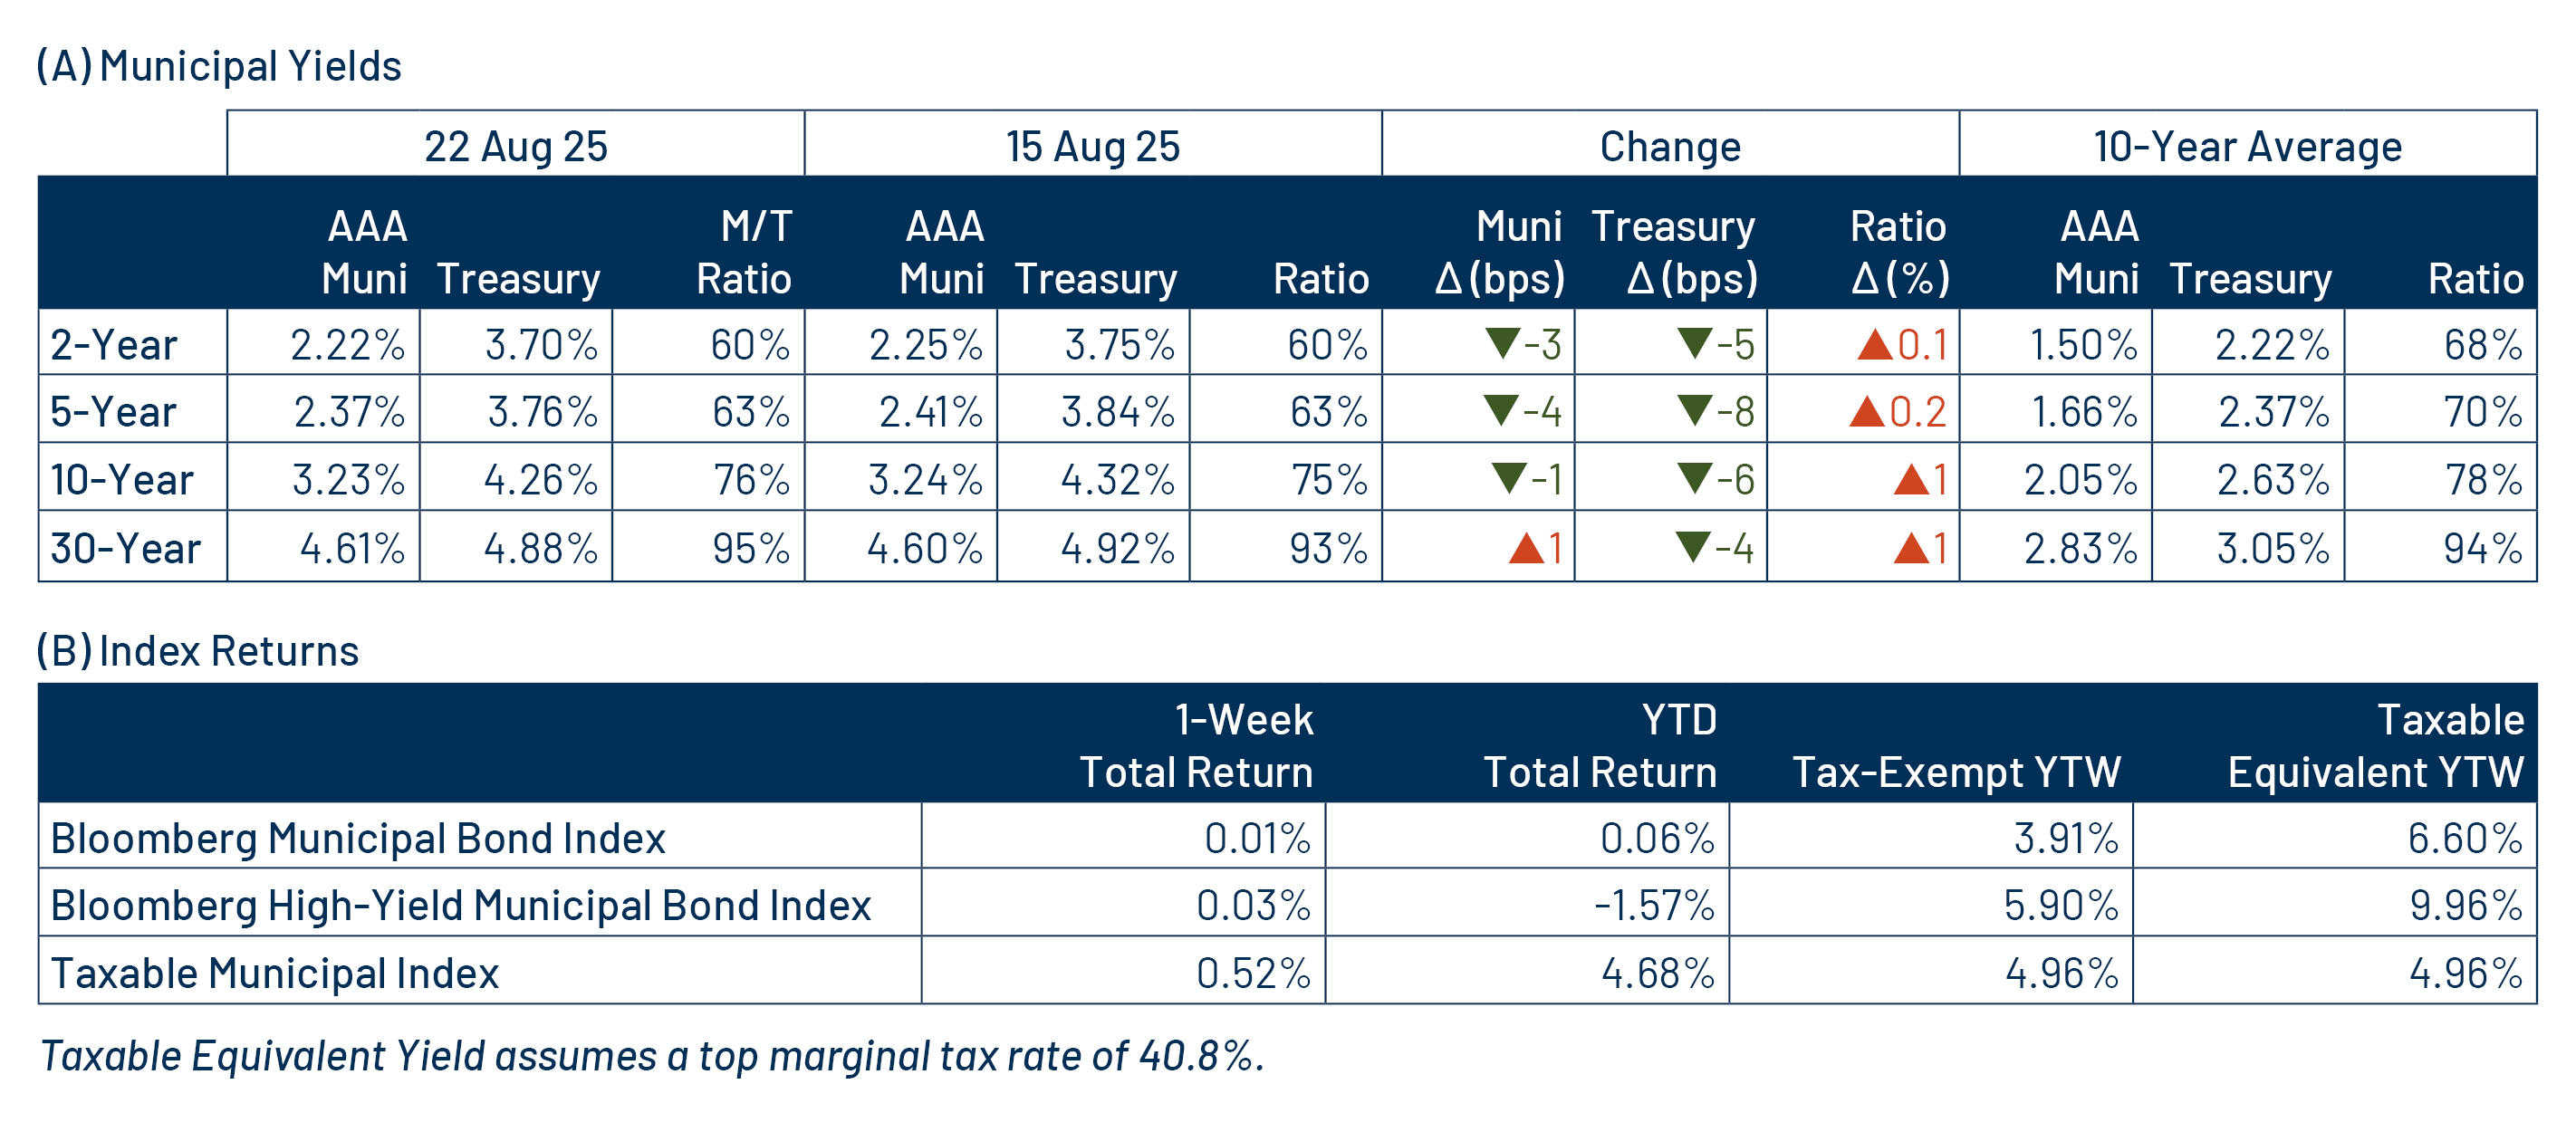
The municipal market’s 0.1% YTD total return appears relatively unremarkable, but peeling back the layers of the fragmented muni market provides a more dynamic story that underscores the value of active management this year.
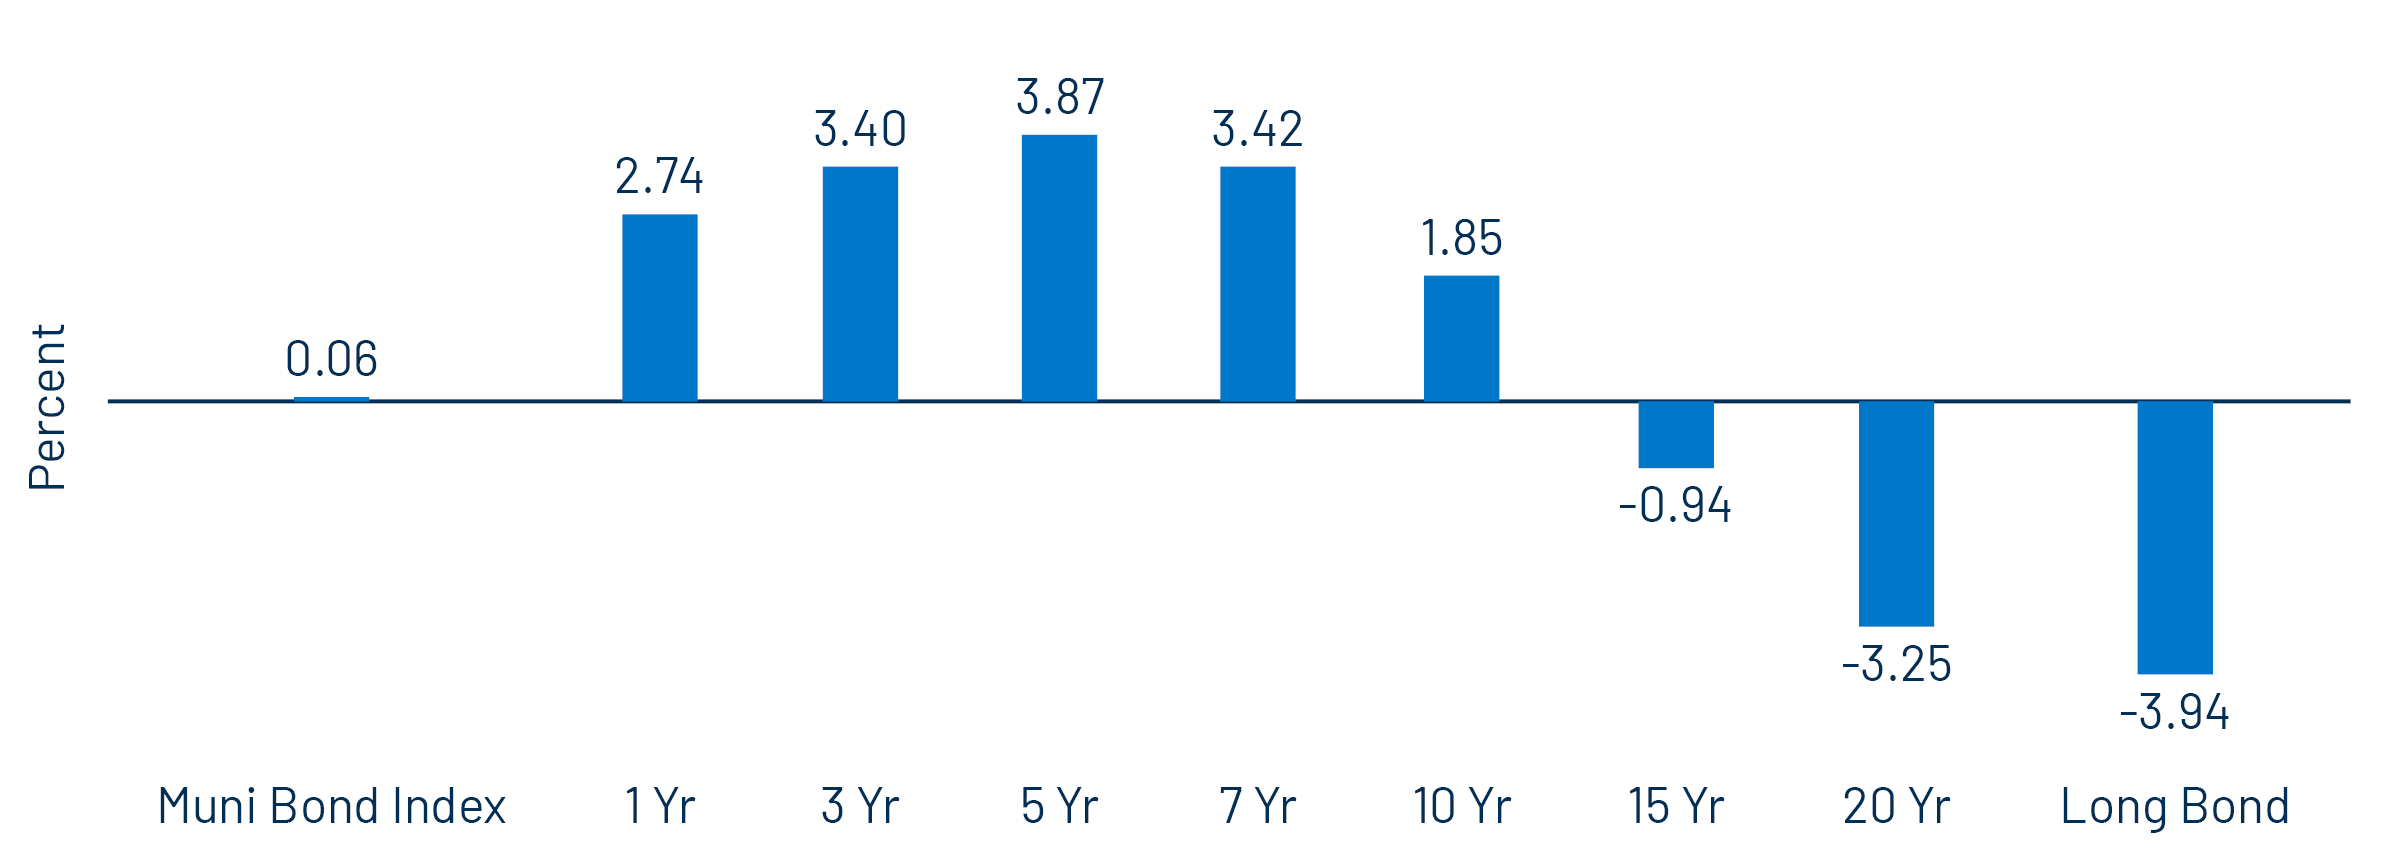
As highlighted in our recent post on yield-curve steepening, the front end of the municipal bond yield curve has significantly outperformed longer maturities. The Bloomberg 5-Year Municipal Bond Index (4- to 6-year maturities) led with a 3.87% return YTD through August 22, while the Bloomberg 22+ Year Municipal Bond Index returned -3.94%, a nearly 8% performance gap driven by curve exposure. Sector performance also varied, with the industrial revenue sector gaining 2.58% YTD, outpacing the health care sector, which returned -1.48% amid federal funding concerns, resulting in a 4.06% return differential.
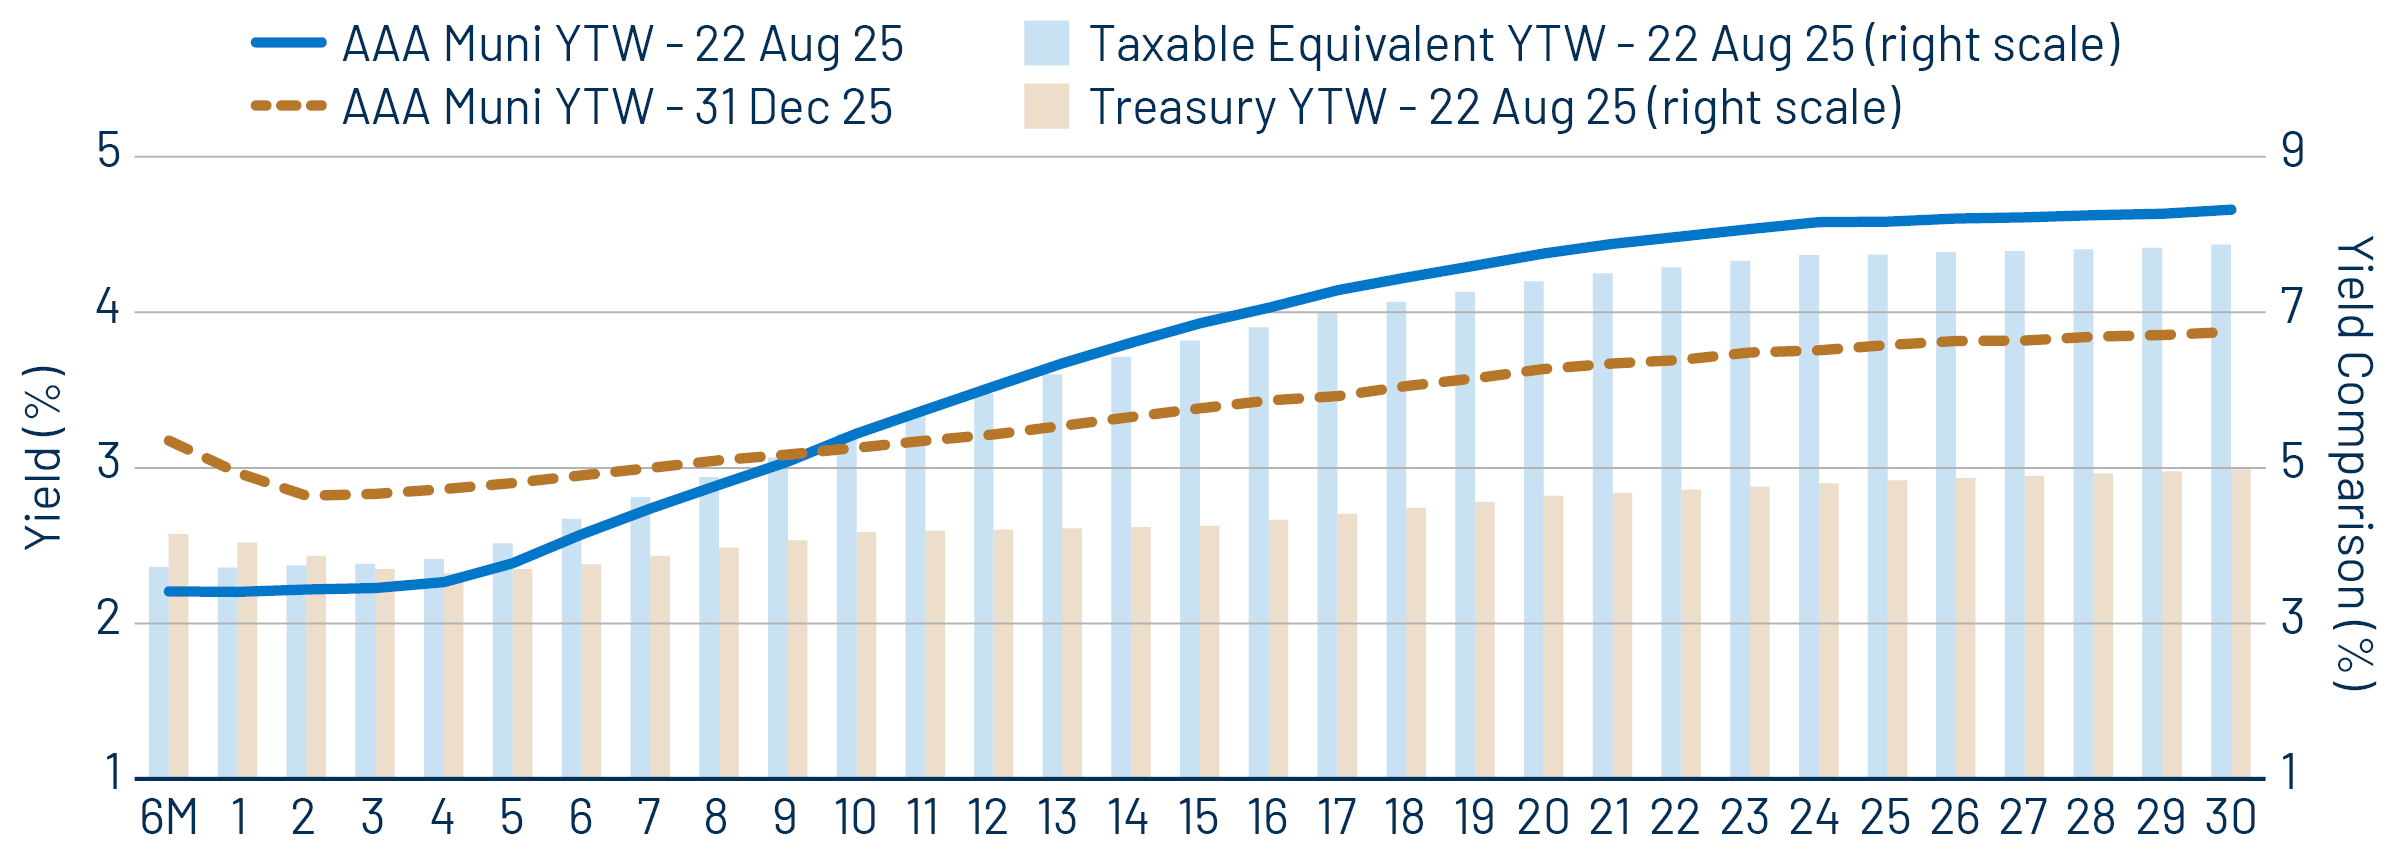
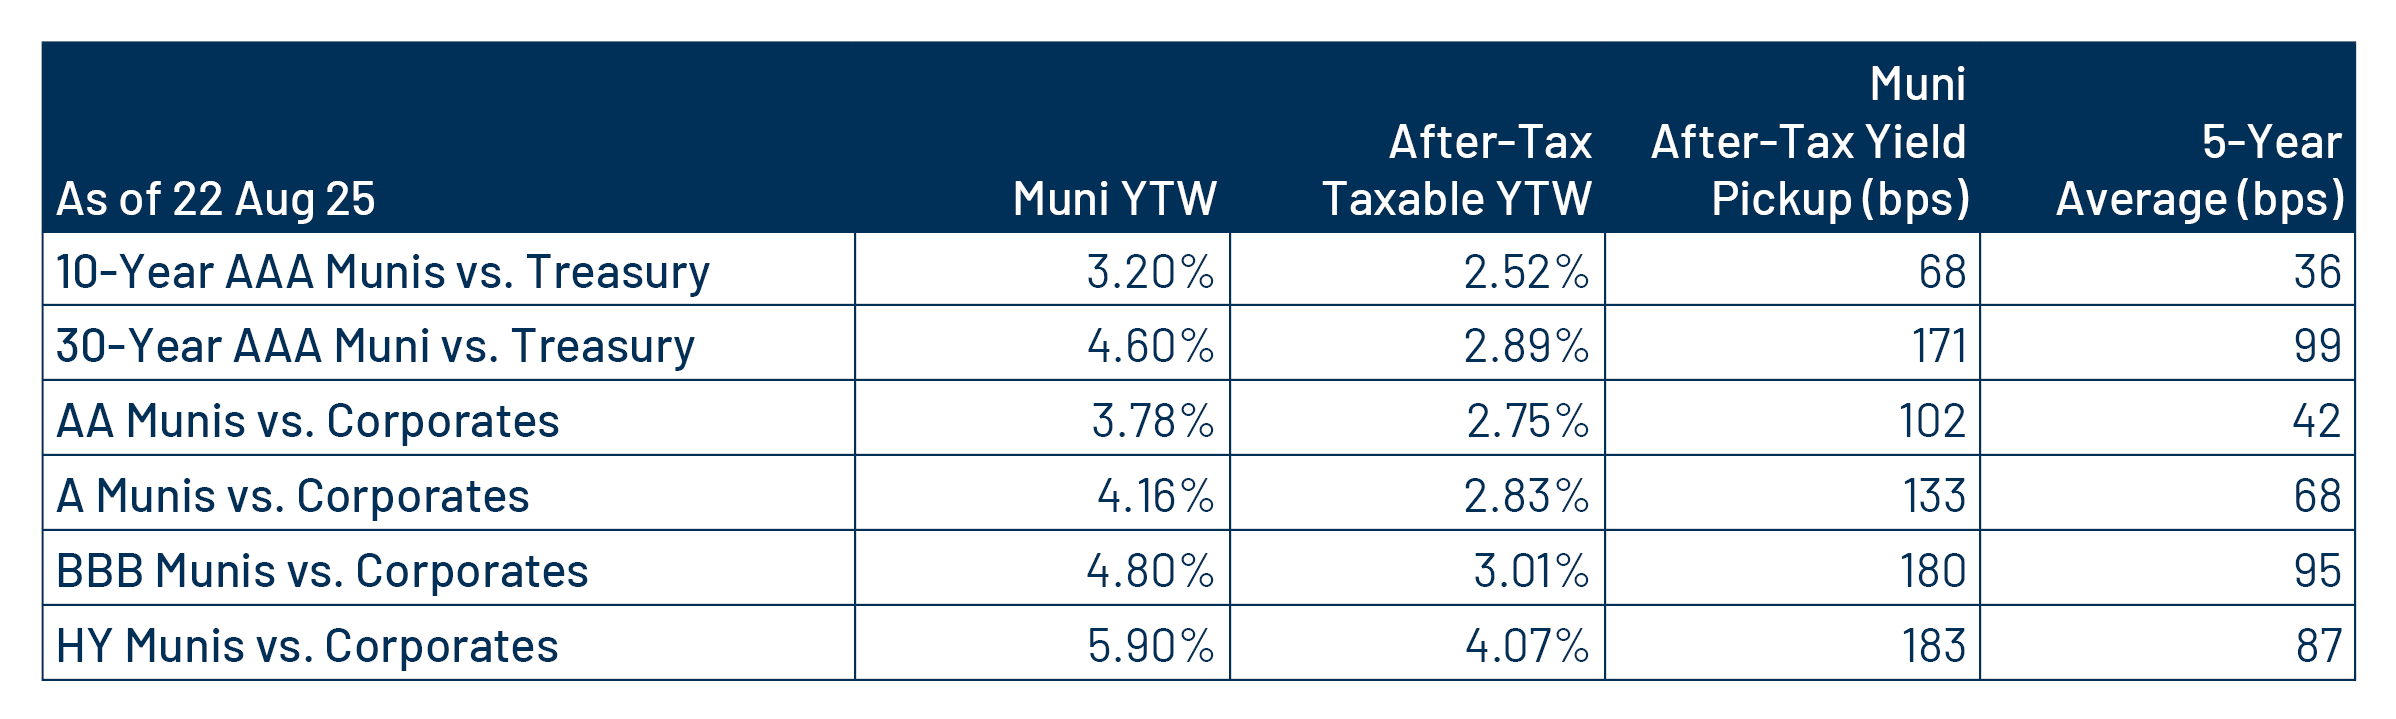
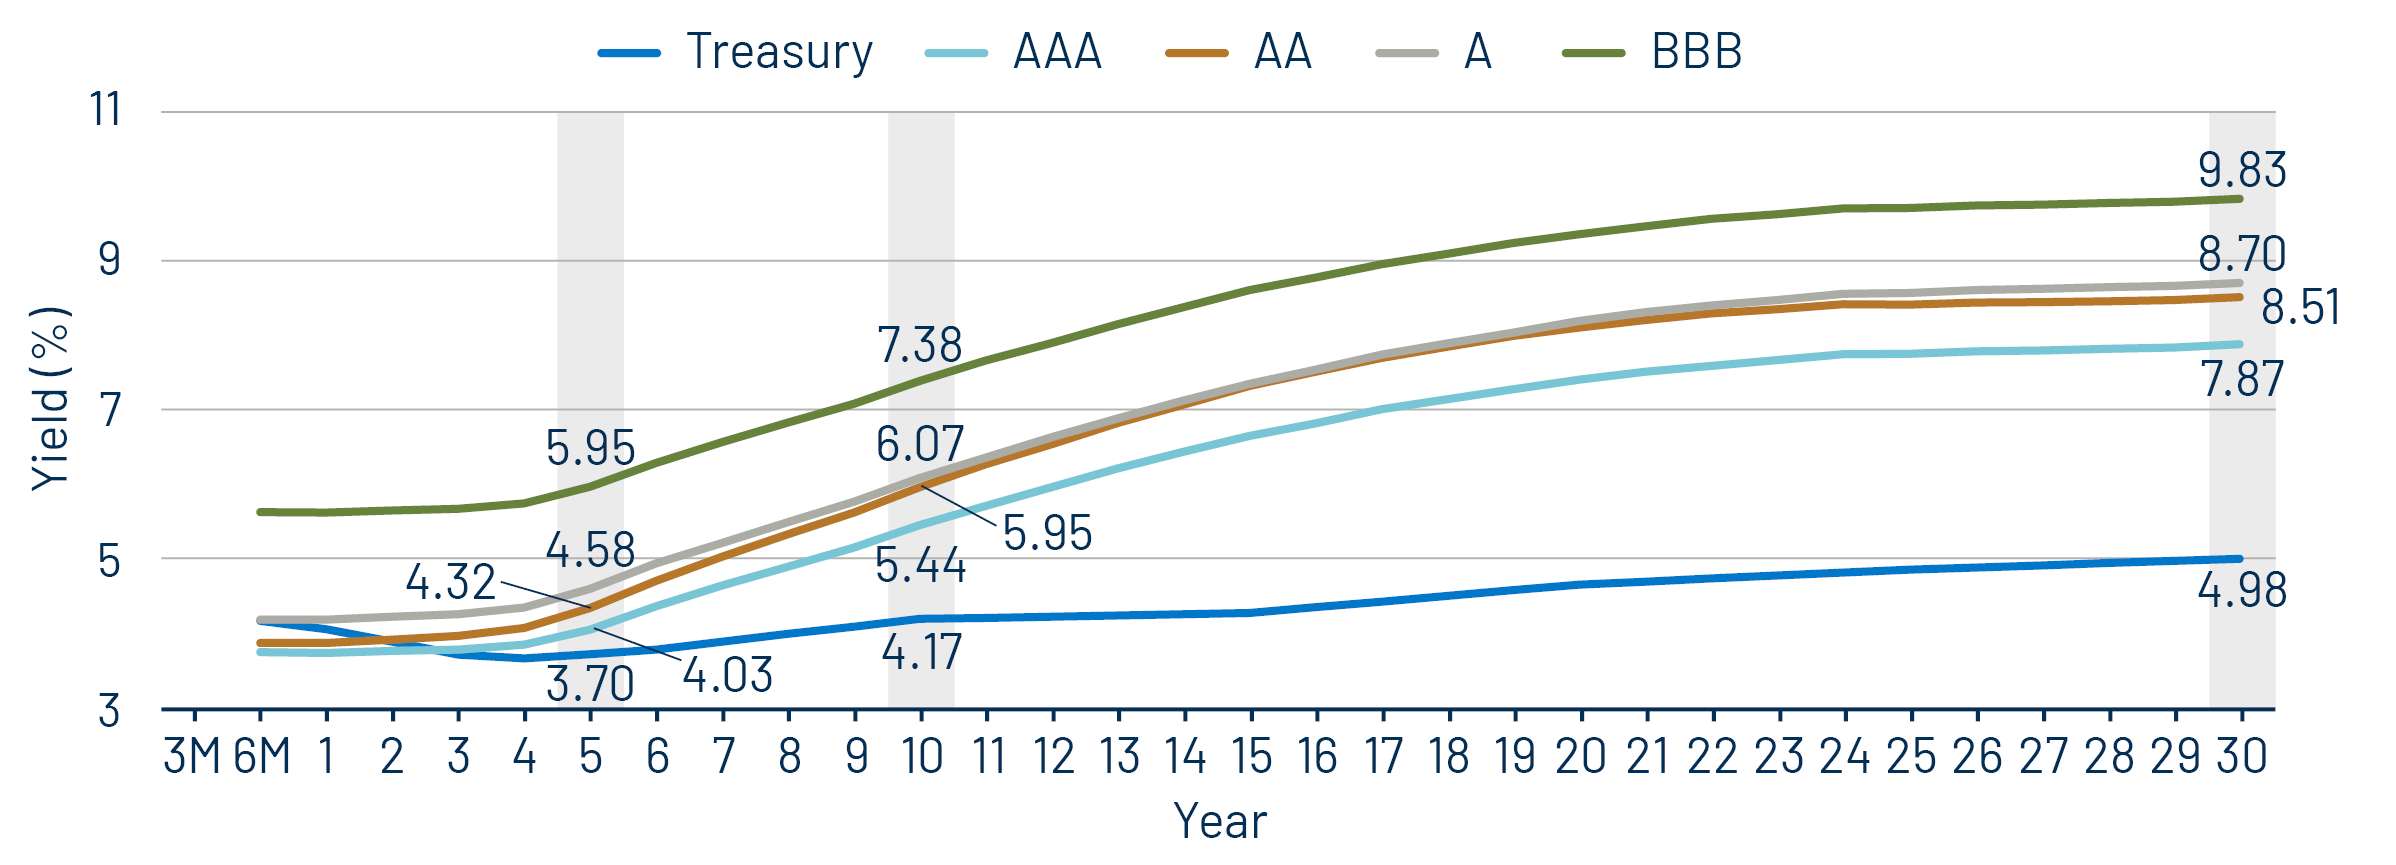
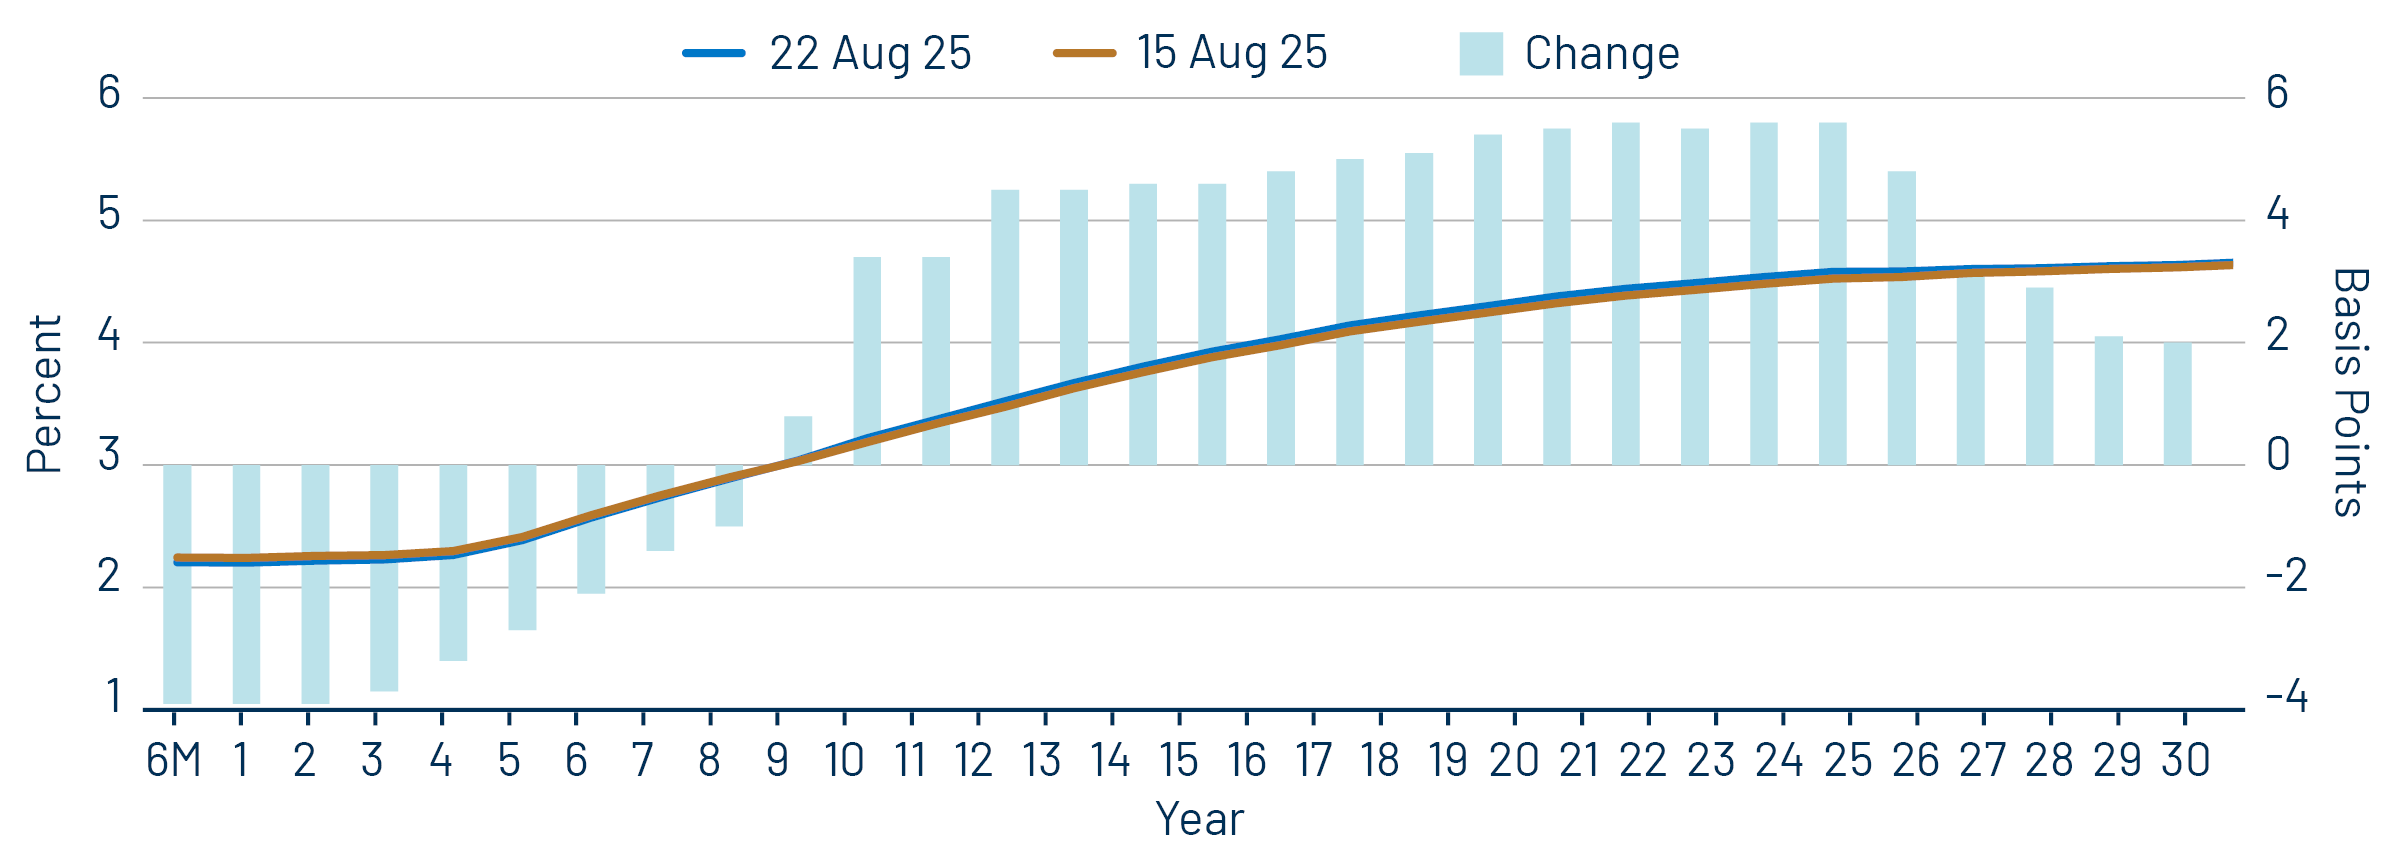
The municipal market’s significant performance disparities over the past year underscore the value of active management and highlight evolving valuation opportunities. Strong performance at the front end of the yield curve has driven down the 1-year AAA municipal rate by 77 basis points (bps) YTD to 2.22%, equivalent to a taxable-equivalent yield of 3.75% for individuals in the top marginal tax bracket, less attractive than the 1-year Treasury yield of 4.04%. Conversely, the 30-year AAA tax-exempt municipal yield has risen 79 bps to 4.66%, equivalent to 7.87% on a taxable basis, surpassing the 30-year Treasury yield of 4.98% by 289 bps. As valuations diverge across fixed-income markets, Western Asset offers a comprehensive suite of solutions to navigate these trends in both municipal and taxable fixed-income markets that can provide for more favorable after-tax outcomes.
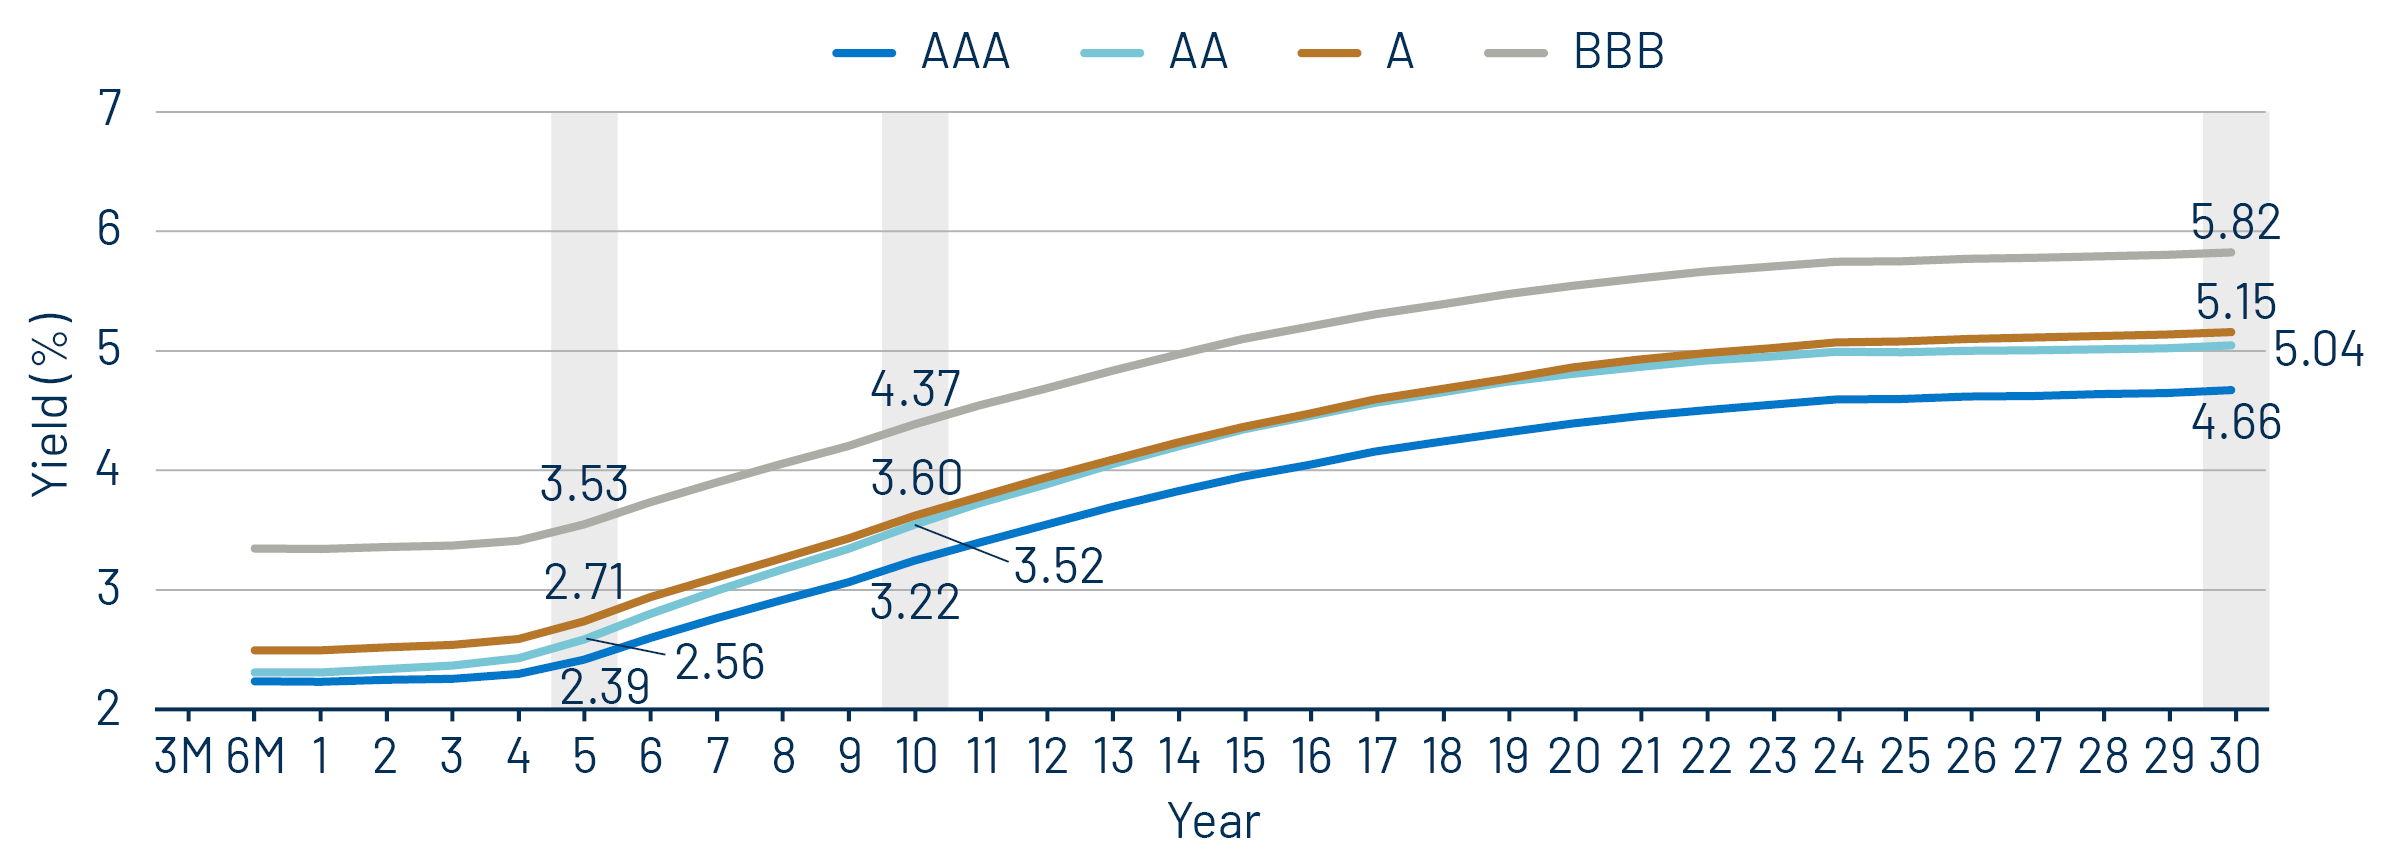
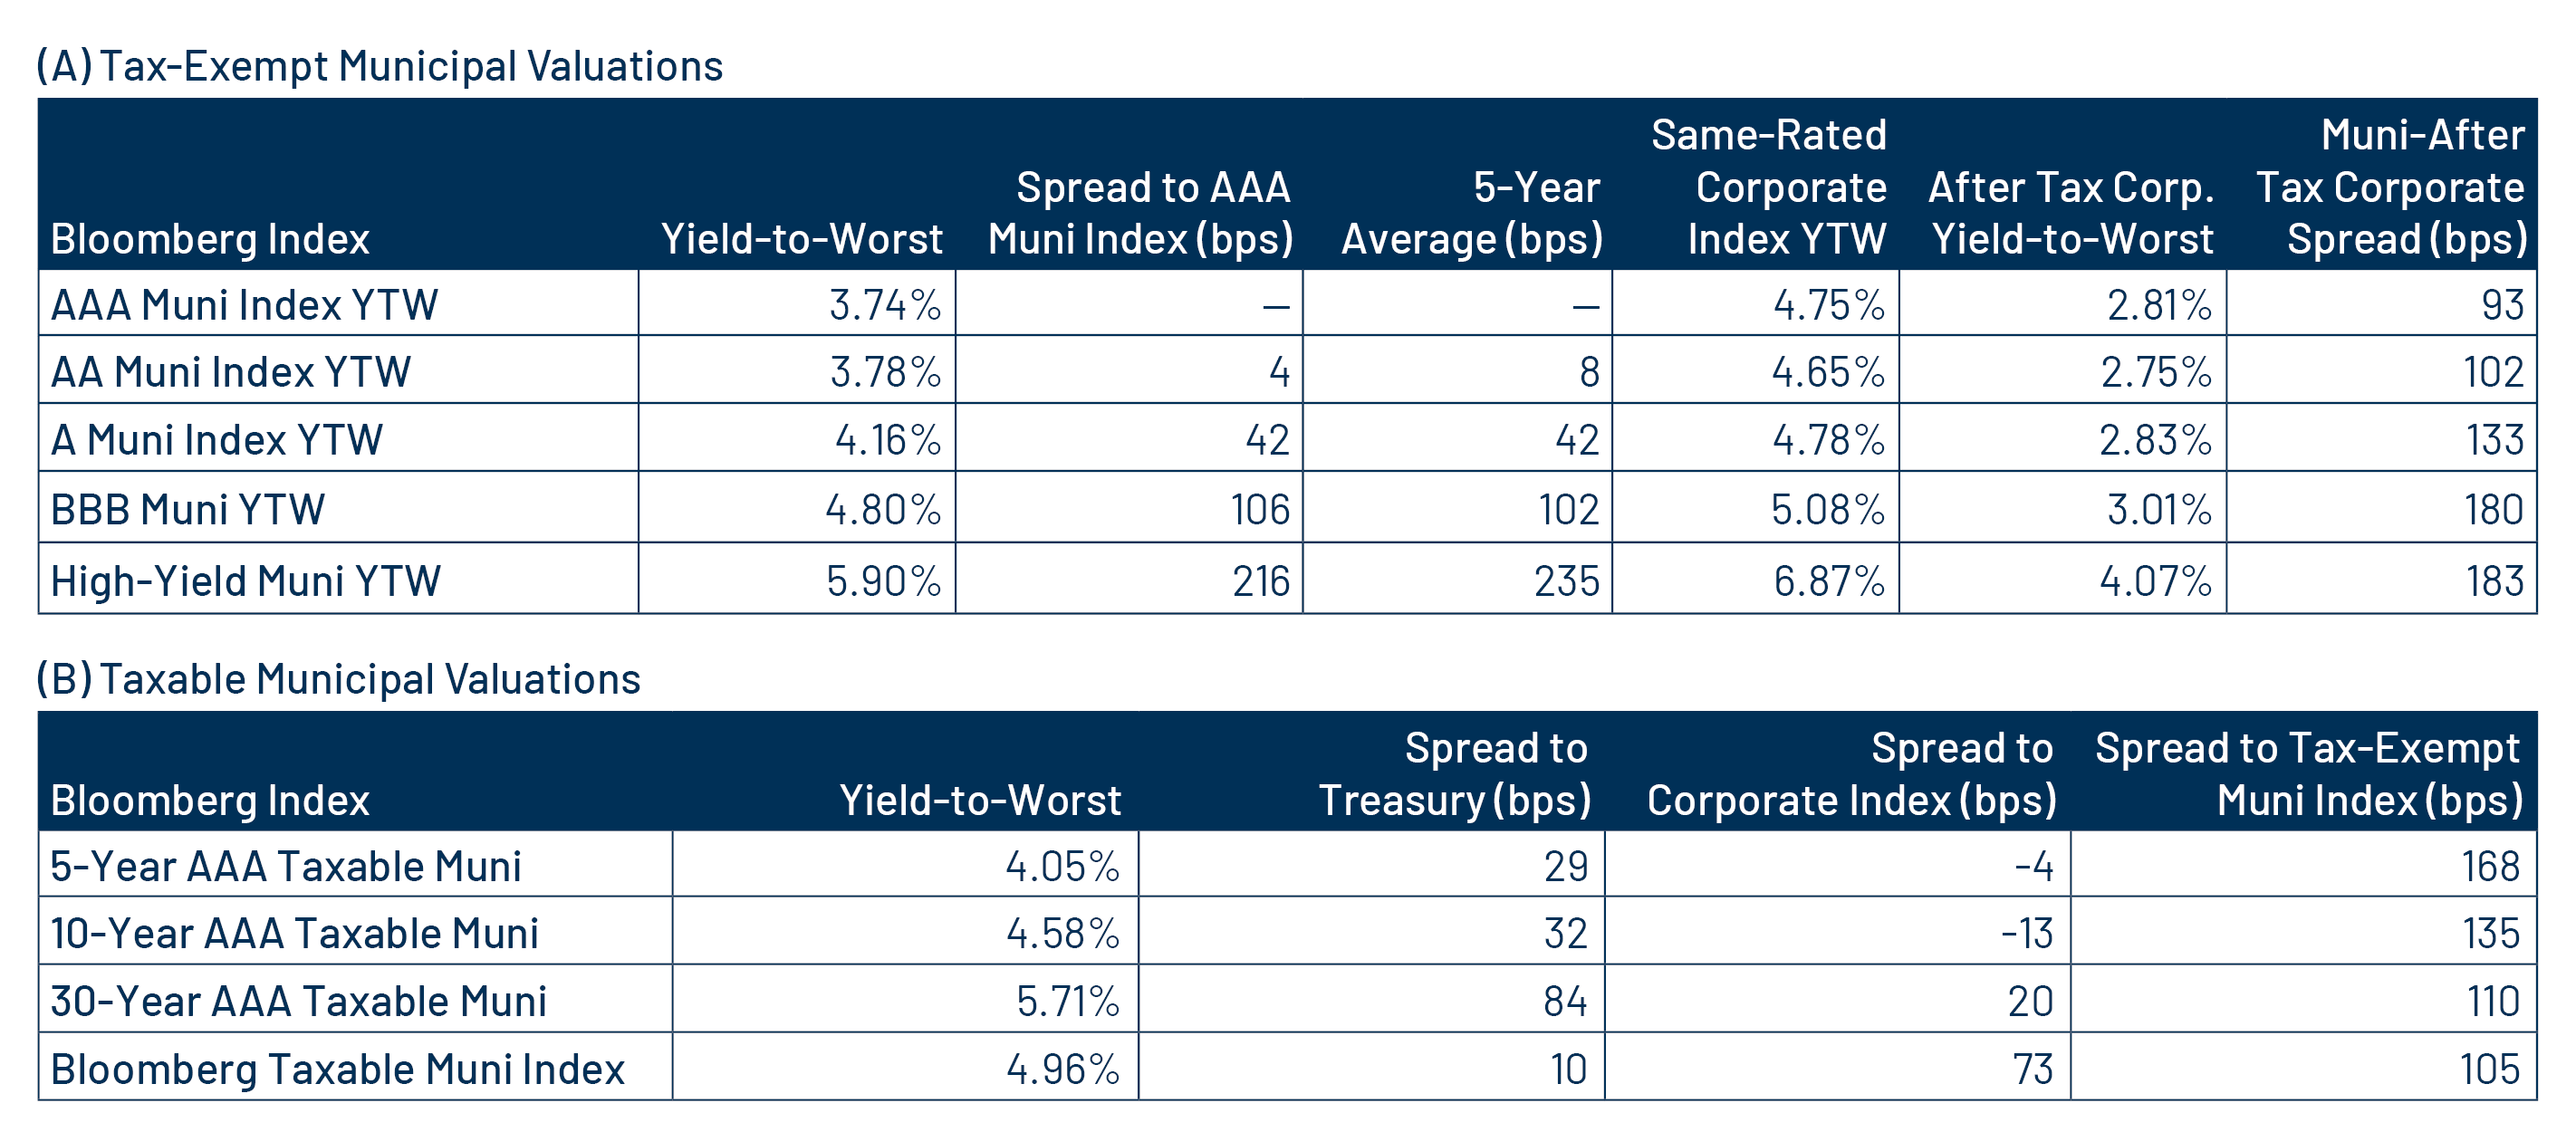
Municipal Credit Curves and Relative Value
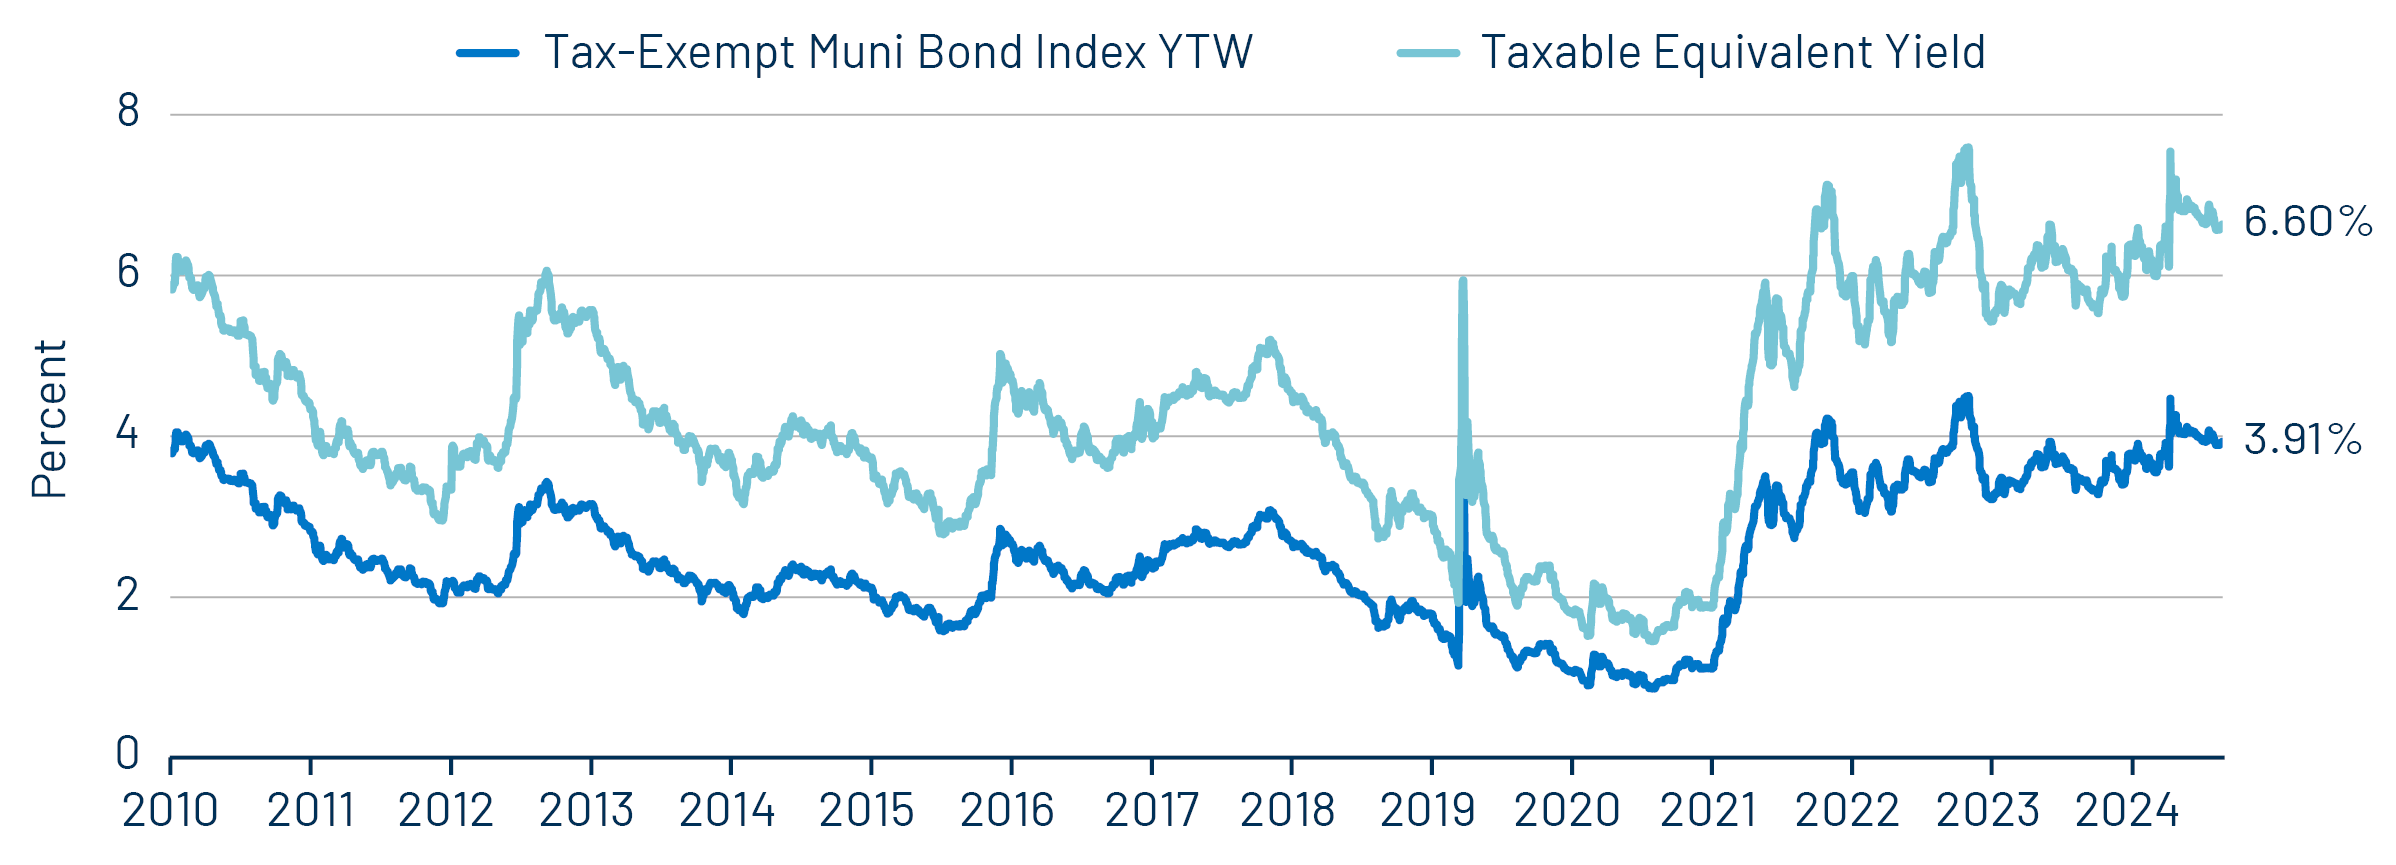
Theme #1: Municipal taxable-equivalent yields and income opportunities remain near decade-high levels.
Theme #2: The AAA muni curve has steepened, offering better value in intermediate and longer maturities.
Theme #3: Munis offer attractive after-tax yield compared to taxable alternatives.