skip navigation
Blog

Stay up to date on timely topics and market events. Subscribe to our Blog now.

MARKETS
August 05, 2025

Weekly Municipal Monitor—Yield Curve Steepening

By Sam Weitzman

Stay up to date on timely topics and market events. Subscribe to our Blog now.

Macros, Markets and Munis

Municipals posted positive returns last week but generally underperformed Treasuries, which moved lower across the curve following the jobs data release. High-grade municipal yields trailed Treasuries lower but generally underperformed amid elevated supply conditions. Fixed-income markets navigated a packed economic calendar, as GDP and core Personal Consumption Expenditures (PCE) data came in stronger than expected last Wednesday ahead of the Federal Open Market Committee’s decision not to cut interest rates. Market sentiment shifted Friday as the nonfarm payrolls report indicated July’s payrolls fell below expectations, and notably included a sharp 258,000 downward revision for the prior three months. Meanwhile, muni technicals strengthened as funds recorded inflows. This week we touch on the significant muni curve steepening that took place this year.

Technicals Improve as Fund Flows Accelerate

Fund Flows (up $973 million): During the week ending July 30, weekly reporting municipal mutual funds recorded $937 million of net inflows, according to Lipper. Intermediate funds recorded $573, short and short/intermediate funds recorded $212 million, long-term funds recorded $202 million and high-yield funds recorded $44 million of net inflows. Last week’s inflows led year-to-date (YTD) inflows higher to $16 billion.

Supply (YTD supply of $341 billion; up 25% YoY): The muni market recorded $14 billion of new-issue supply last week, down 6% from the prior week. YTD new-issue supply of $341 billion is 25% higher than the prior year, with tax-exempt issuance up 26% year-over-year (YoY) and taxable issuance up 6%, respectively. This week’s calendar is expected to remain elevated at $17 billion. The largest deals include $985 million Brightline Trains (FL) and $1.8 billion New York City General Obligation transactions.

This Week in Munis: Yield Curve Steepening

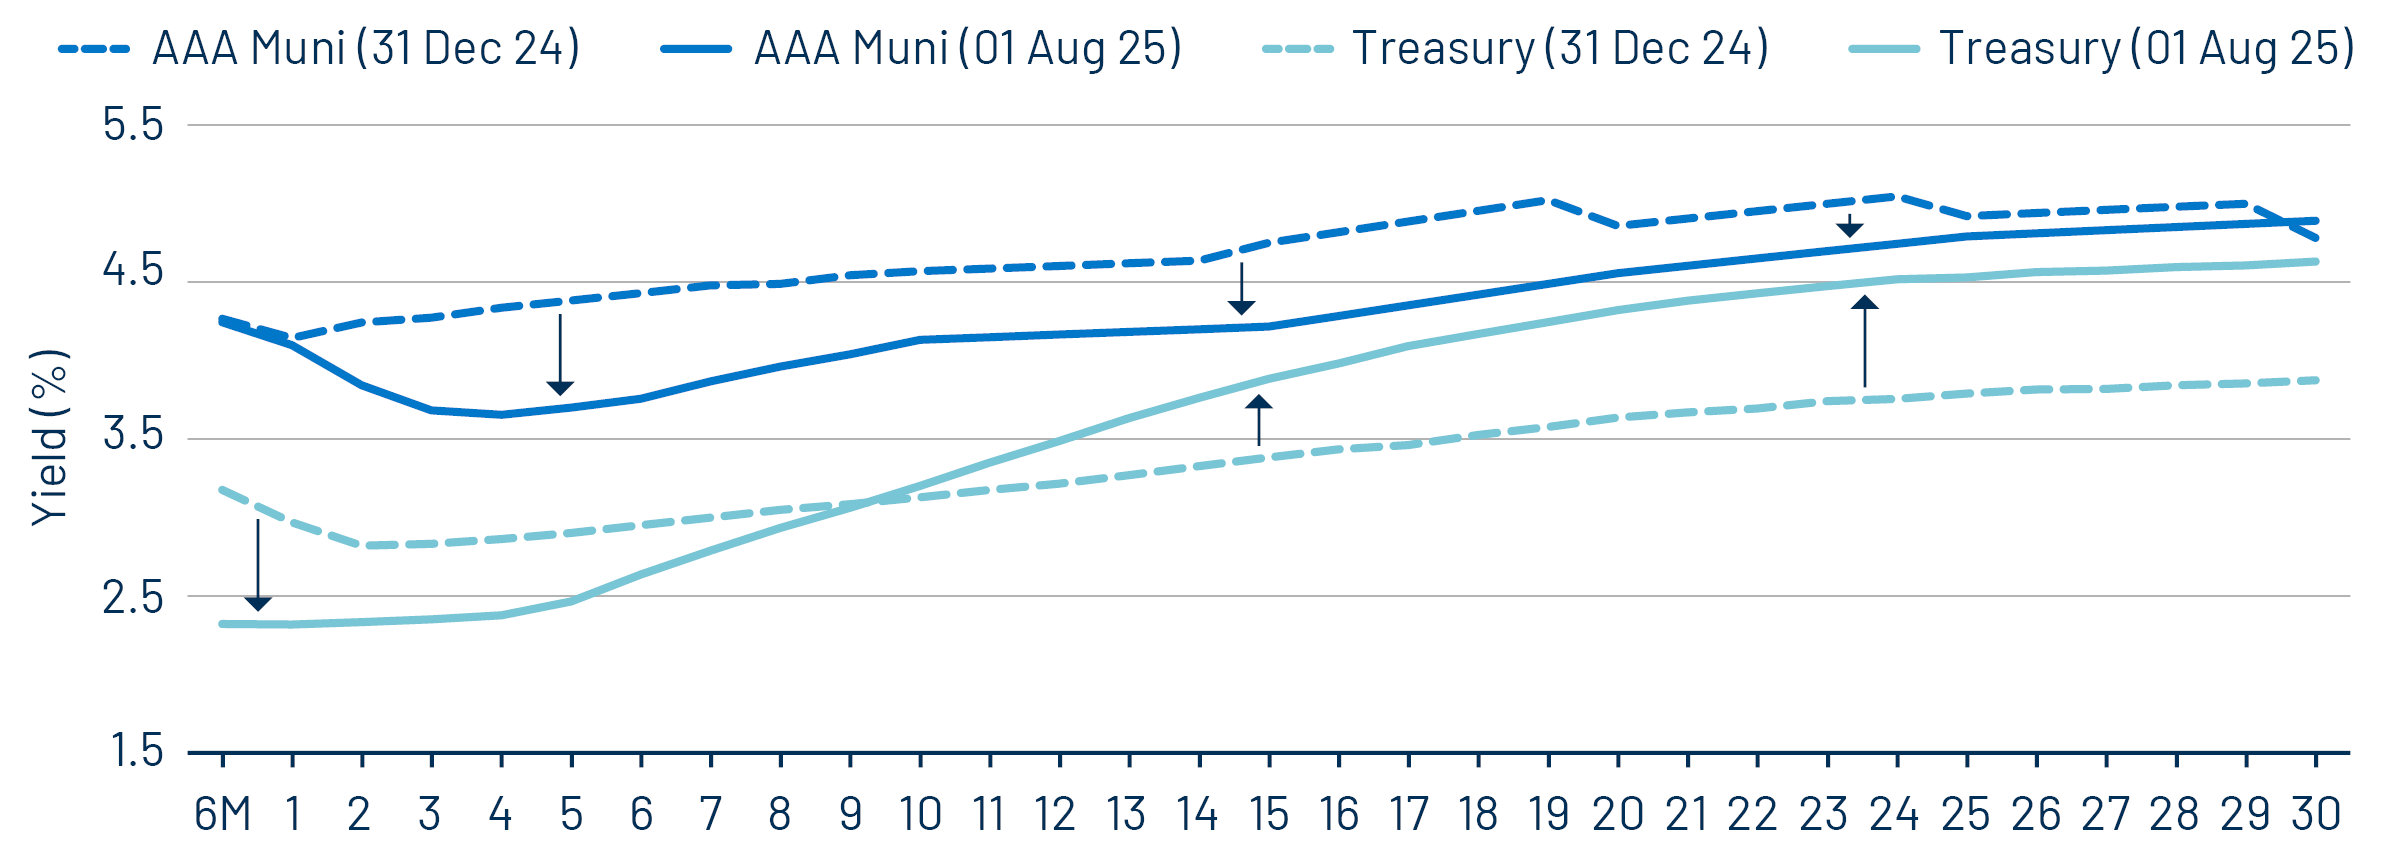
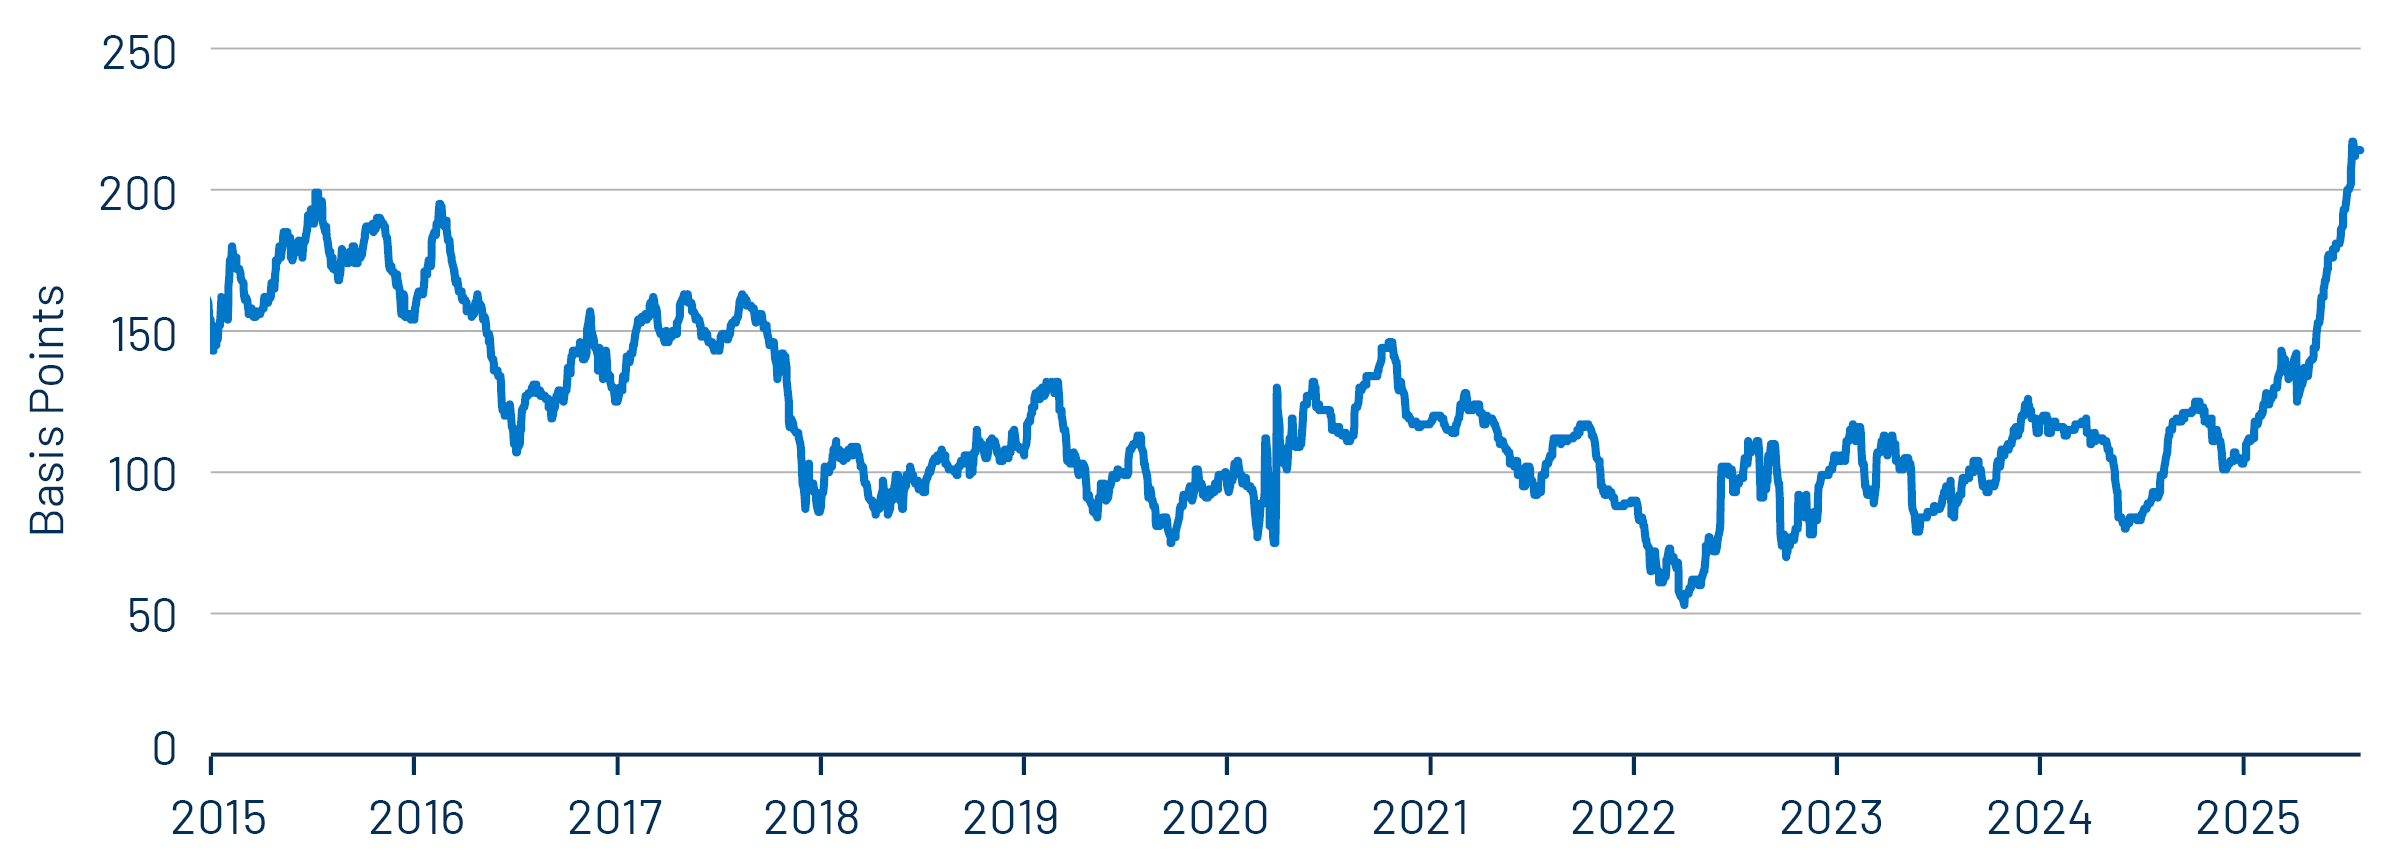
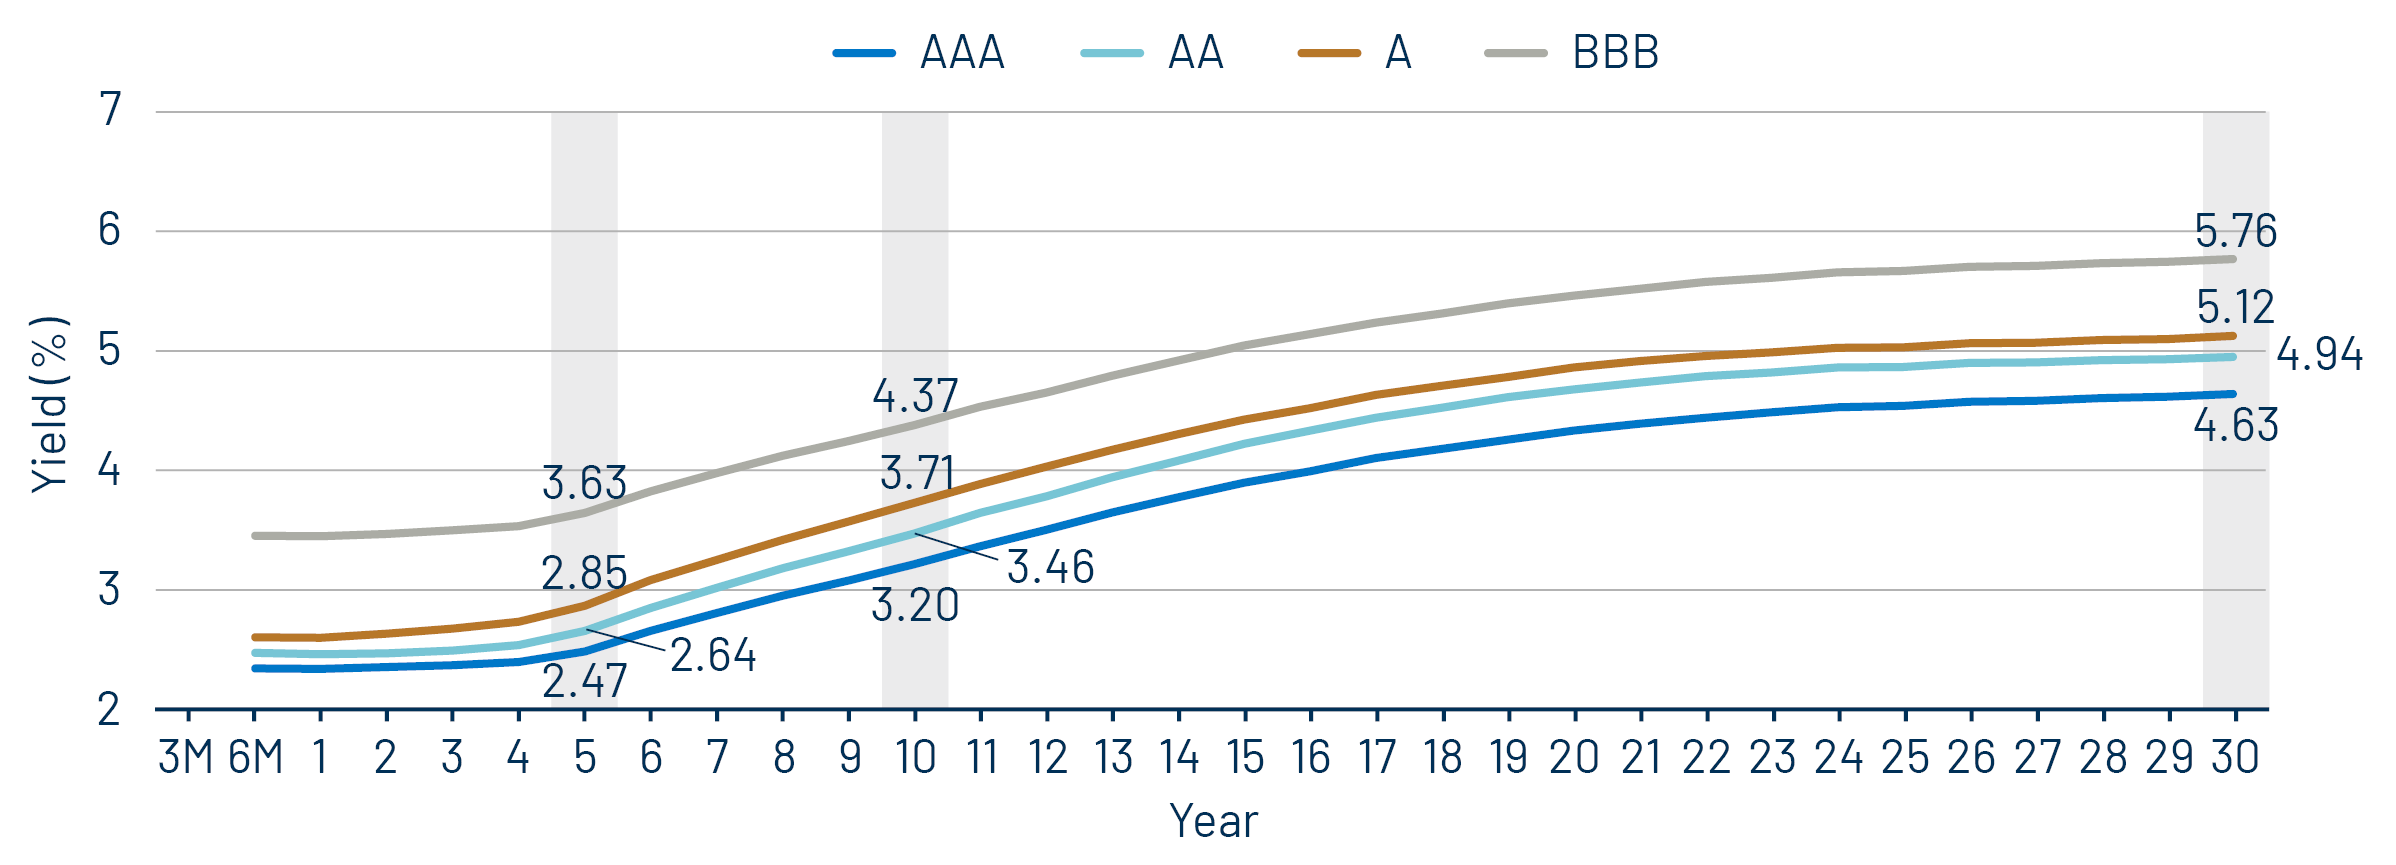
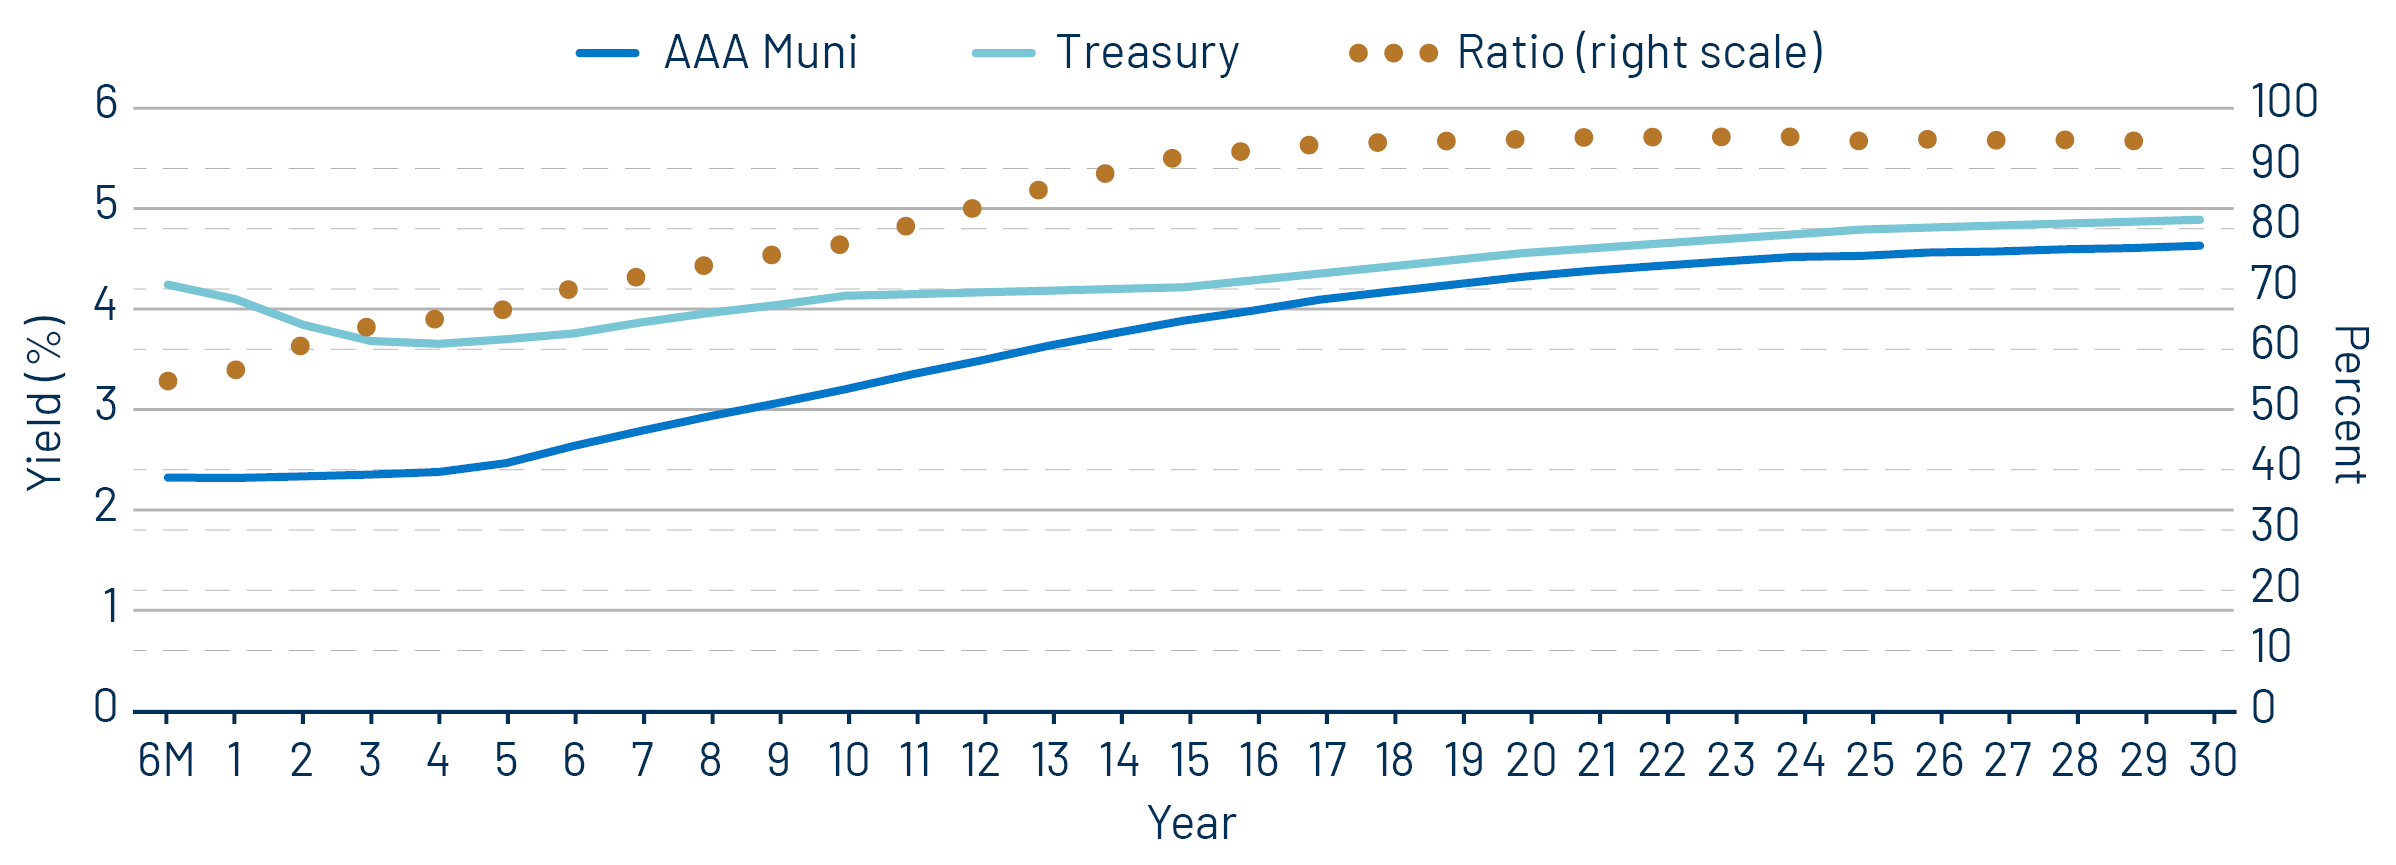
A significant development in the muni market this year has been the sharp steepening of the high-grade municipal yield curve. Despite Treasury yields moving lower across most maturities this year, the muni yield curve only moved lower inside of 10 years, while shifting materially higher (up to 76 bps) in longer maturities. From a historical perspective, the yield differential between the 30- and the 5-year AAA municipal bond, the 5s/30s spread, increased from 103 bps at year end to a decade-high level of 217 bps in July.

Exhibit 1: Muni and Treasury Curve Shifts
Muni and Treasury Curve Shifts
Source: Thomson Reuters MMD (AAA Muni Curve), Bloomberg (Treasury Curve), Western Asset. As of 01 Aug 25. Select the image to expand the view.
Exhibit 2: Historical Muni Curve Steepness
Historical Muni Curve Steepness
Source: Thomson Reuters MMD (AAA Muni Curve), Western Asset. As of 01 Aug 25. Select the image to expand the view.

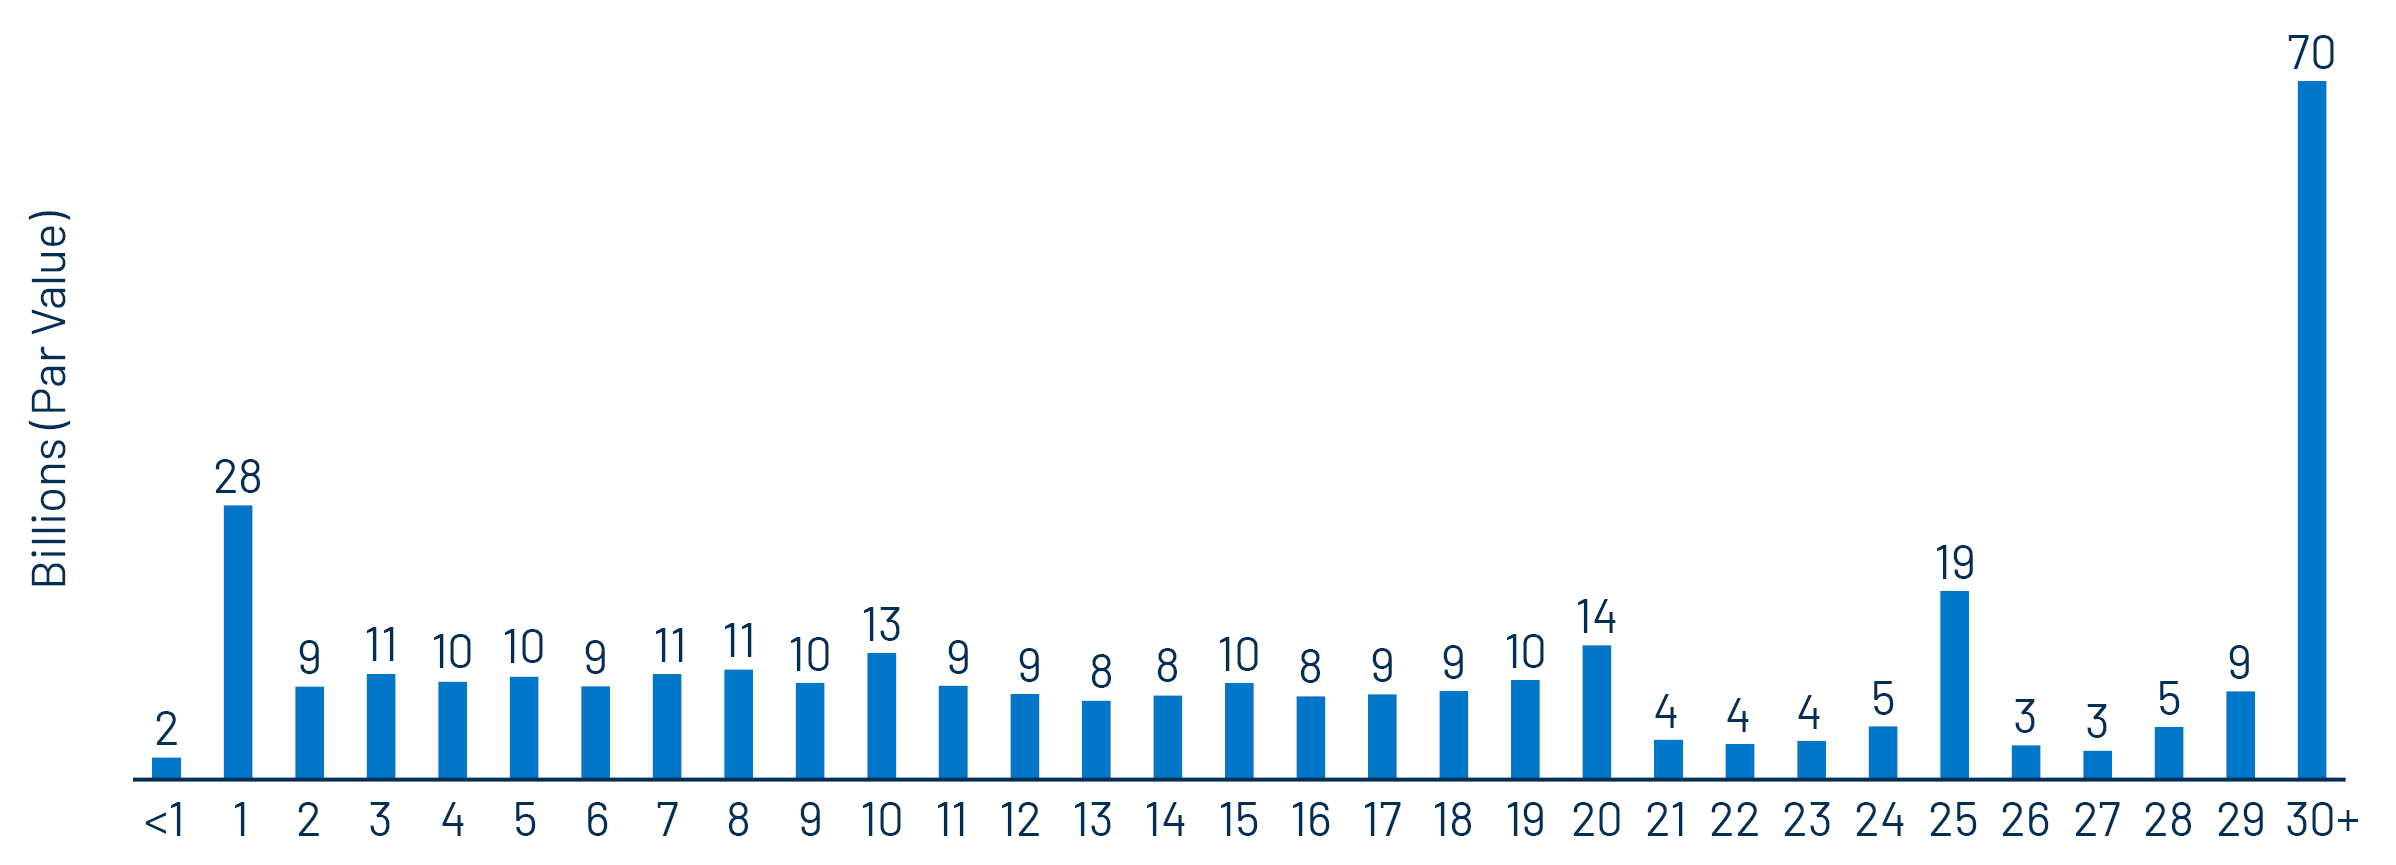
Western Asset attributes the muni yield curve steepening to the shifting supply and demand technicals that have been pronounced within the muni market this year. Demand for muni mutual funds, a primary consumer of longer-duration municipal securities, has been relatively lackluster with Morningstar data indicating $2 billion of net outflows from the long category over the first half of 2025. Meanwhile, positive muni demand has largely been contained within shorter and intermediate maturities, driven by mutual funds ($6 billion of short category inflows in 1H25), as well as separately managed accounts (SMAs) that typically invest within 1- to 15-year maturities. While demand has been frontloaded YTD, the record muni new-issue supply observed this year has been backloaded, further pressuring longer duration valuations this year.

Exhibit 3: 2025 Muni Supply by Maturity
2025 Muni Supply by Maturity
Source: Bloomberg, Western Asset. As of 01 Aug 25. Select the image to expand the view.

The significant yield curve steepening has provided opportunities for long-term investors that can benefit from higher tax-exempt income and potentially attractive total returns associated with rolldown opportunities. These municipal curve dynamics represent just one of the many levers an active manager can navigate to deliver after-tax relative value within the municipal market. As such, Western Asset seeks to deliver active solutions across fund and SMA strategies that can capitalize on these attractive relative valuations in longer maturities.

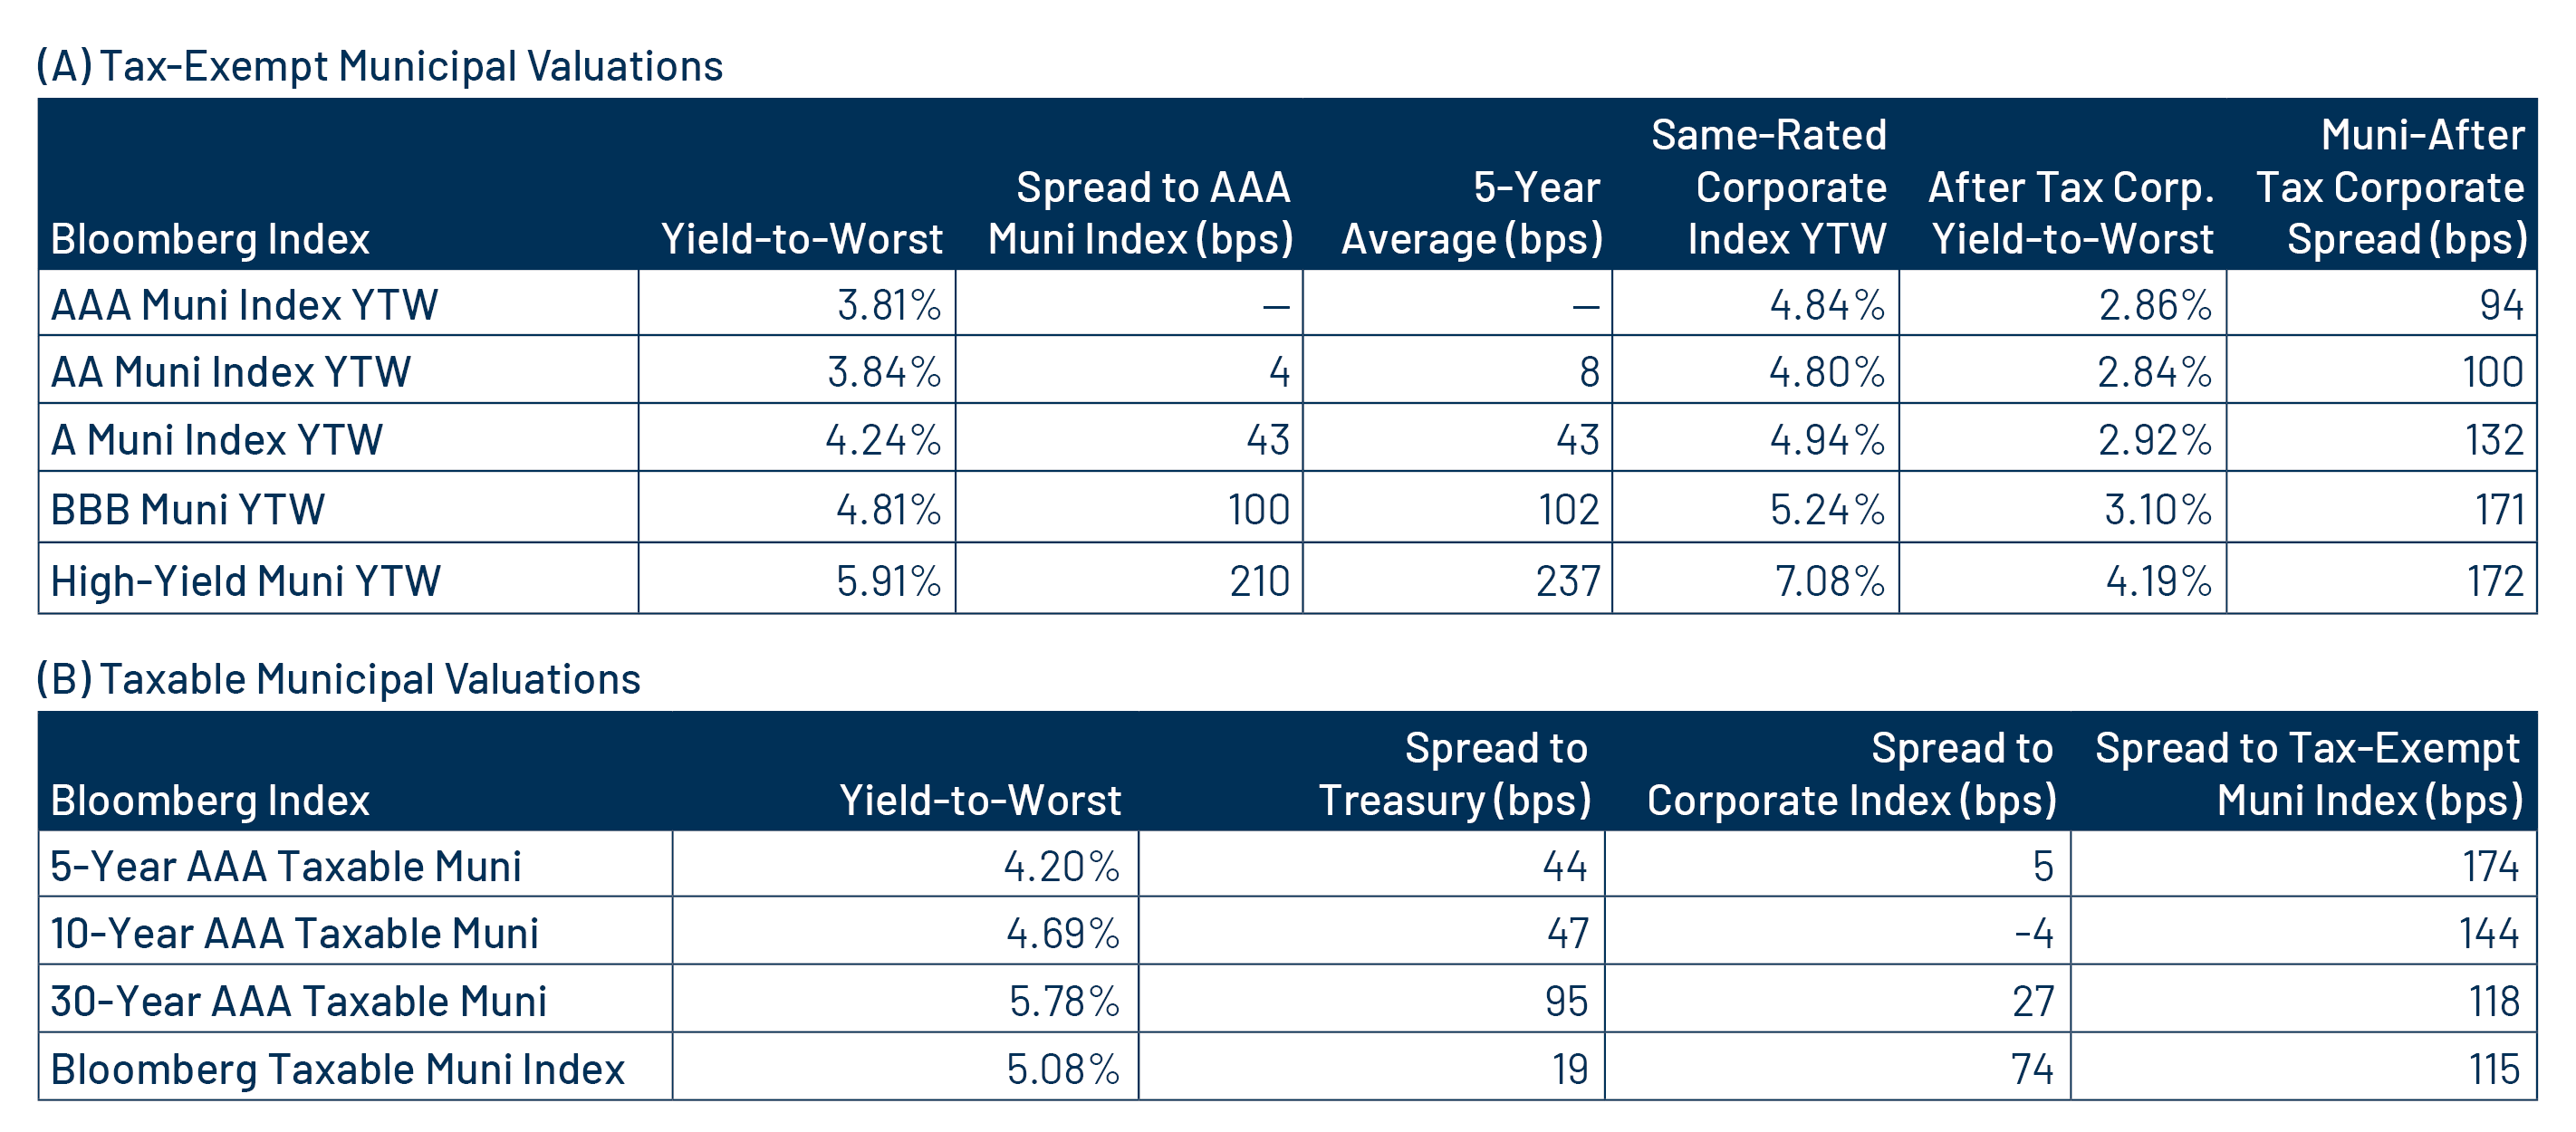
Municipal Credit Curves and Relative Value

Exhibit 4: Muni Credit Curves
Muni Credit Curves
Source: Bloomberg, Western Asset. As of 01 Aug 25. Bloomberg Valuation Service (BVAL) Municipal Credit Indices (AAA, AA, A, BBB, respectively) and US Sovereign Curves. Taxable-Equivalent Muni Credit Curves consider the top marginal effective tax rate of 40.8%. AA Muni is represented by the US General Obligation AA Muni BVAL Yield Curve. The BVAL curve is populated with pricing from uninsured AA General Obligation bonds. A Muni is represented by the US General Obligation A Muni BVAL Yield Curve. The BVAL curve is populated with pricing from uninsured A General Obligation bonds. BBB Muni is represented by the US General Obligation BBB Muni BVAL Yield Curve. The BVAL curve is populated with pricing from uninsured BBB General Obligation bonds. Indices are unmanaged and one cannot directly invest in them. They do not include fees, expenses or sales charges. Past performance is not an indicator or a guarantee of future results. Select the image to expand the view.
Exhibit 5: Taxable-Equivalent Muni Credit Curves
Taxable-Equivalent Muni Credit Curves
Source: Bloomberg, Western Asset. As of 01 Aug 25. Bloomberg Valuation Service (BVAL) Municipal Credit Indices (AAA, AA, A, BBB, respectively) and US Sovereign Curves. Taxable-Equivalent Muni Credit Curves consider the top marginal effective tax rate of 40.8%. AA Muni is represented by the US General Obligation AA Muni BVAL Yield Curve. The BVAL curve is populated with pricing from uninsured AA General Obligation bonds. A Muni is represented by the US General Obligation A Muni BVAL Yield Curve. The BVAL curve is populated with pricing from uninsured A General Obligation bonds. BBB Muni is represented by the US General Obligation BBB Muni BVAL Yield Curve. The BVAL curve is populated with pricing from uninsured BBB General Obligation bonds. Indices are unmanaged and one cannot directly invest in them. They do not include fees, expenses or sales charges. Past performance is not an indicator or a guarantee of future results. Select the image to expand the view.
Exhibit 6: AAA Munis vs. Treasuries
AAA Munis vs. Treasuries
Source: Muni Yields: Thomson Reuters MMD, Treasury Yields: Bloomberg. As of 01 Aug 25. Past performance is not a guarantee of future results. It is not possible to invest directly in an index. Select the image to expand the view.
Exhibit 7: Tax-Exempt and Taxable Muni Valuations
Tax-Exempt and Taxable Muni Valuations
Source: Bloomberg, Western Asset. As of 01 Aug 25. Yield-to-worst (YTW) is the lowest potential yield that can be received on a bond without the issuer actually defaulting. AAA, AA, A, BBB Corporate Indices; After-Tax Yield assumes a top effective tax rate of 40.8%. Taxable Muni Index Corporate comparable used is the Global Corporate Aggregate (ex. BBB) to better align credit quality and duration. Select the image to expand the view.

Western Asset Key Themes for Muni Investors

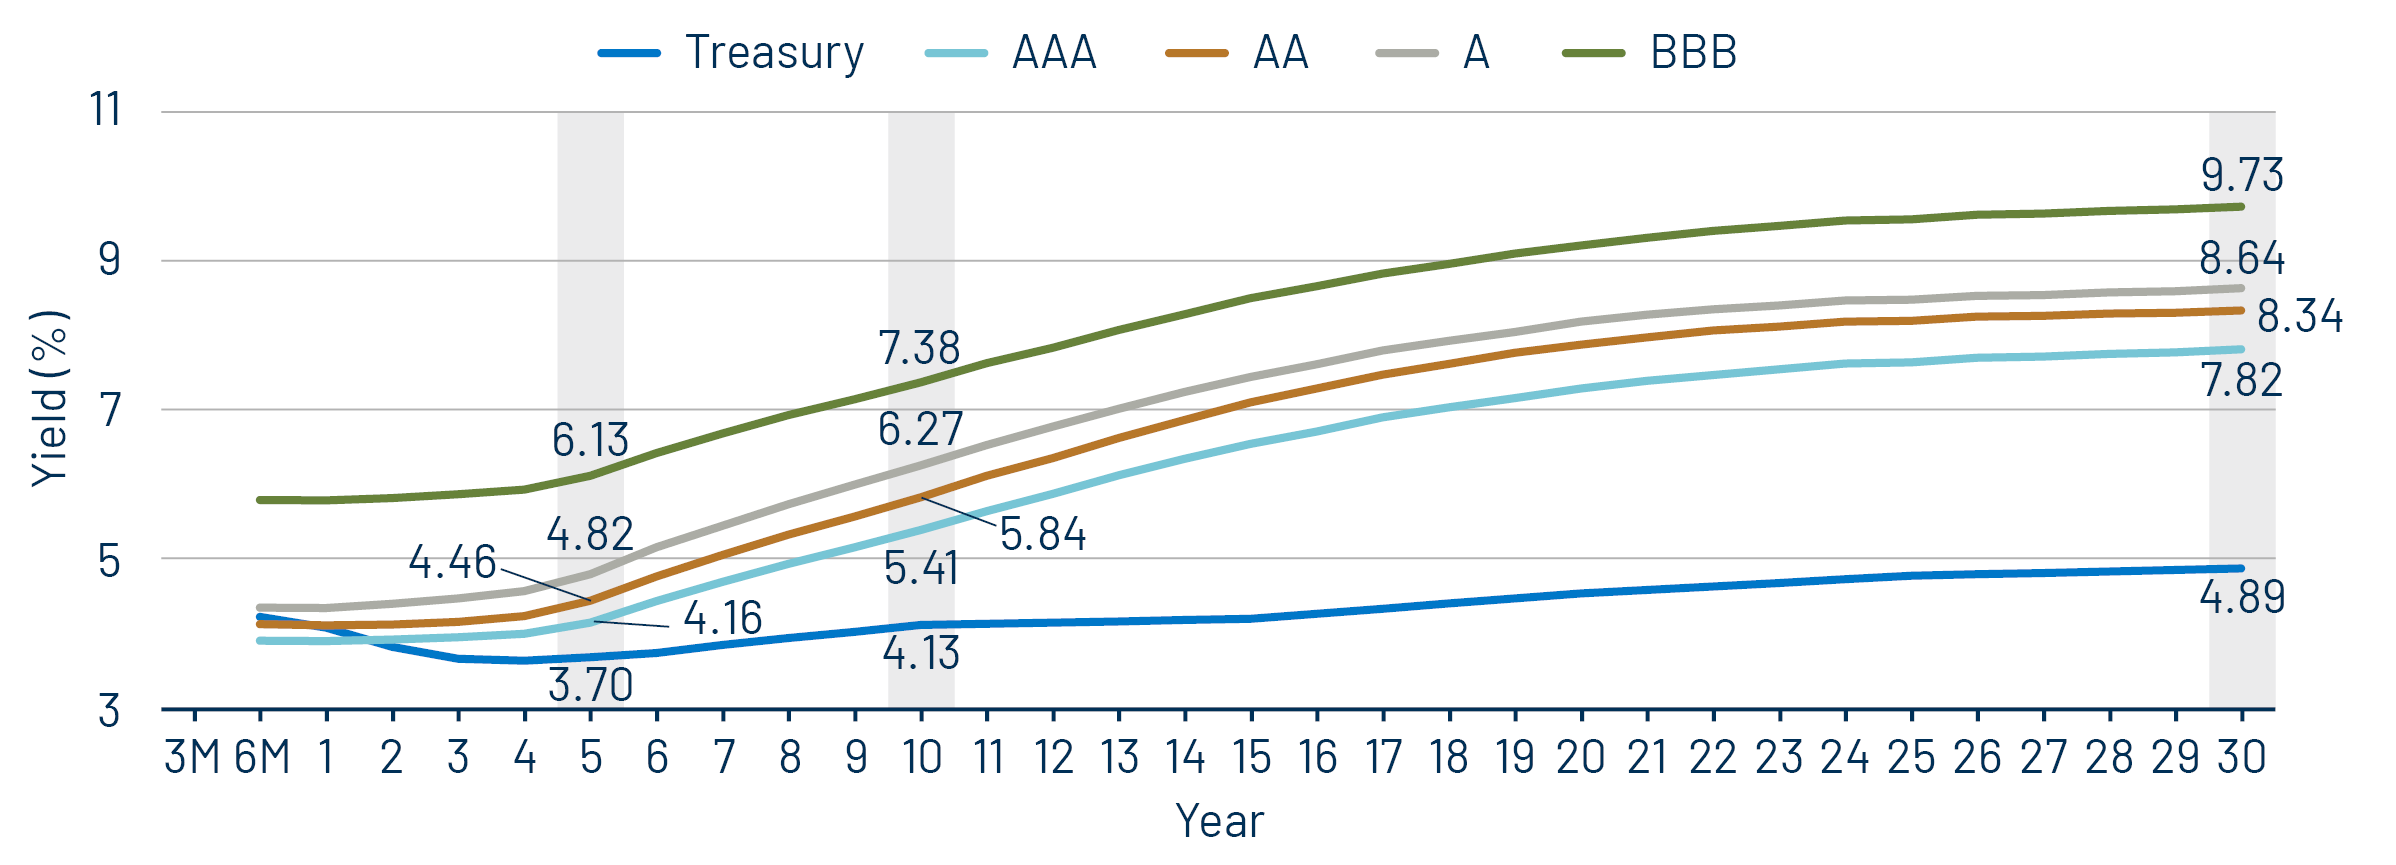
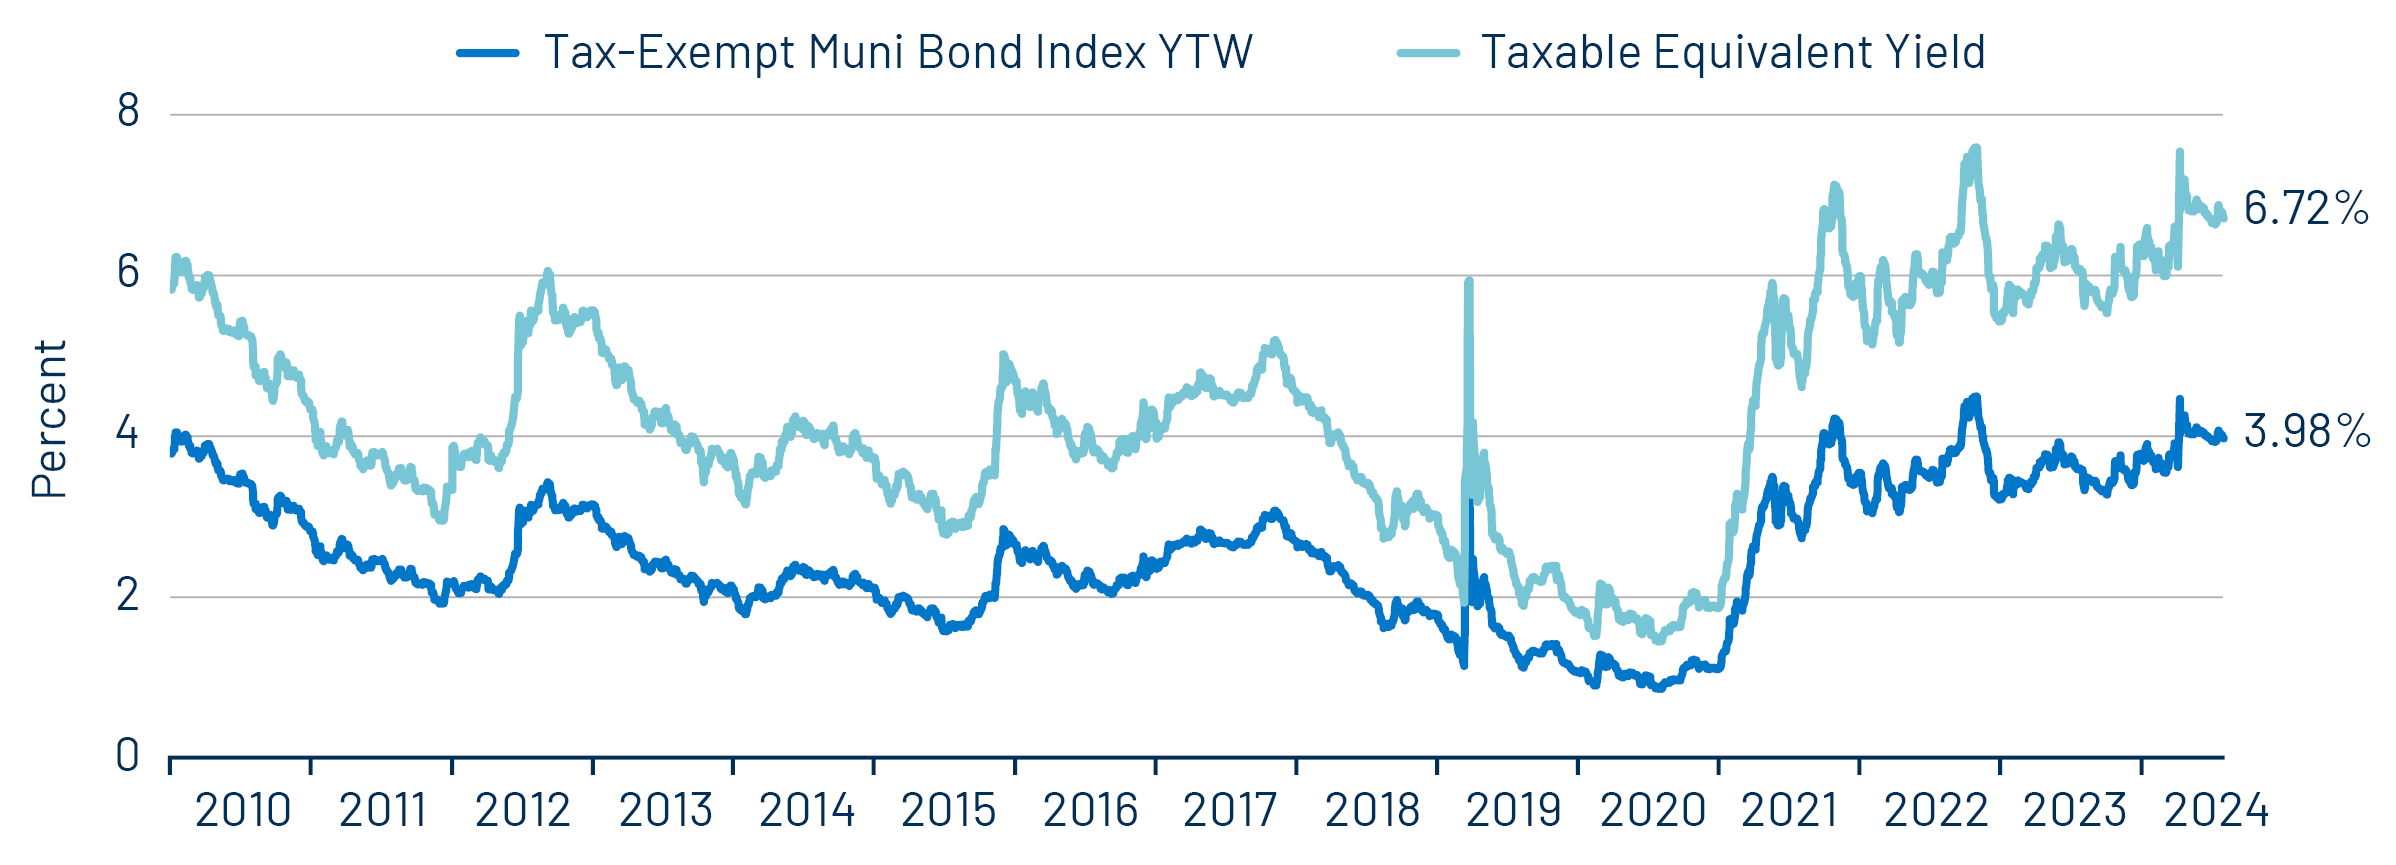
Theme #1: Municipal taxable-equivalent yields and income opportunities remain near decade-high levels.

Exhibit 8: Muni and Taxable-Equivalent Muni Yield-to-Worst
Muni and Taxable-Equivalent Muni Yield-to-Worst
Source: Bloomberg, Western Asset. As of 01 Aug 25. Bloomberg Municipal Bond Index yield considering highest marginal tax rate of 40.8%. Indexes are unmanaged and one cannot directly invest in them. They do not include fees, expenses or sales charges. Past performance is not an indicator or a guarantee of future results. Select the image to expand the view.

Theme #2: The AAA muni curve has steepened, offering better value in intermediate and longer maturities.

Exhibit 9: AAA Municipal vs. Treasury Yield Curves
AAA Municipal vs. Treasury Yield Curves
Source: Bloomberg, Western Asset. As of 01 Aug 25. Bloomberg Valuation Service (BVAL) AAA Muni Curve and US On-/Off-the-Run Sovereign Curve. Indexes are unmanaged and one cannot directly invest in them. They do not include fees, expenses or sales charges. Past performance is not an indicator or a guarantee of future results. Select the image to expand the view.

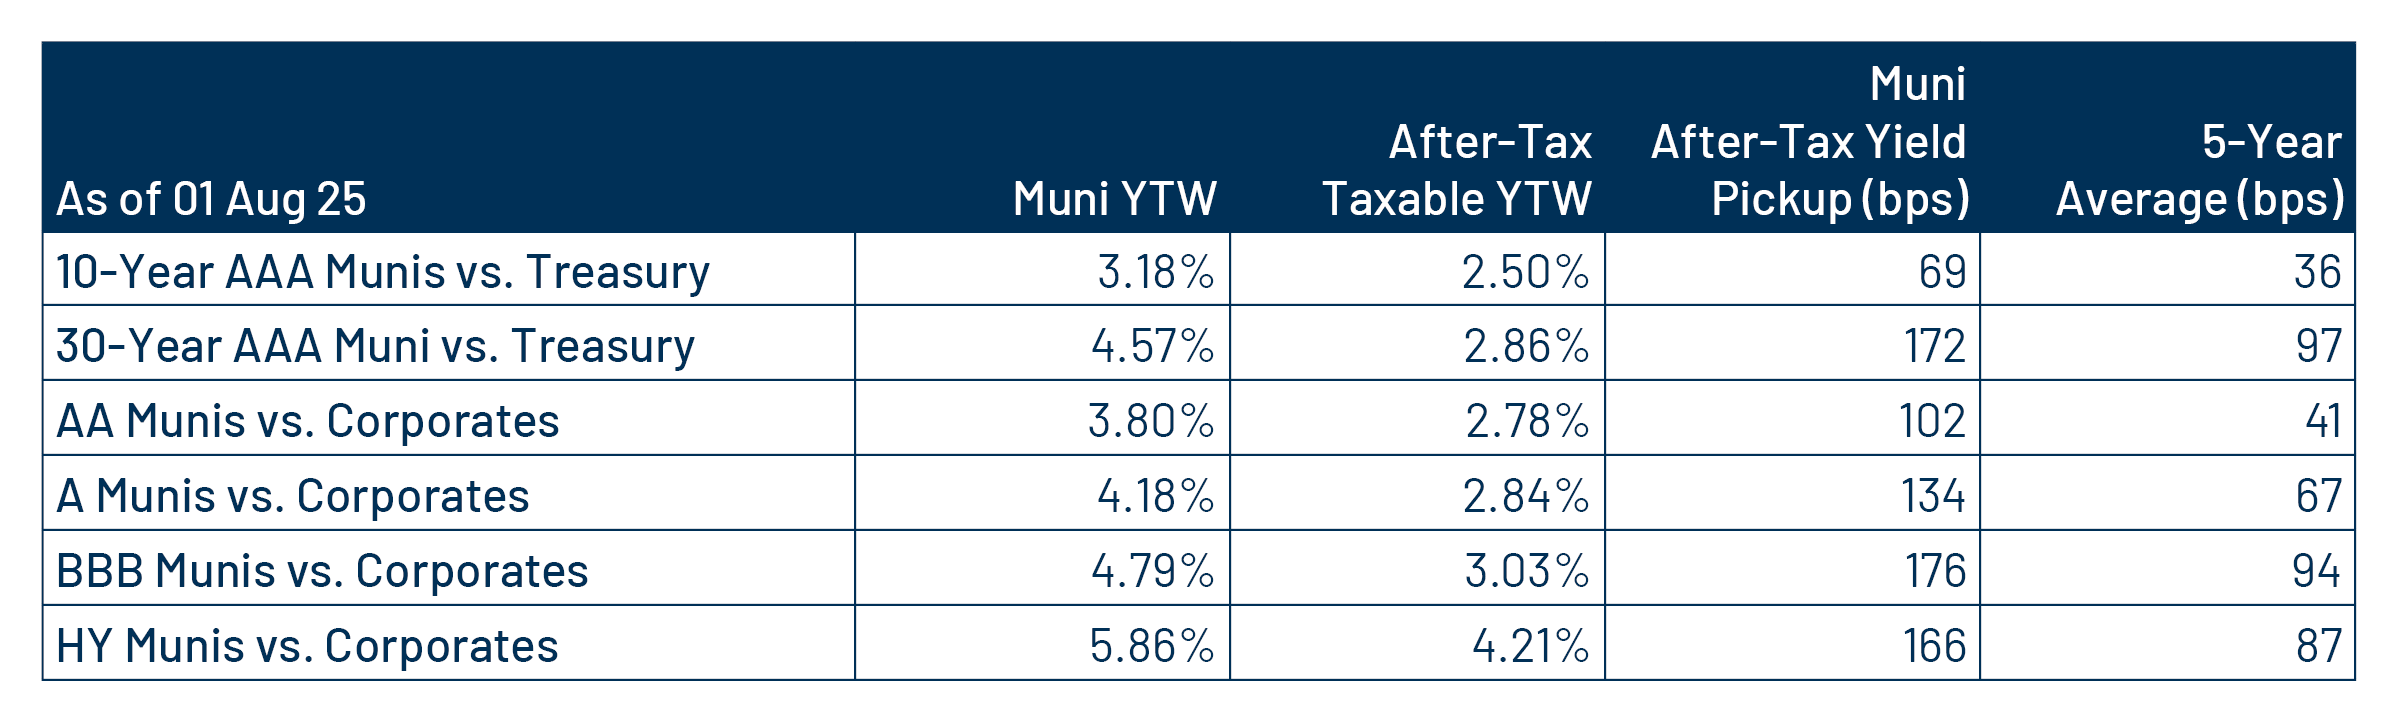
Theme #3: Munis offer attractive after-tax yield compared to taxable alternatives.

Exhibit 10: Municipal vs. Taxable Fixed-Income Yields by Quality
Municipal vs. Taxable Fixed-Income Yields by Quality
Source: Western Asset, Bloomberg. As 01 Aug 25. 10- and 30-Year comparison reflects Bloomberg Valuation Service (BVAL) AAA Muni Curve and US On-/Off-the-Run Sovereign Curve. AA Muni reflects the Bloomberg AA Muni Bond Index. A Muni reflects the Bloomberg A Muni Bond Index. BBB Muni reflects the Bloomberg BBB Muni Bond Index. HY Muni reflects the Bloomberg High Yield Muni Bond Index. AA Corp reflects the Bloomberg AA Corporate Bond Index. A Corp reflects the Bloomberg A Corporate Bond Index. BBB Corp reflects the Bloomberg BBB Corporate Bond Index. After-tax yield considers the top marginal tax rate of 40.8%. Indexes are unmanaged and one cannot directly invest in them. They do not include fees, expenses or sales charges. Past performance is not an indicator or a guarantee of future results. Select the image to expand the view.

© Western Asset Management Company, LLC 2025. The information contained in these materials ("the materials") is intended for the exclusive use of the designated recipient ("the recipient"). This information is proprietary and confidential and may contain commercially sensitive information, and may not be copied, reproduced or republished, in whole or in part, without the prior written consent of Western Asset Management Company ("Western Asset").
Past performance does not predict future returns. These materials should not be deemed to be a prediction or projection of future performance. These materials are intended for investment professionals including professional clients, eligible counterparties, and qualified investors only.
These materials have been produced for illustrative and informational purposes only. These materials contain Western Asset's opinions and beliefs as of the date designated on the materials; these views are subject to change and may not reflect real-time market developments and investment views.
Third party data may be used throughout the materials, and this data is believed to be accurate to the best of Western Asset's knowledge at the time of publication, but cannot be guaranteed. These materials may also contain strategy or product awards or rankings from independent third parties or industry publications which are based on unbiased quantitative and/or qualitative information determined independently by each third party or publication. In some cases, Western Asset may subscribe to these third party's standard industry services or publications. These standard subscriptions and services are available to all asset managers and do not influence rankings or awards in any way.
Investment strategies or products discussed herein may involve a high degree of risk, including the loss of some or all capital. Investments in any products or strategies described in these materials may be volatile, and investors should have the financial ability and willingness to accept such risks.
Unless otherwise noted, investment performance contained in these materials is reflective of a strategy composite. All other strategy data and information included in these materials reflects a representative portfolio which is an account in the composite that Western Asset believes most closely reflects the current portfolio management style of the strategy. Performance is not a consideration in the selection of the representative portfolio. The characteristics of the representative portfolio shown may differ from other accounts in the composite. Information regarding the representative portfolio and the other accounts in the composite are available upon request. Statements in these materials should not be considered investment advice. References, either general or specific, to securities and/or issuers in the materials are for illustrative purposes only and are not intended to be, and should not be interpreted as, recommendation to purchase or sell such securities. Employees and/or clients of Western Asset may have a position in the securities or issuers mentioned.
These materials are not intended to provide, and should not be relied on for, accounting, legal, tax, investment or other advice. The recipient should consult its own counsel, accountant, investment, tax, and any other advisers for this advice, including economic risks and merits, related to making an investment with Western Asset. The recipient is responsible for observing the applicable laws and regulations of their country of residence.
Founded in 1971, Western Asset Management Company is a global fixed-income investment manager with offices in Pasadena, New York, London, Singapore, Tokyo, Melbourne, São Paulo, Hong Kong, and Zürich. Western Asset is a wholly owned subsidiary of Franklin Resources, Inc. but operates autonomously. Western Asset is comprised of six legal entities across the globe, each with distinct regional registrations: Western Asset Management Company, LLC, a registered Investment Adviser with the Securities and Exchange Commission; Western Asset Management Company Ltda. is regulated by Comissão de Valores Mobiliários; Western Asset Management Company Pty Ltd ABN 41 117 767 923 is the holder of the Australian Financial Services License 303160; Western Asset Management Company Pte. Ltd. Co. Reg. No. 200007692R is a holder of a Capital Markets Services License for fund management and regulated by the Monetary Authority of Singapore; Western Asset Management Company Ltd, a registered Financial Instruments Business Operator and regulated by the Financial Services Agency of Japan; and Western Asset Management Company Limited is authorised and regulated by the Financial Conduct Authority ("FCA") (FRN 145930). This communication is intended for distribution to Professional Clients only if deemed to be a financial promotion in the UK as defined by the FCA. This communication may also be intended for certain EEA countries where Western Asset has been granted permission to do so. For the current list of the approved EEA countries please contact Western Asset at +44 (0)20 7422 3000.