skip navigation
Blog

Stay up to date on timely topics and market events. Subscribe to our Blog now.

MARKETS
June 06, 2023

Weekly Municipal Monitor—Summer Travel

By Michael Linko

Stay up to date on timely topics and market events. Subscribe to our Blog now.

Municipals Posted Positive Returns Last Week

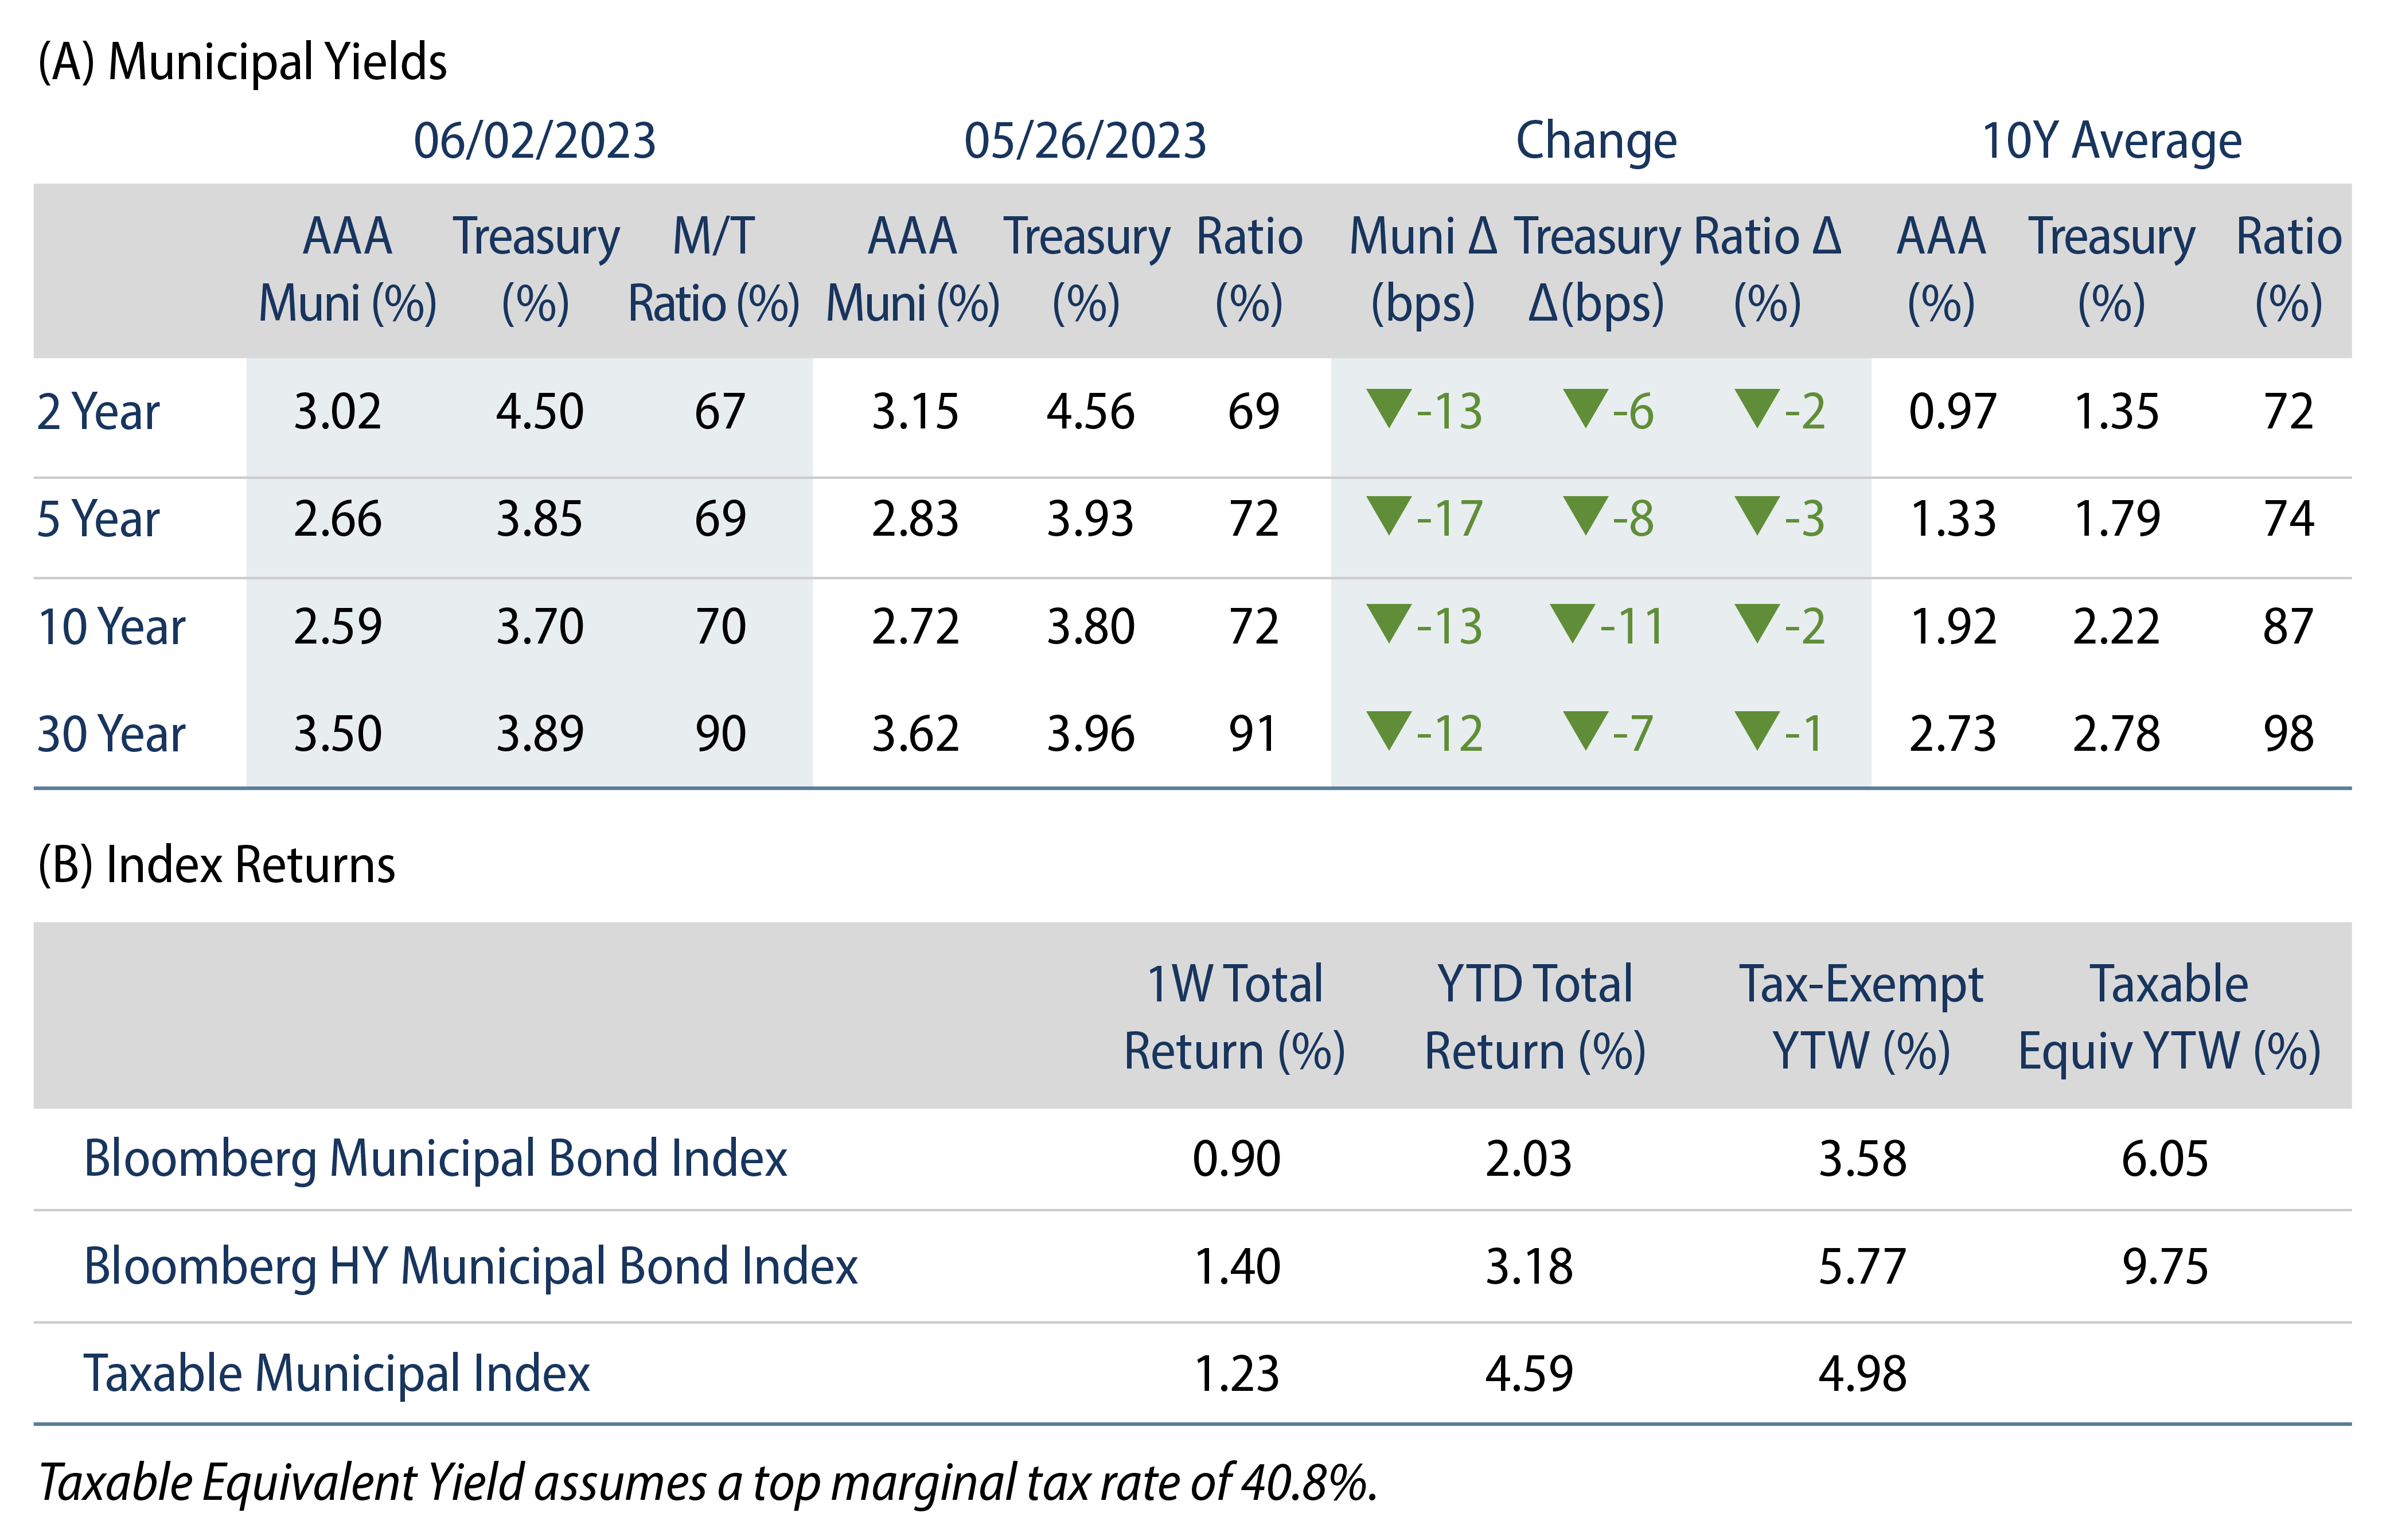
Municipals posted positive returns last week as muni yields moved lower across the curve. Munis outperformed Treasuries during a week of considerable volatility. Municipals followed Treasuries sharply lower early in the week on the passage of the debt ceiling package and declining unit labor cost data, but failed to move higher with Treasuries on Friday following the release of strong payrolls data. Technicals remained challenged by fund outflows and above average new-issue supply. The Bloomberg Municipal Index returned 0.90% during the week, the High Yield Muni Index returned 1.40% and the Taxable Muni Index returned 1.23%. This week we highlight the progress of ridership recovery trends across the municipal transportation sector.

Technicals Were Challenged by Fund Outflows, Above Average Supply, and Bank Bid Lists

Fund Flows: During the week ending May 31, weekly reporting municipal mutual funds recorded $1.3 billion of net outflows, according to Lipper. Long-term funds recorded $514 million of outflows, high-yield funds recorded $473 million of outflows and intermediate funds recorded $290 million of outflows. This week’s outflows bring year-to-date (YTD) net outflows to $7.7 billion.

Supply:The muni market recorded $9.6 billion of new-issue volume last week, up 45% from the prior week. In addition to above average new-issue supply, the market contended with over $200 million of the FDIC window of Silicon Valley Bank municipal securities. YTD issuance of $144 billion remains down 18% year-over year (YoY), with tax-exempt issuance down 10% YoY and taxable issuance down 50% YoY. This week’s calendar is expected to drop to $2.6 billion. Large transactions include $892 million New York City Housing Development Corporation and $700 million Los Angeles Tax and Revenue Anticipation Note transactions.

This Week in Munis: Summer Travel

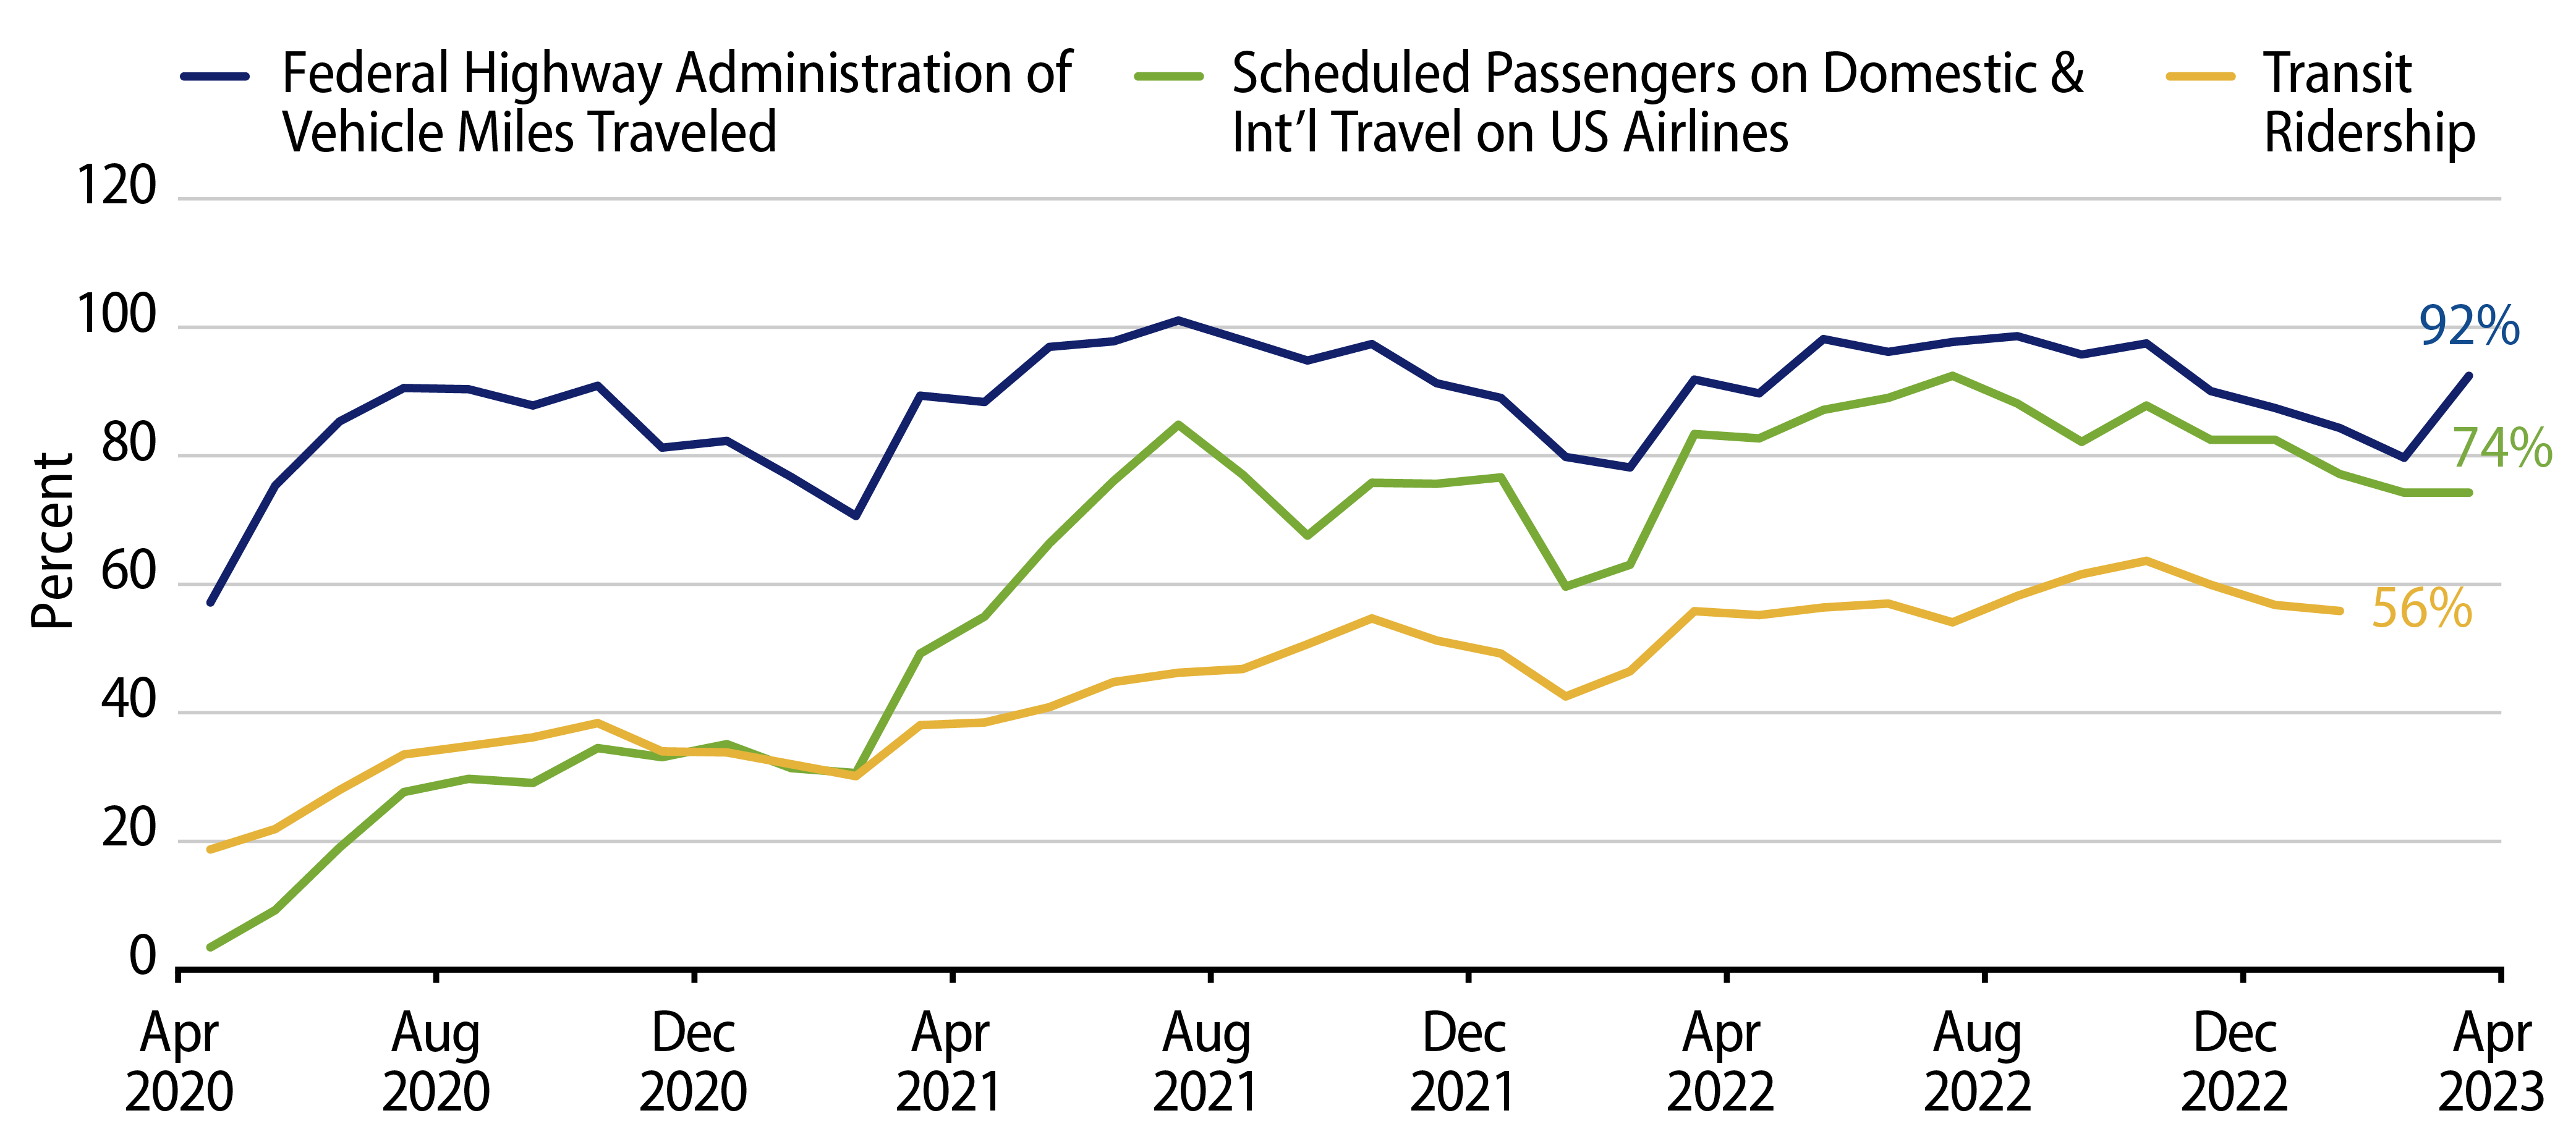
As summer travel season kicks off, we provide an update on the state of passenger traffic across the municipal transportation sector. In the early pandemic recovery, we highlighted the progress of vehicle traffic, airline traffic and mass transit ridership from pandemic lows. With pandemic pressures further easing, we continue to see traffic levels recover, but traffic still generally remains below pre-pandemic peaks which could introduce potential credit challenges as the impact of robust federal stimulus measures begin to fade.

  • Vehicle traffic, including bridge and toll fares collected by municipal transportation agencies, was arguably least impacted by pandemic conditions and was also earliest to recover. After falling to a low of 57% of pre-pandemic levels in April 2020, ridership trends fully recovered to 101% of pre-pandemic levels in July 2022, and most recently the 271 million miles travelled in March 2023 was up 1% from the prior year.
  • Airline traffic was arguably most impacted by the shutdowns, with US domestic passenger traffic falling to just 3% of its pre-pandemic peak in April 2020. Airline passenger traffic nearly fully recovered by July 2022, reaching as high as 92% of pre-pandemic levels. Since last year’s seasonal summer peak, passenger air travel has since cooled to 74% of the pre-pandemic high. Most recently, the 64 million passengers that traveled US airlines in March 2023 was approximately 11% below levels seen in March 2022, a potential signal of slowing demand amid inflationary headwinds.
  • Public transit ridership was also among the hardest hit segments of the muni market during the pandemic, with ridership volumes falling to 19% of pre-pandemic levels in April 2020. We have since observed ridership gradually recover as return-to-office policies took shape over the past two years, and most recent January 2023 ridership levels of 511 million increased 33% YoY. However, the mass transit recovery has lagged vehicle travel and air travel, reaching just 56% of the pre-pandemic peak.
  • Exhibit 1: Ridership Recovery by Mode of Transit (Percent of Pre-Pandemic Peak)
    Ridership Recovery by Mode of Transit (Percent of Pre-Pandemic Peak)
    Source: US Federal Highway Administration, TSA and US Bureau of Transportation. As of 22 May 23. Select the image to expand the view.

    As the impact of federal stimulus measures fade, concerns around large mass transit systems’ ability to sustain below-expectation ridership have risen. Favorably, many public transit securities benefit from more than just ridership-dependent fare box revenues, but are also secured by sales taxes which continue to grow at robust levels In addition, transportation agencies are also lobbying for additional state support to fund ongoing operations. For example, last month, the New York Metropolitan Transit Authority (MTA) was successful in garnering additional support from the most recent New York State budget, including a $1.1 billion hike in payroll taxes for major companies based in NYC and an increased contribution of $165 million from the city to pay for a greater share of the para-transit costs. These efforts provide additional time for the ridership recovery to continue, which we anticipate will remain a slow grind upward as return-to-office policies are further formalized.

    Exhibit 2: Average Option-Adjusted Spread (OAS) by Transportation Sector
    Average Option-Adjusted Spread (OAS) by Transportation Sector
    Source: Western Asset, Bloomberg. As of 31 May 23. Select the image to expand the view.

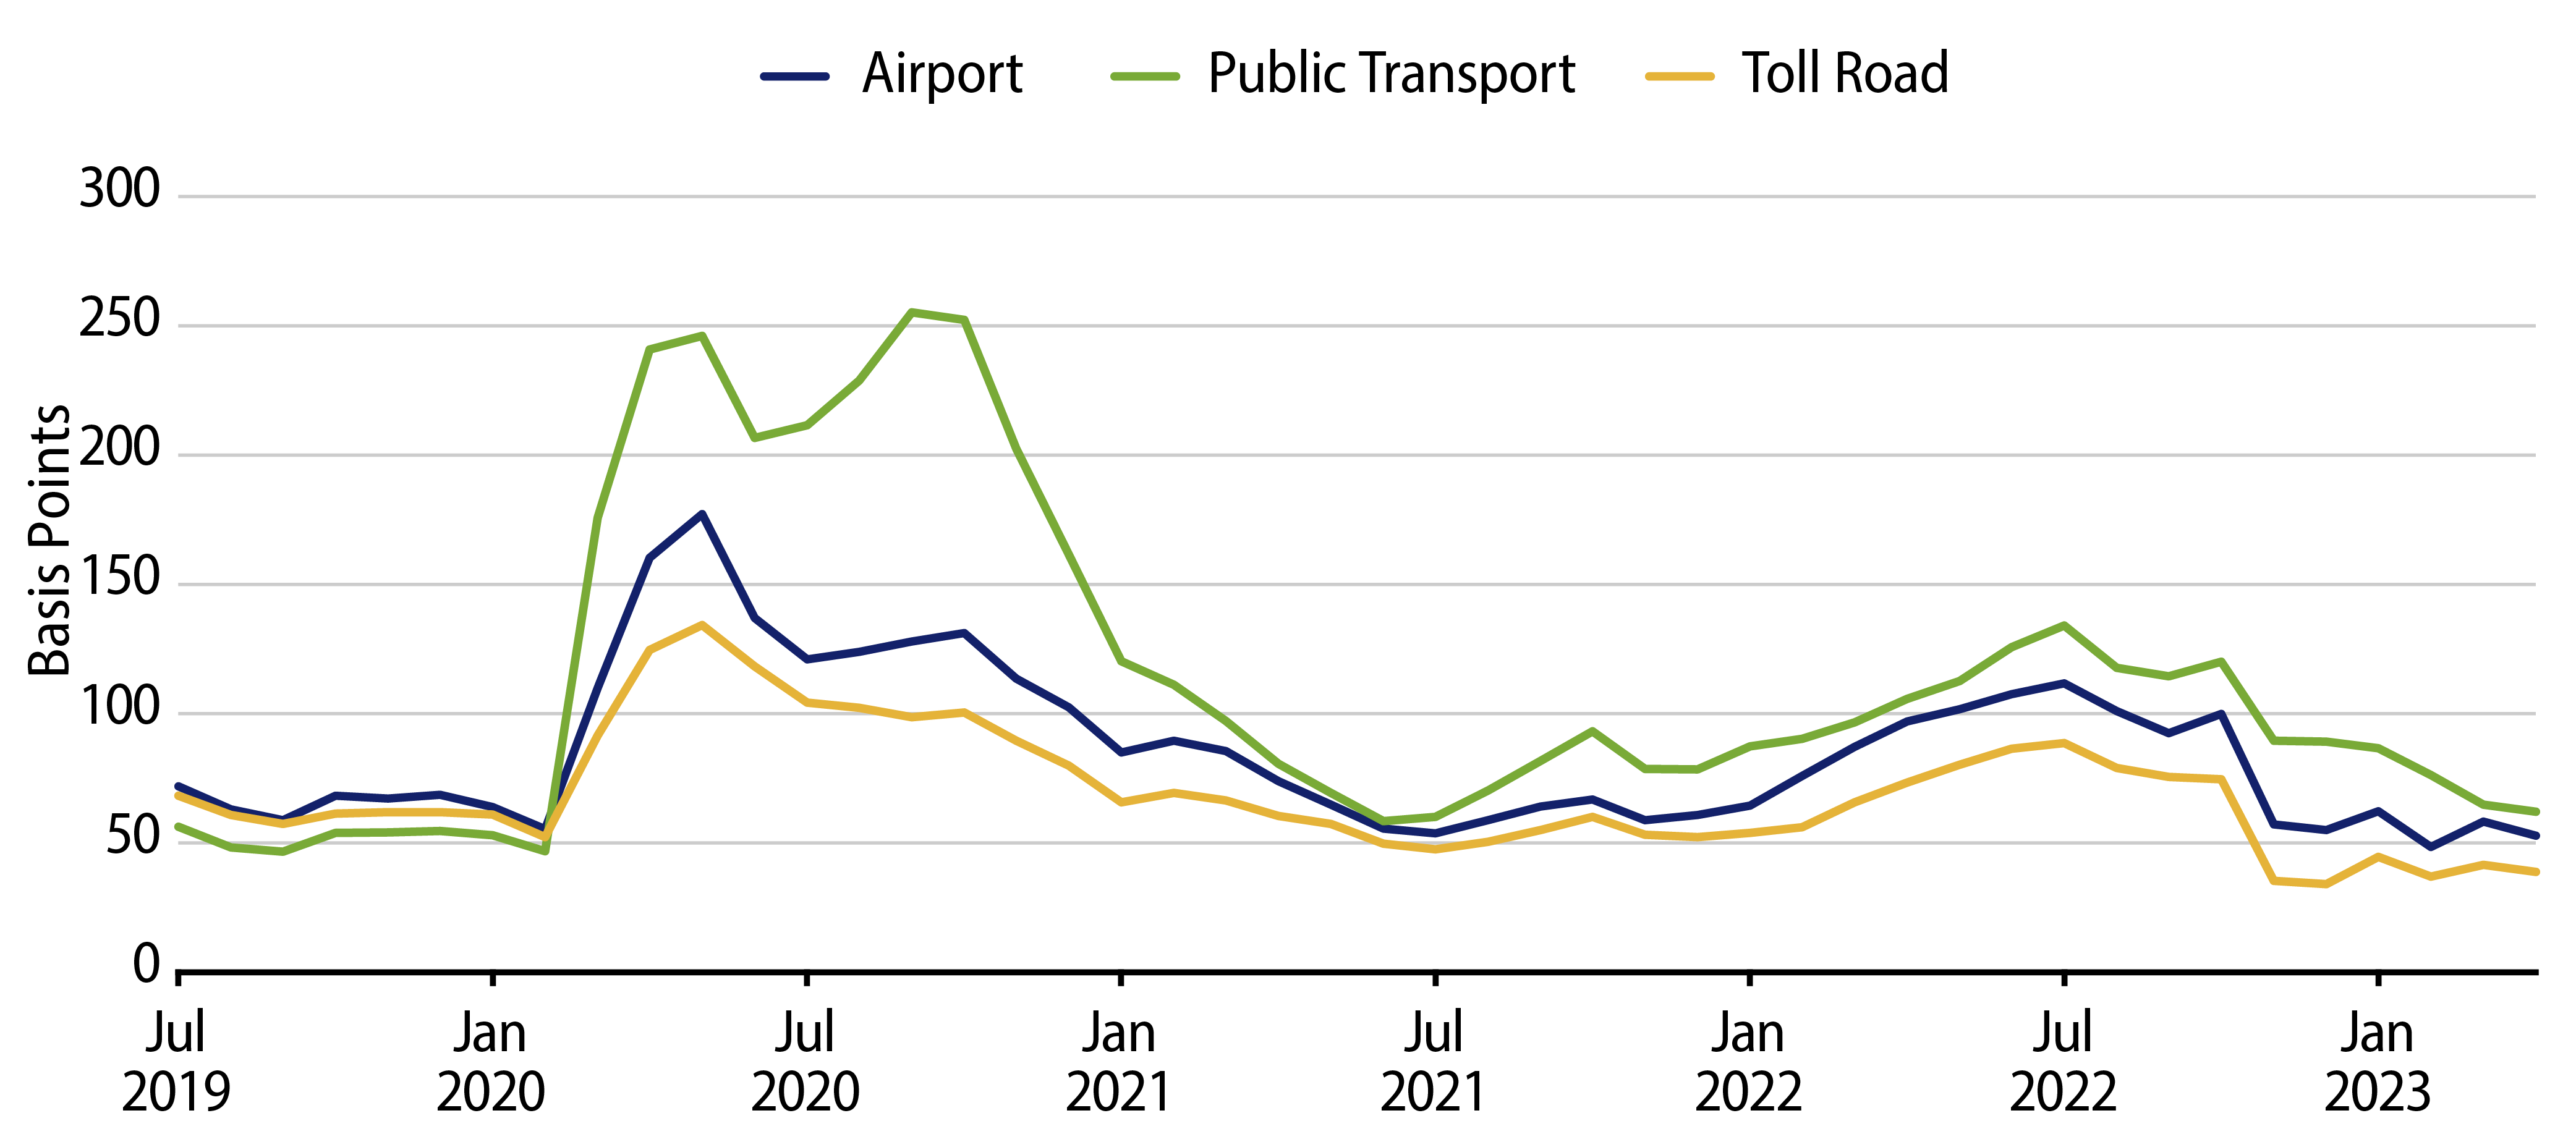
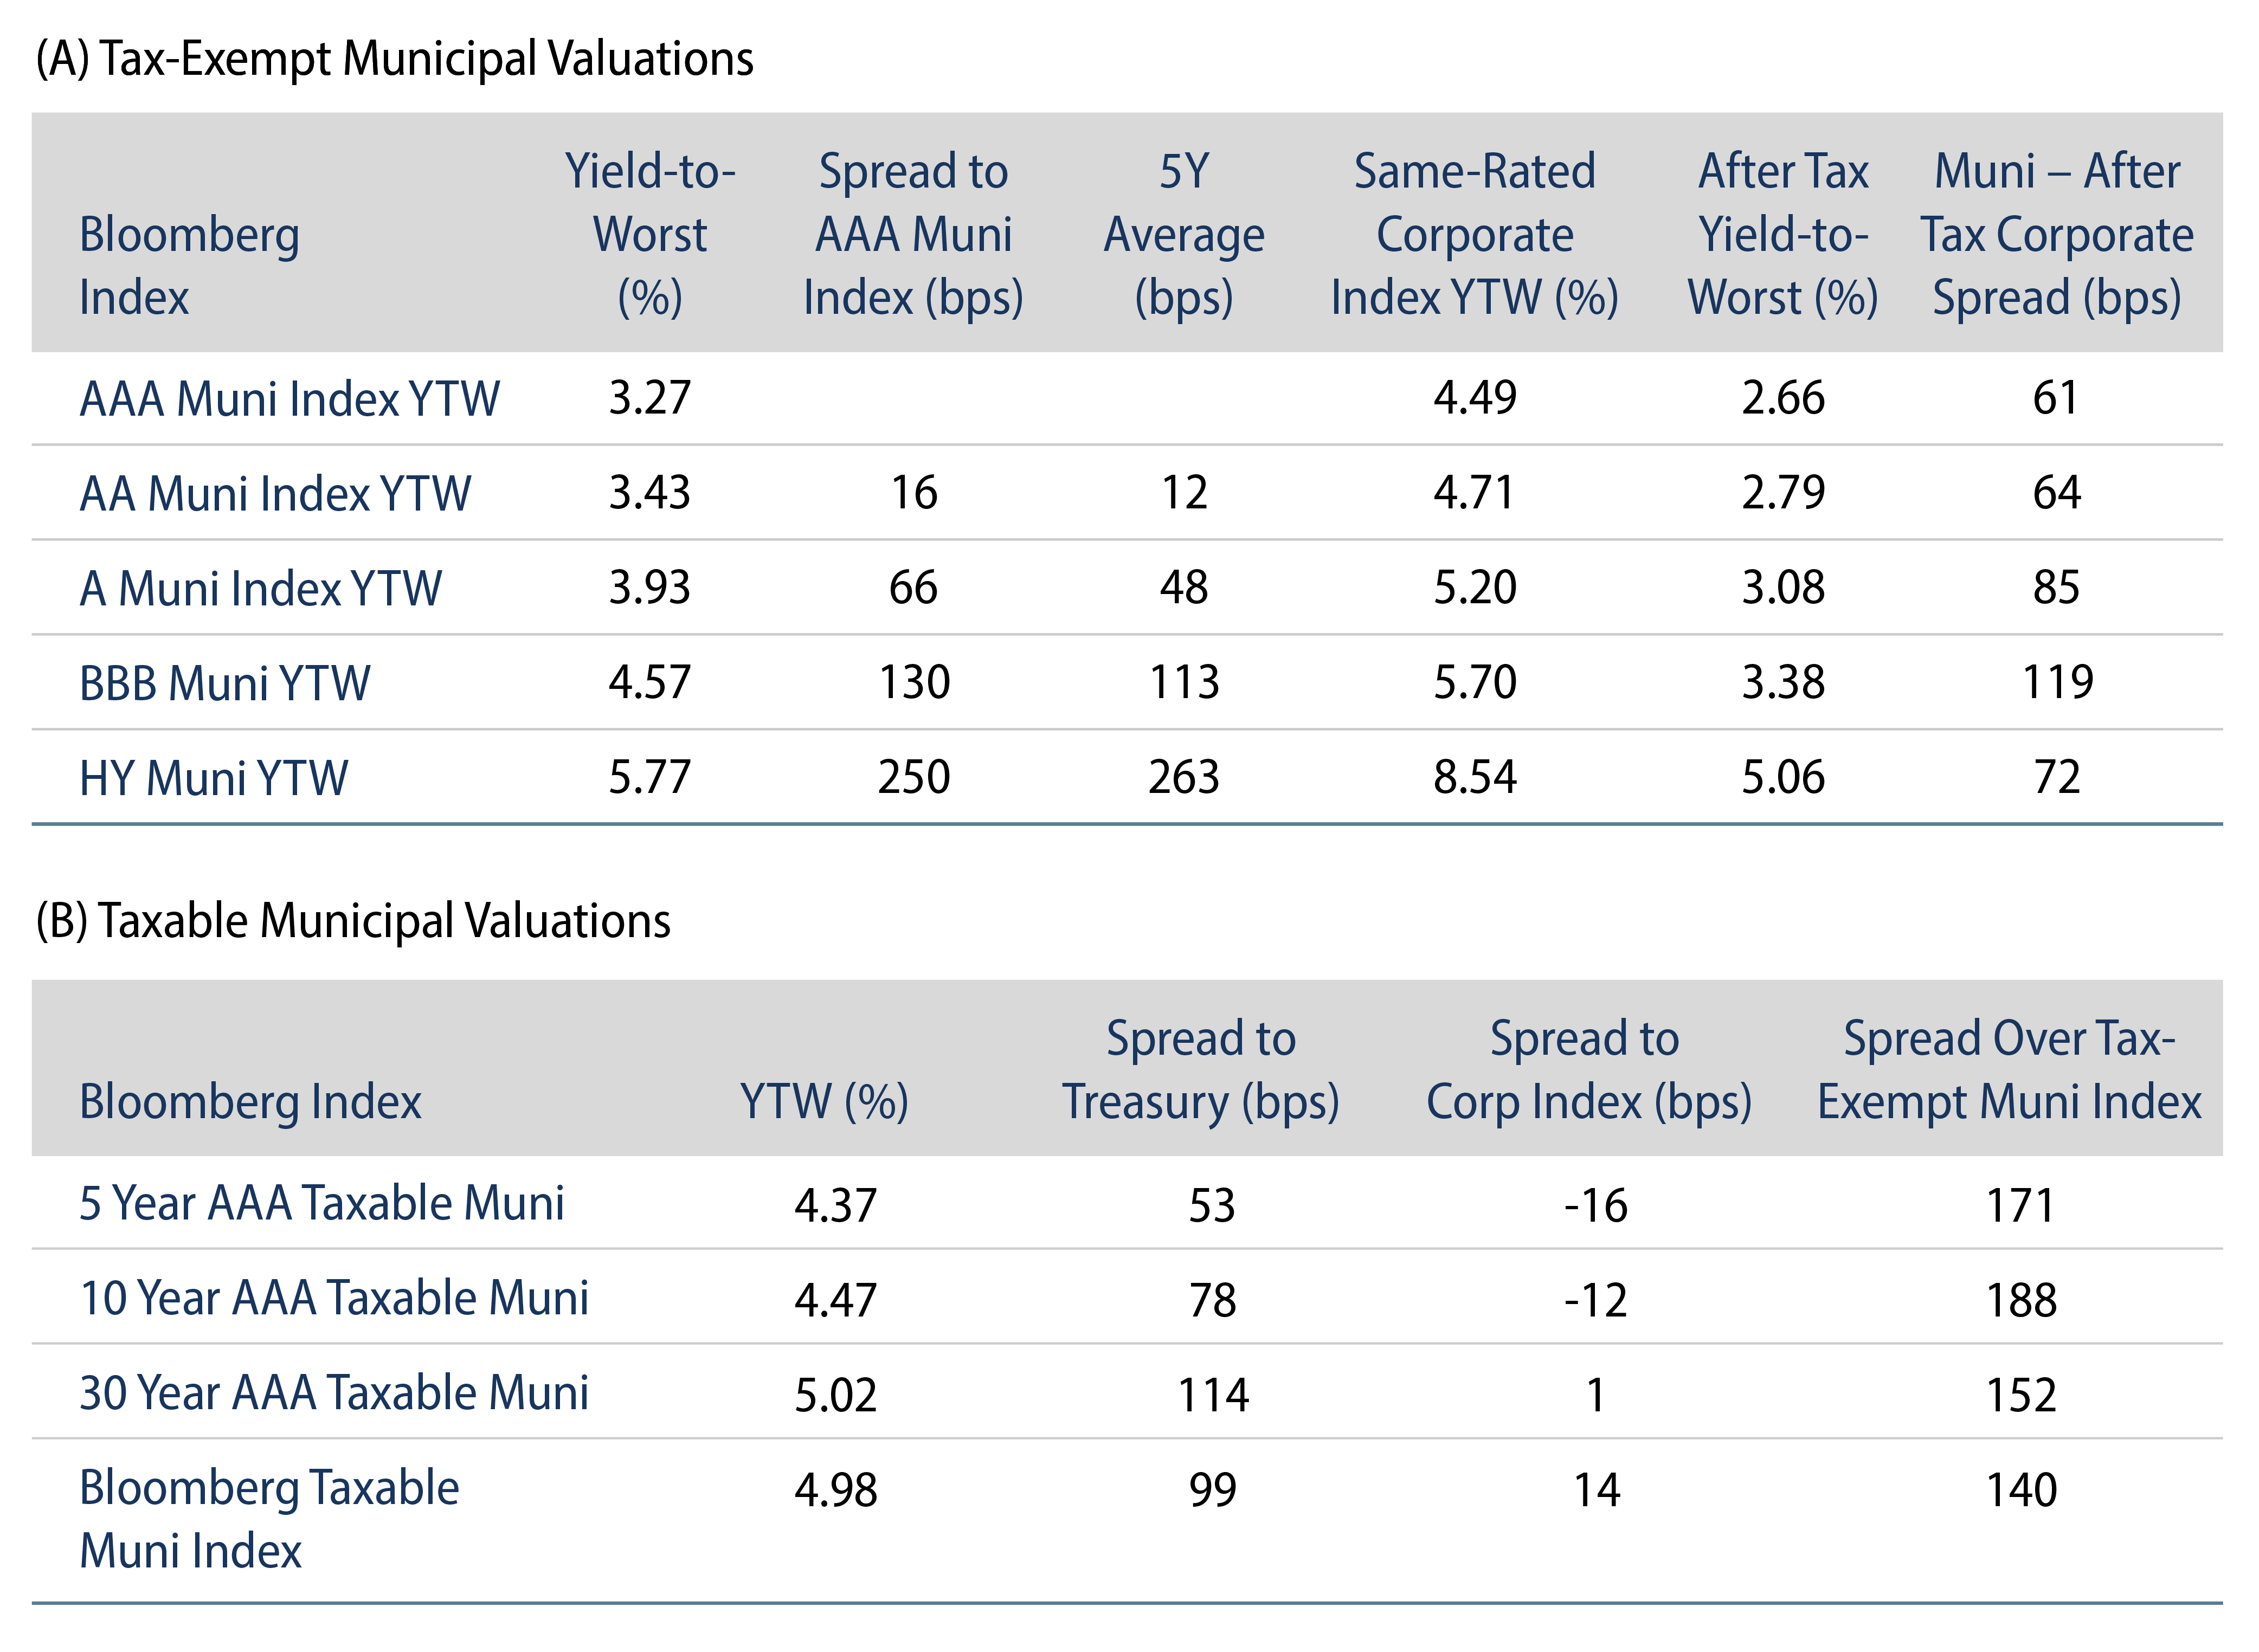
    From a valuation perspective, municipal spreads within the transportation sector have compressed since the height of pandemic concerns, and the market now appears to be highlighting limited pricing differentiation between these three major transportation segments despite the diverging state of demand. In this environment, Western Asset believes value can be captured at the issuer level, and prefers systems with diversified revenues that can benefit from unforeseen volatility rather than liens reliant on fare box revenues.

    Exhibit 3: Municipal Bond Yields and Index Returns
    Municipal Bond Yields and Index Returns
    Source: Bloomberg. As of 02 Jun 23. Select the image to expand the view.
    Exhibit 4: Tax-Exempt and Taxable Muni Valuations
    Tax-Exempt and Taxable Muni Valuations
    Source: Bloomberg. As of 02 Jun 23. Select the image to expand the view.
© Western Asset Management Company, LLC 2024. The information contained in these materials ("the materials") is intended for the exclusive use of the designated recipient ("the recipient"). This information is proprietary and confidential and may contain commercially sensitive information, and may not be copied, reproduced or republished, in whole or in part, without the prior written consent of Western Asset Management Company ("Western Asset").
Past performance does not predict future returns. These materials should not be deemed to be a prediction or projection of future performance. These materials are intended for investment professionals including professional clients, eligible counterparties, and qualified investors only.
These materials have been produced for illustrative and informational purposes only. These materials contain Western Asset's opinions and beliefs as of the date designated on the materials; these views are subject to change and may not reflect real-time market developments and investment views.
Third party data may be used throughout the materials, and this data is believed to be accurate to the best of Western Asset's knowledge at the time of publication, but cannot be guaranteed. These materials may also contain strategy or product awards or rankings from independent third parties or industry publications which are based on unbiased quantitative and/or qualitative information determined independently by each third party or publication. In some cases, Western Asset may subscribe to these third party's standard industry services or publications. These standard subscriptions and services are available to all asset managers and do not influence rankings or awards in any way.
Investment strategies or products discussed herein may involve a high degree of risk, including the loss of some or all capital. Investments in any products or strategies described in these materials may be volatile, and investors should have the financial ability and willingness to accept such risks.
Unless otherwise noted, investment performance contained in these materials is reflective of a strategy composite. All other strategy data and information included in these materials reflects a representative portfolio which is an account in the composite that Western Asset believes most closely reflects the current portfolio management style of the strategy. Performance is not a consideration in the selection of the representative portfolio. The characteristics of the representative portfolio shown may differ from other accounts in the composite. Information regarding the representative portfolio and the other accounts in the composite are available upon request. Statements in these materials should not be considered investment advice. References, either general or specific, to securities and/or issuers in the materials are for illustrative purposes only and are not intended to be, and should not be interpreted as, recommendation to purchase or sell such securities. Employees and/or clients of Western Asset may have a position in the securities or issuers mentioned.
These materials are not intended to provide, and should not be relied on for, accounting, legal, tax, investment or other advice. The recipient should consult its own counsel, accountant, investment, tax, and any other advisers for this advice, including economic risks and merits, related to making an investment with Western Asset. The recipient is responsible for observing the applicable laws and regulations of their country of residence.
Founded in 1971, Western Asset Management Company is a global fixed-income investment manager with offices in Pasadena, New York, London, Singapore, Tokyo, Melbourne, São Paulo, Hong Kong, and Zürich. Western Asset is a wholly owned subsidiary of Franklin Resources, Inc. but operates autonomously. Western Asset is comprised of six legal entities across the globe, each with distinct regional registrations: Western Asset Management Company, LLC, a registered Investment Adviser with the Securities and Exchange Commission; Western Asset Management Company Distribuidora de Títulos e Valores Mobiliários Limitada is authorized and regulated by Comissão de Valores Mobiliários and Brazilian Central Bank; Western Asset Management Company Pty Ltd ABN 41 117 767 923 is the holder of the Australian Financial Services License 303160; Western Asset Management Company Pte. Ltd. Co. Reg. No. 200007692R is a holder of a Capital Markets Services License for fund management and regulated by the Monetary Authority of Singapore; Western Asset Management Company Ltd, a registered Financial Instruments Business Operator and regulated by the Financial Services Agency of Japan; and Western Asset Management Company Limited is authorised and regulated by the Financial Conduct Authority ("FCA") (FRN 145930). This communication is intended for distribution to Professional Clients only if deemed to be a financial promotion in the UK as defined by the FCA. This communication may also be intended for certain EEA countries where Western Asset has been granted permission to do so. For the current list of the approved EEA countries please contact Western Asset at +44 (0)20 7422 3000.