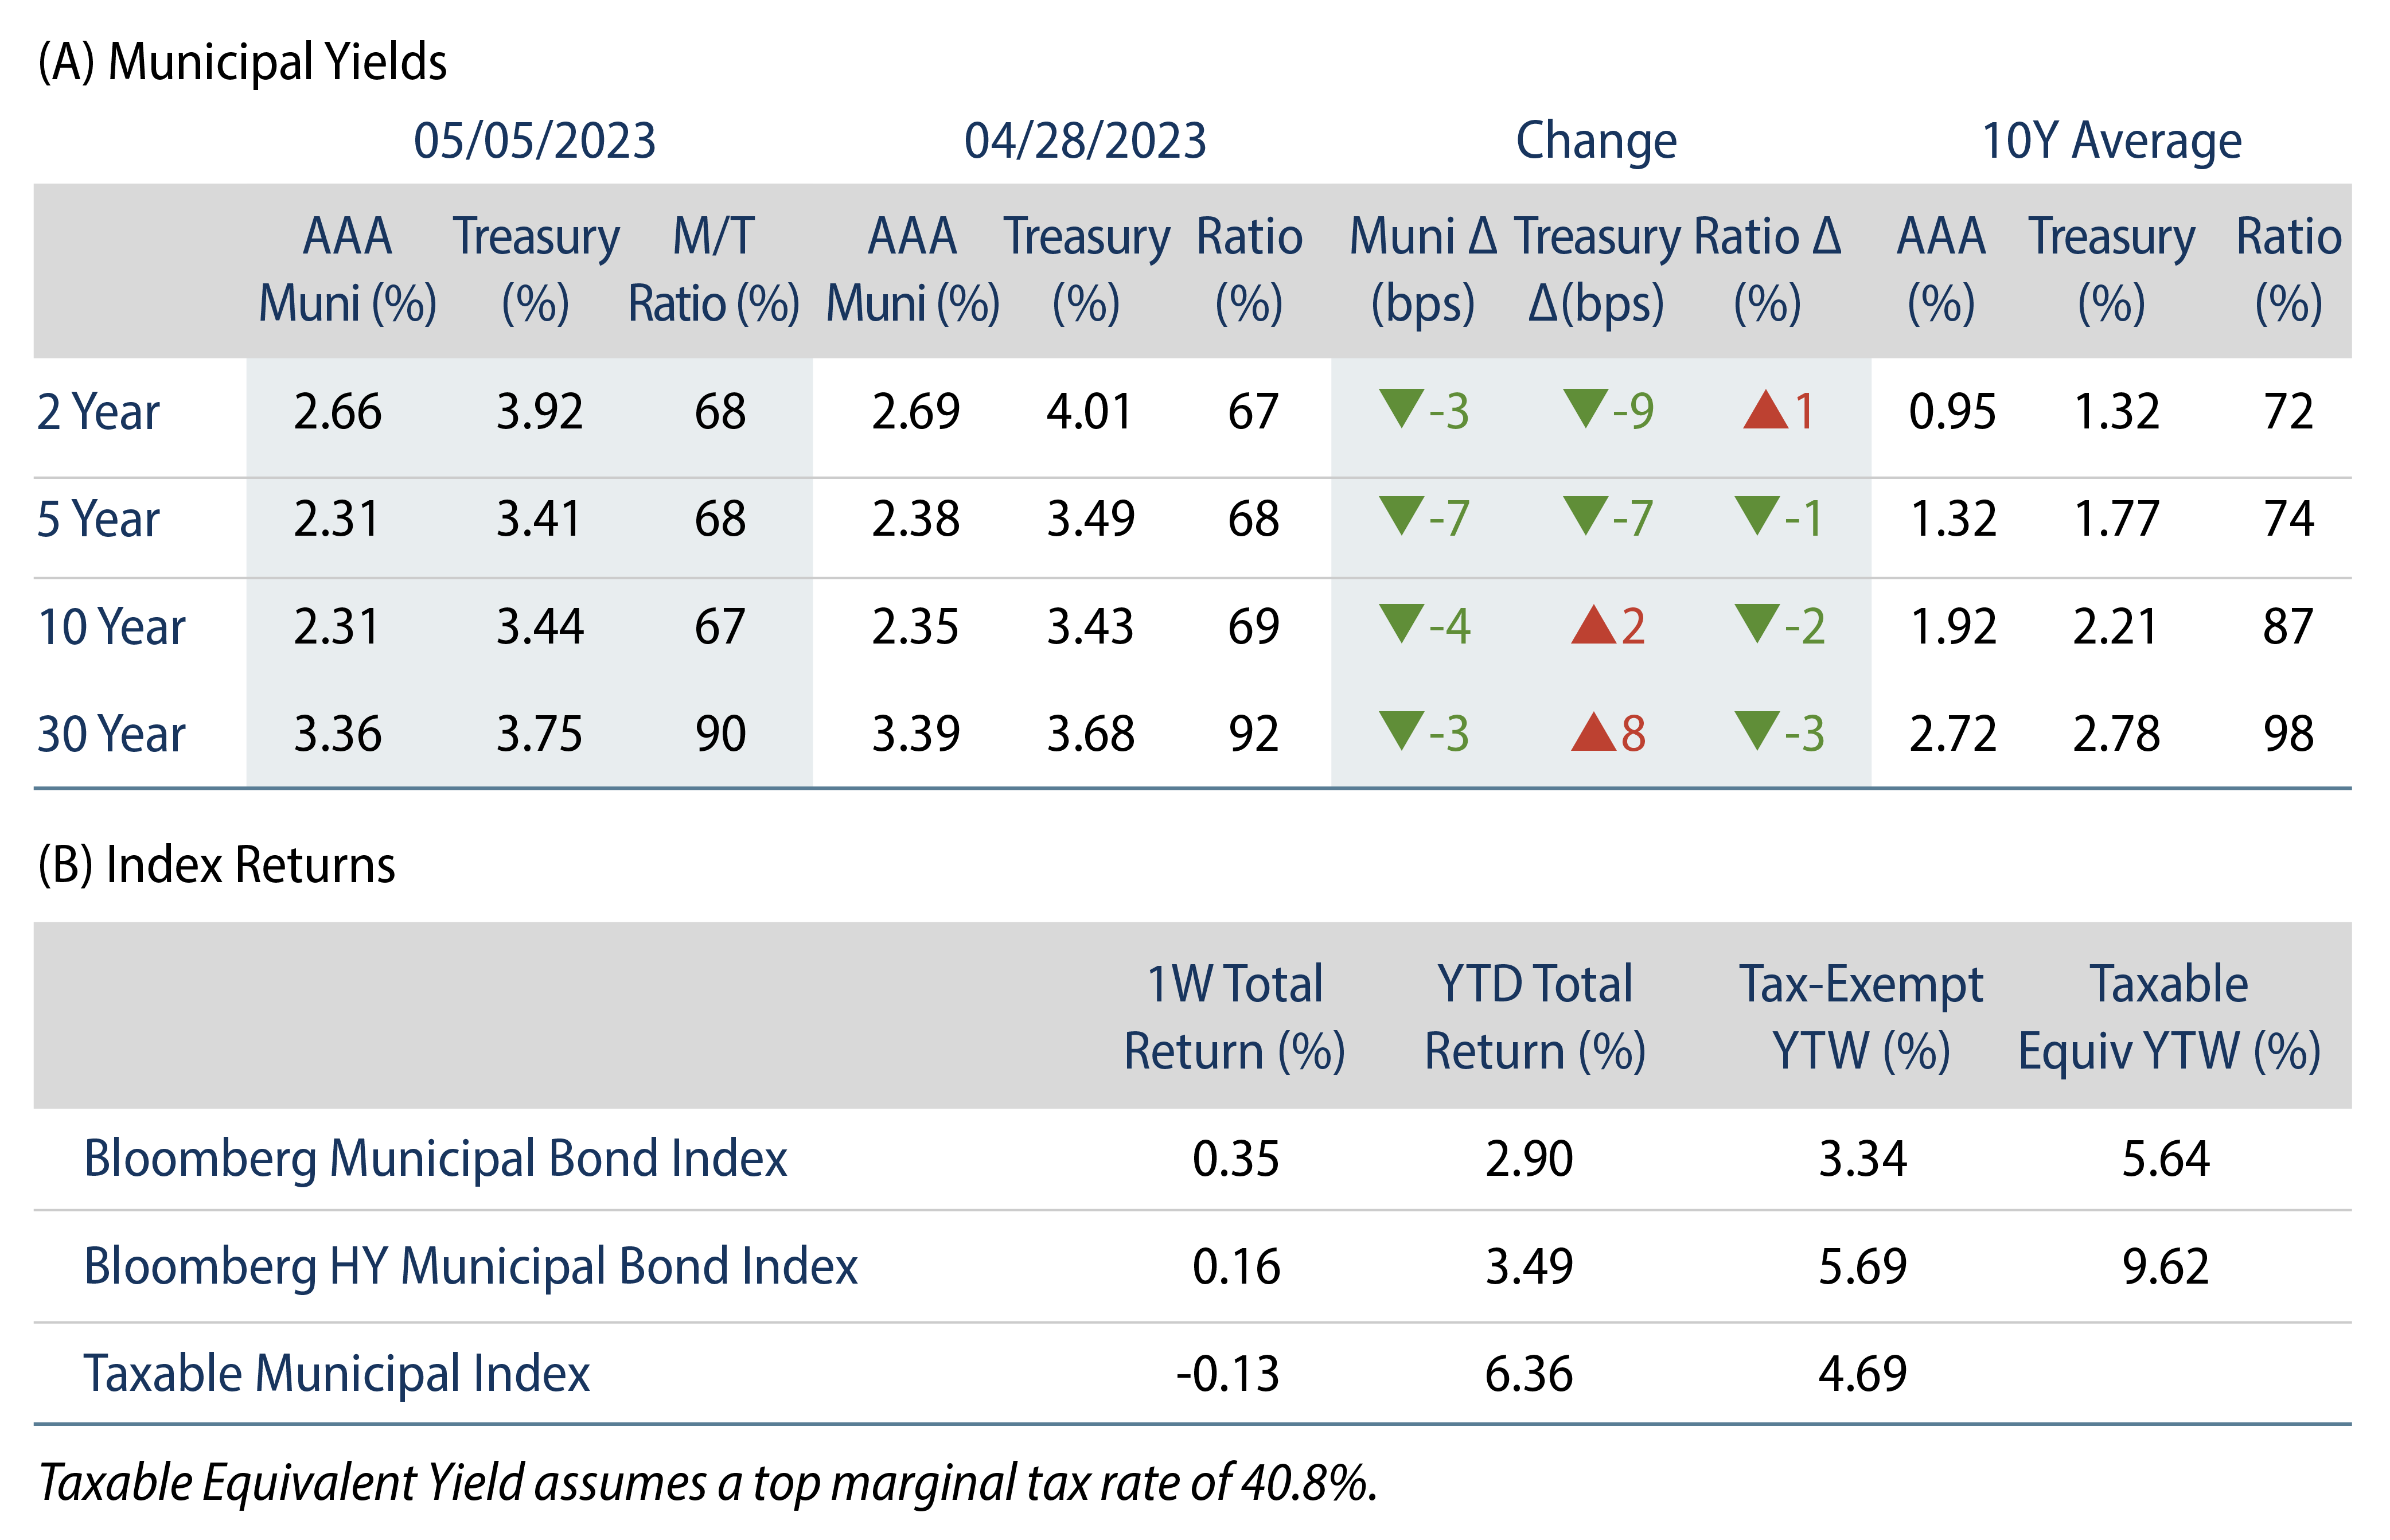
Municipals Posted Positive Returns Last Week
Municipals posted positive returns last week as high-grade yields moved lower across the yield curve. Munis generally outperformed Treasuries, as the curve steepened amid the confluence of banking sector stress, the Federal Reserve increasing the target fed funds rate by 25 bps but signaling a pause and stronger than expected payroll data. Municipal fund outflows challenged technicals, but were offset by SMA demand and lighter supply conditions. The Bloomberg Municipal Index returned 0.35% during the week, the High Yield Muni Index returned 0.16% and the Taxable Muni Index returned -0.13%. With tax season behind us, this week we highlight recently released IRS income data from the 2020 tax year.
Fund Outflows Continue to Challenge Technicals
Fund Flows: During the week ending May 3, weekly reporting municipal mutual funds recorded $846 million of net outflows, according to Lipper. Long-term funds recorded $443 million of outflows, high-yield funds recorded $344 million of outflows and intermediate funds recorded $149 million of outflows. This week’s outflows bring year-to-date (YTD) net outflows to $5.8 billion.
Supply: The muni market recorded $7 billion of new-issue volume last week, down 18% from the prior week. YTD issuance of $114 billion is down 17% year-over year (YoY), with tax-exempt issuance down 11% YoY and taxable issuance down 45% YoY. This week’s calendar is expected to increase to $8 billion. Large transactions include $1.1 billion New York State Dormitory Authority and $616 million Virginia College Building Authority transactions.
This Week in Munis: Pandemic Wealth Flight
Recently released IRS income data from the 2020 tax year includes a view into the early stage pandemic migration trends across income cohorts. Despite pandemic concerns in 2020, US adjusted gross income (AGI) increased 5.1% to $12.5 trillion, aligning with the trend of strong tax collections observed by states in recent years. The top five states (CA, TX, NY, FL, IL) comprised 40% of AGI in 2020, with California leading the way at $1.8 trillion, 14% of total AGI.
With flight away from urban areas taking hold amid increasing “work from home” trends, the states of Idaho, South Dakota and Utah recorded the highest AGI growth rates in 2020. Florida ranked fourth at 9.9% growth in AGI, despite just 5.6% growth in the number of tax filers. Notable larger and higher-tax states of New York and California, often in the headlines for population growth underperformance, observed AGI growth at or above their respective five-year annual growth rates during the year.
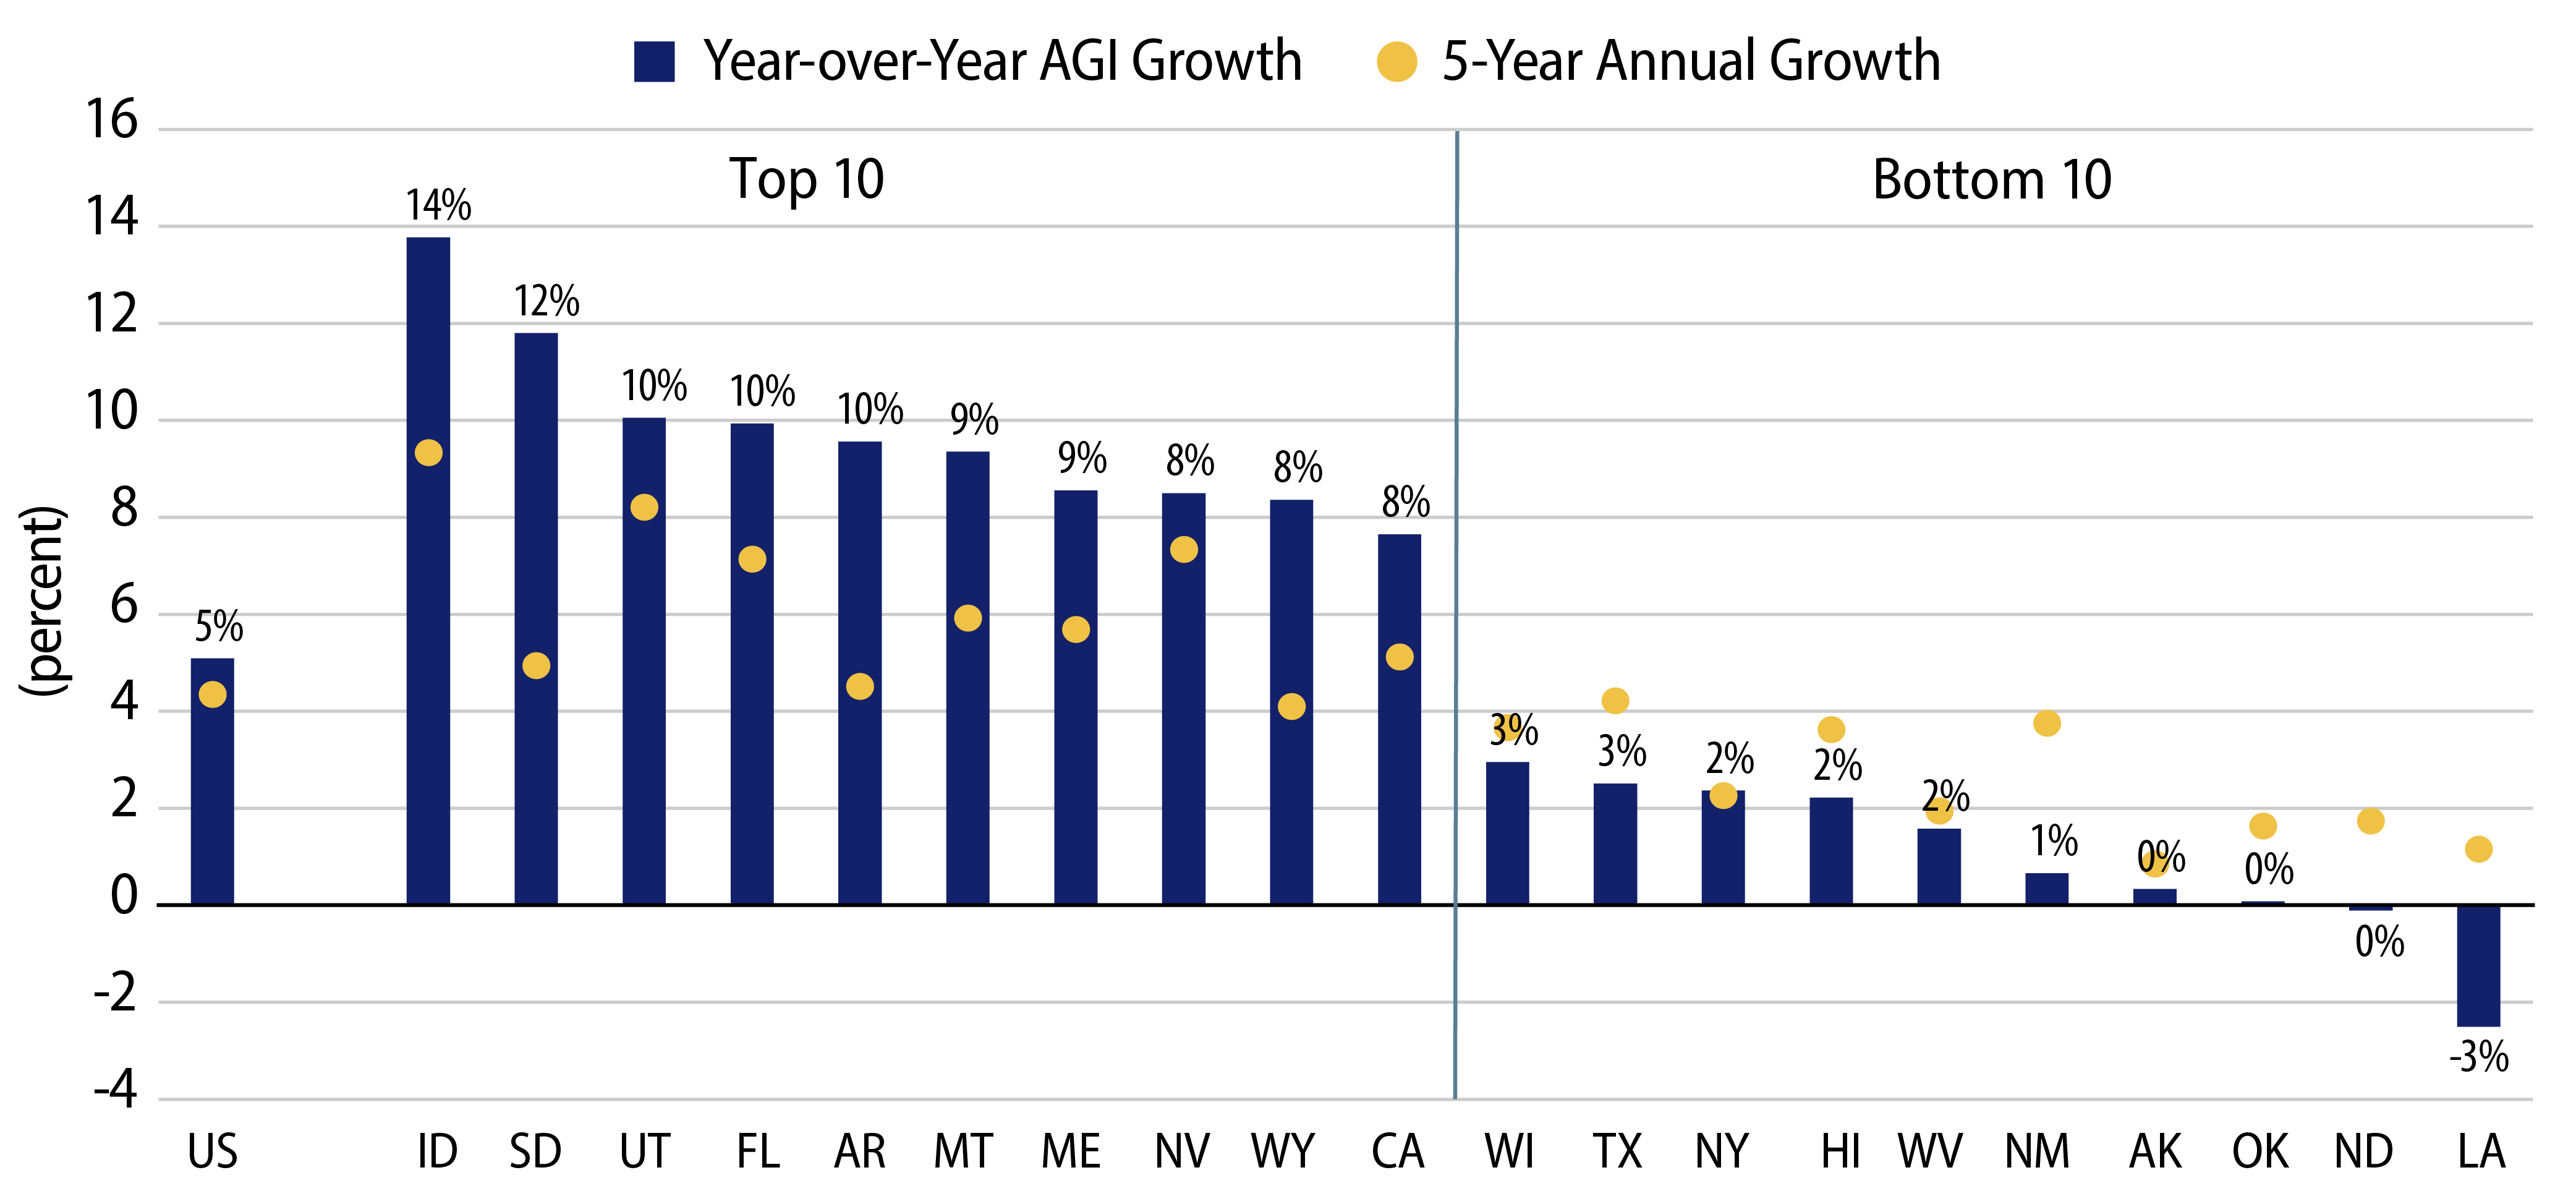
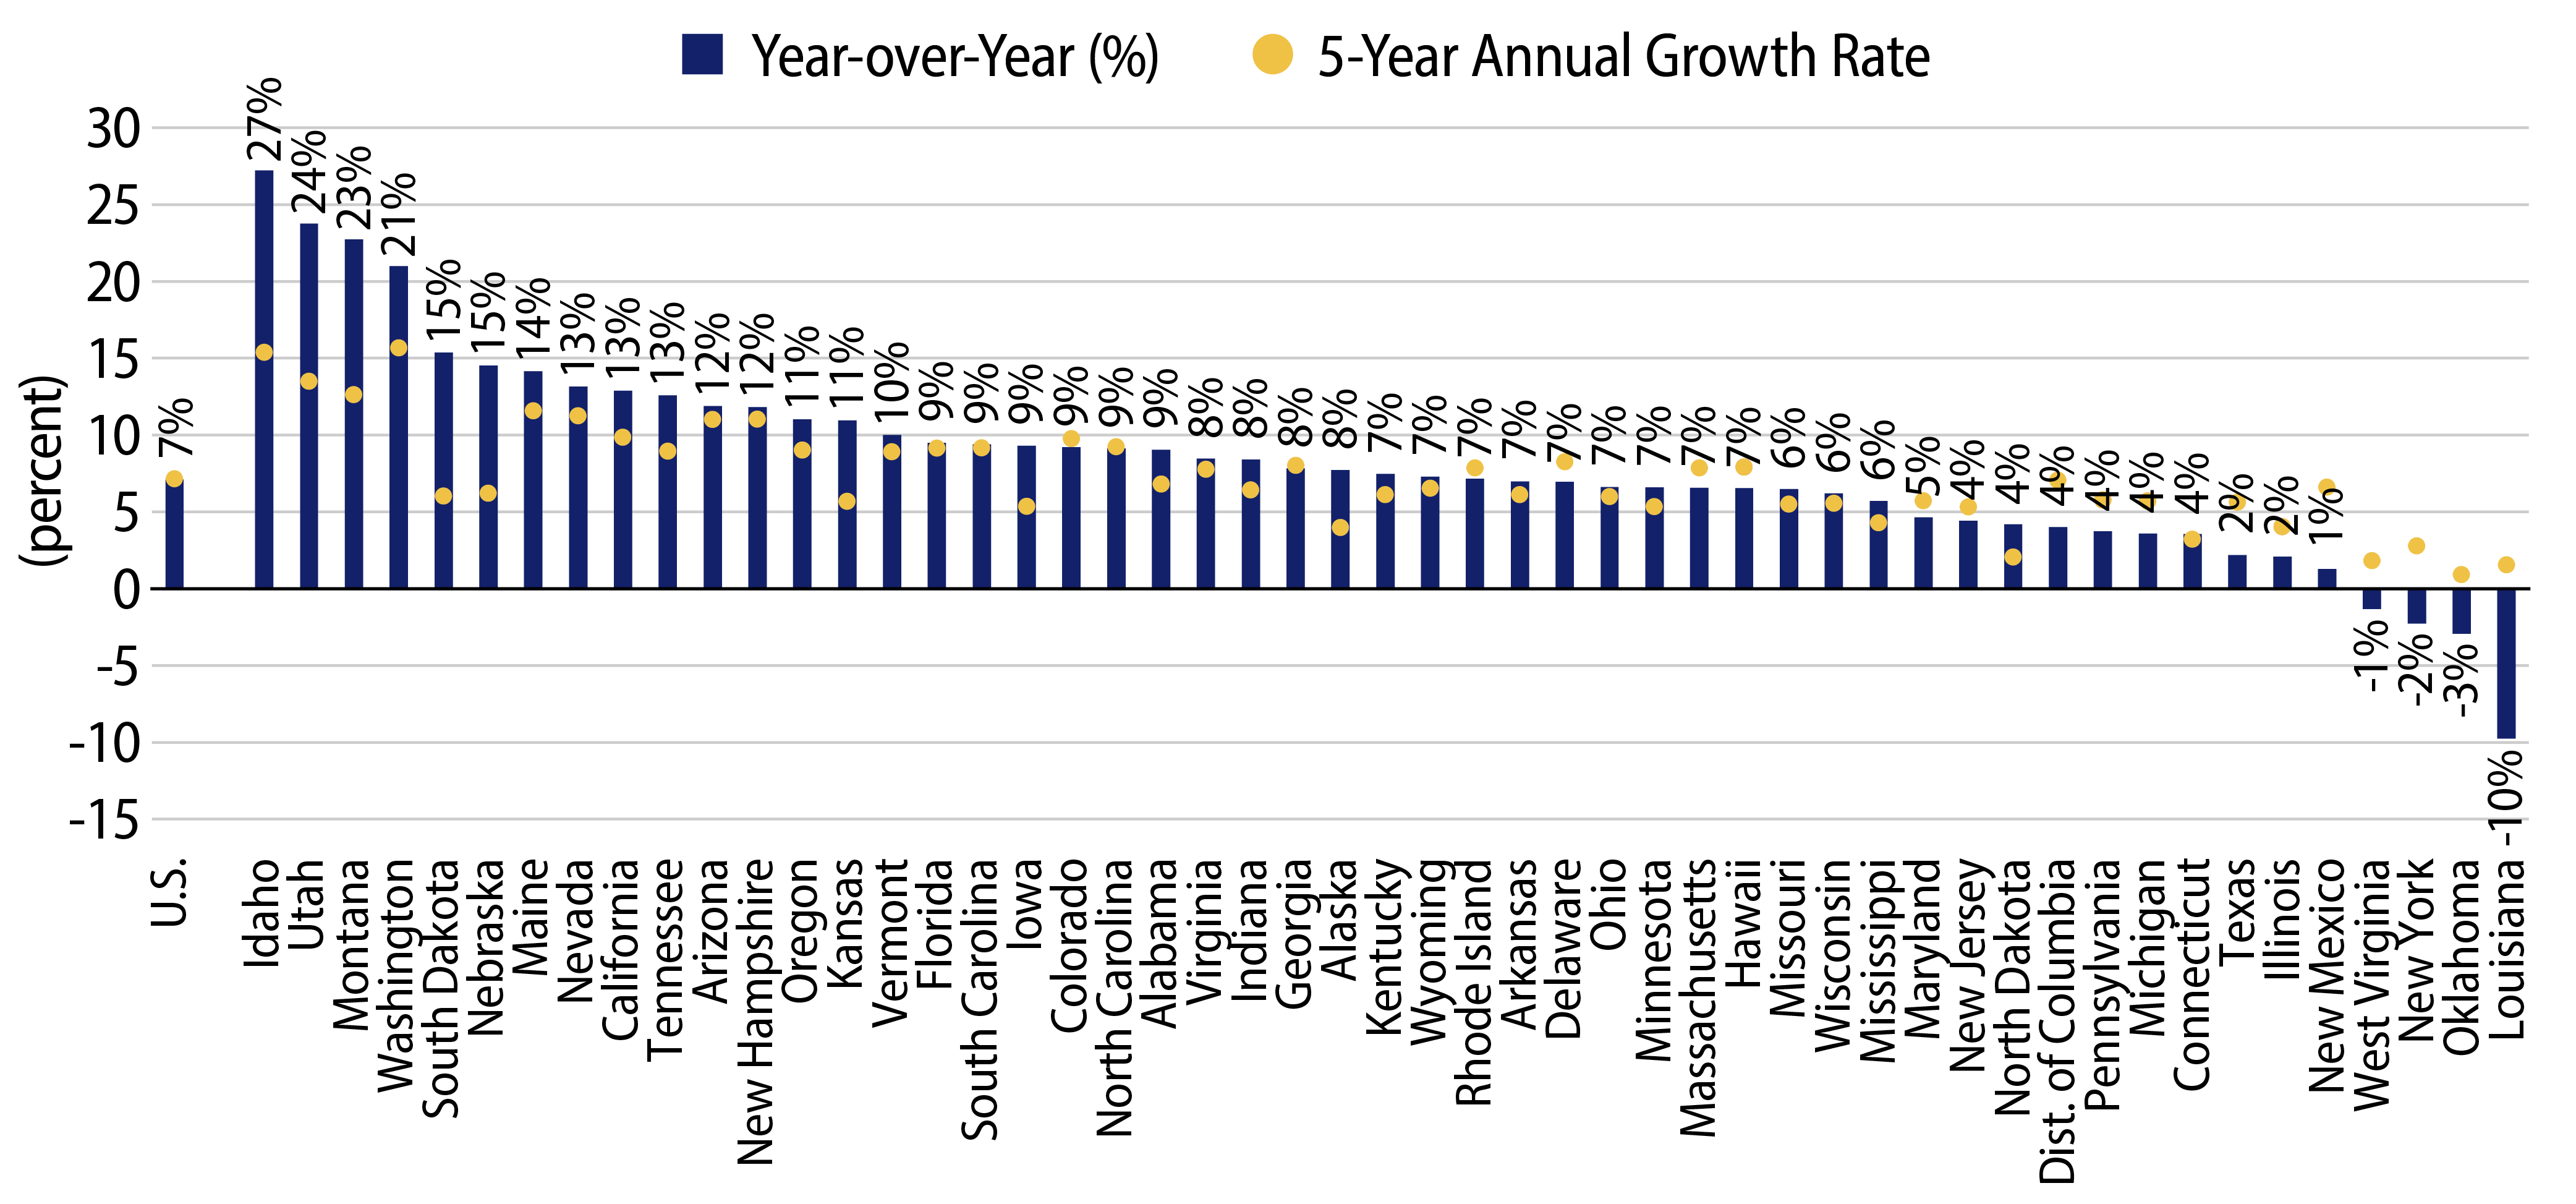
The wealthiest taxpayers (those reporting income over $500,000 per year) comprised just 1% of total returns but accounted for over 23% of total AGI. The concentration of these wealthy filers was in five states, with CA, NY, TX, FL and NJ accounting for 46% of AGI from top taxpayers. In 2020, Idaho, Utah and Montana led the growth of wealthiest filers, while New York, Oklahoma and Louisiana lagged during the year. Despite elevated outmigration trends from California, the state recorded a 13% uptick in the number of wealthier filers, above the five-year growth trend. It’s notable that Texas, which has experienced strong overall population growth, ranked in the bottom 10 on the list of states with the highest growth of the wealthiest tax filers.
Overall income trends and income trends from high earners can be just as significant to municipal credit quality as headline population trends. Concerns of credit deterioration due to population flight from higher tax states can be offset by wealthy taxpayers. As highlighted in our April note, we recognize that YoY population trends during the pandemic period will be volatile, and anticipate more sustainable color will be better reflected in tax year 2022 as return to office factors could be better reflected in the data.