skip navigation
Blog

Stay up to date on timely topics and market events. Subscribe to our Blog now.

MARKETS
April 11, 2023

Weekly Municipal Monitor—Long-Term Trends and Pandemic Flight

By Sam Weitzman, Connor O’Malley, CFA

Stay up to date on timely topics and market events. Subscribe to our Blog now.

Municipals Rallied Last Week

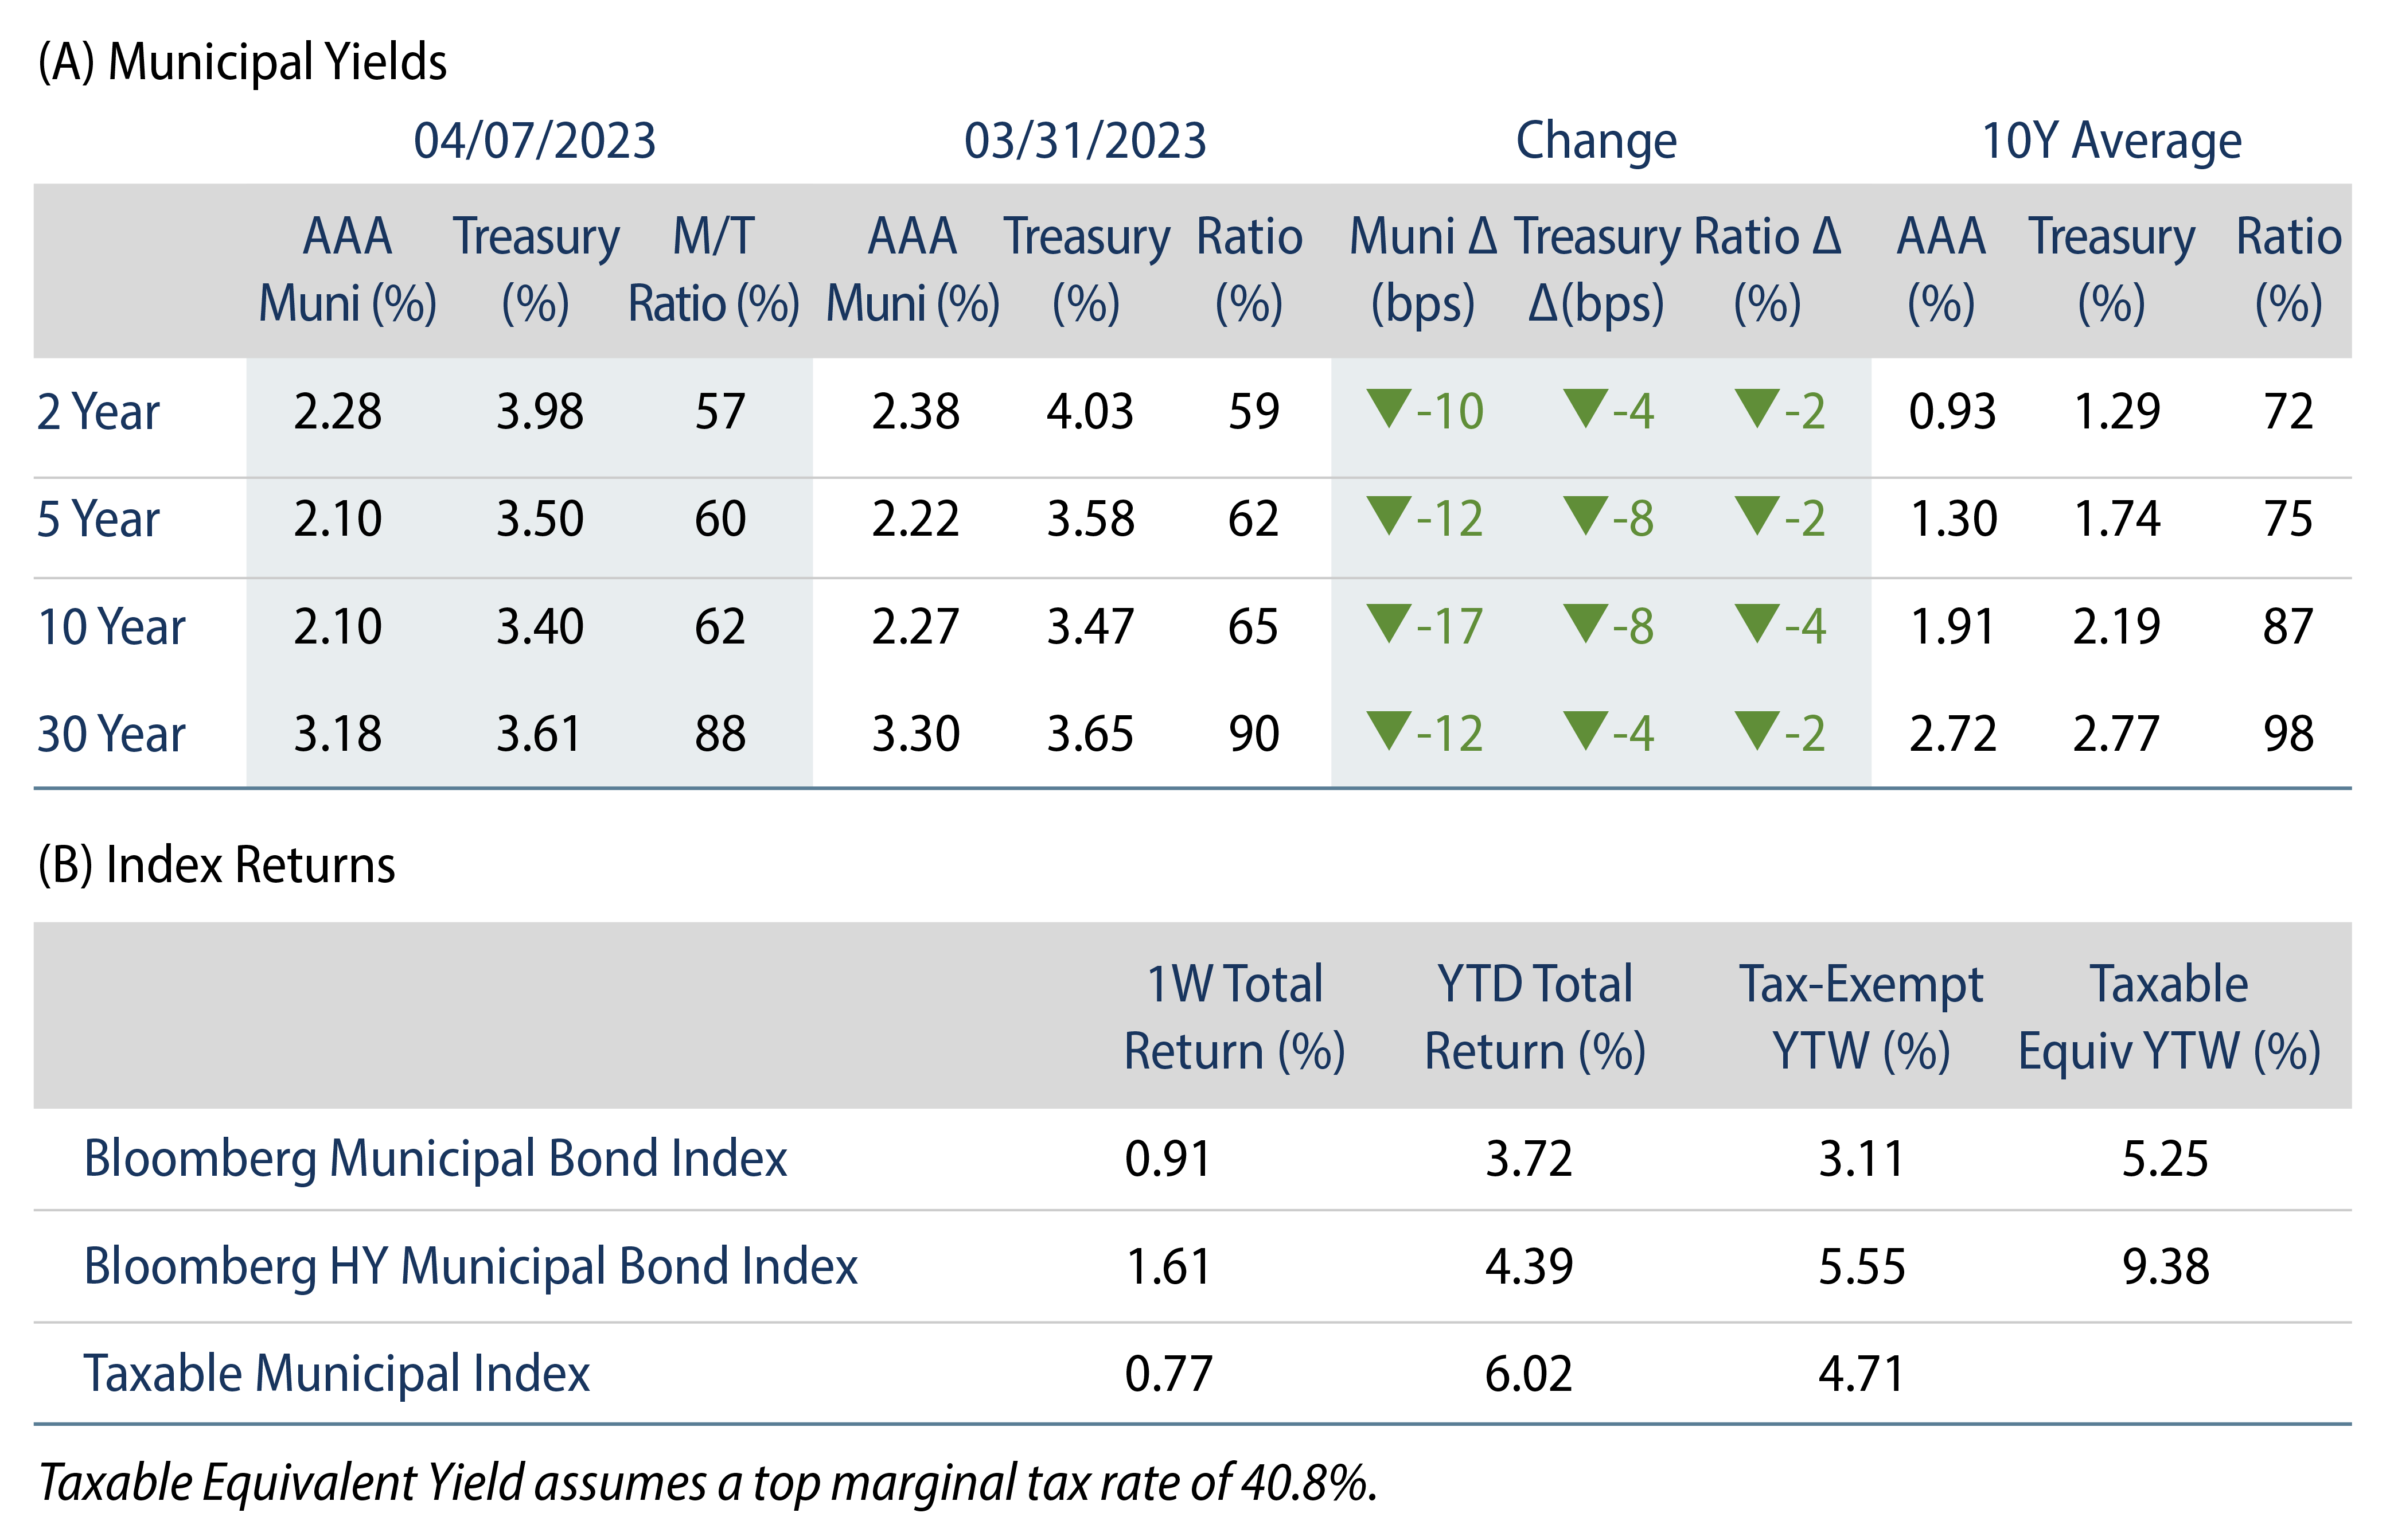
Municipals posted positive returns for a fourth consecutive week. Munis outperformed Treasuries, which declined due to lower than expected job openings, March jobless claims coming in worse than expected and a slowdown in average hourly earnings. The Bloomberg Municipal Index returned 0.91% during the week, the High Yield Muni Index returned 1.61% and the Taxable Muni Index returned -0.77%. This week we highlight Census Bureau population estimates that were released at the end of last month.

Market Technicals Were Steady With Limited Supply, Modest Outflows

Fund Flows: During the week ending April 5, weekly reporting municipal mutual funds recorded $92 million of net outflows, according to Lipper. Long-term funds recorded $399 million of inflows, high-yield funds recorded $148 million of inflows and intermediate funds recorded $200 million of outflows. This week’s outflows extend year-to-date (YTD) net outflows to $1.6 billion.

Supply: The muni market recorded $8 billion of new-issue volume last week, up 41% from the prior week. YTD issuance of $83 billion is down 17% year-over year (YoY), with tax-exempt issuance down 14% YoY and taxable issuance down 34% YoY. This week’s calendar is expected to decrease to $6 billion. Large transactions include $467 million State Public Works Board of the State of California and $456 million Black Belt Energy Gas District transactions.

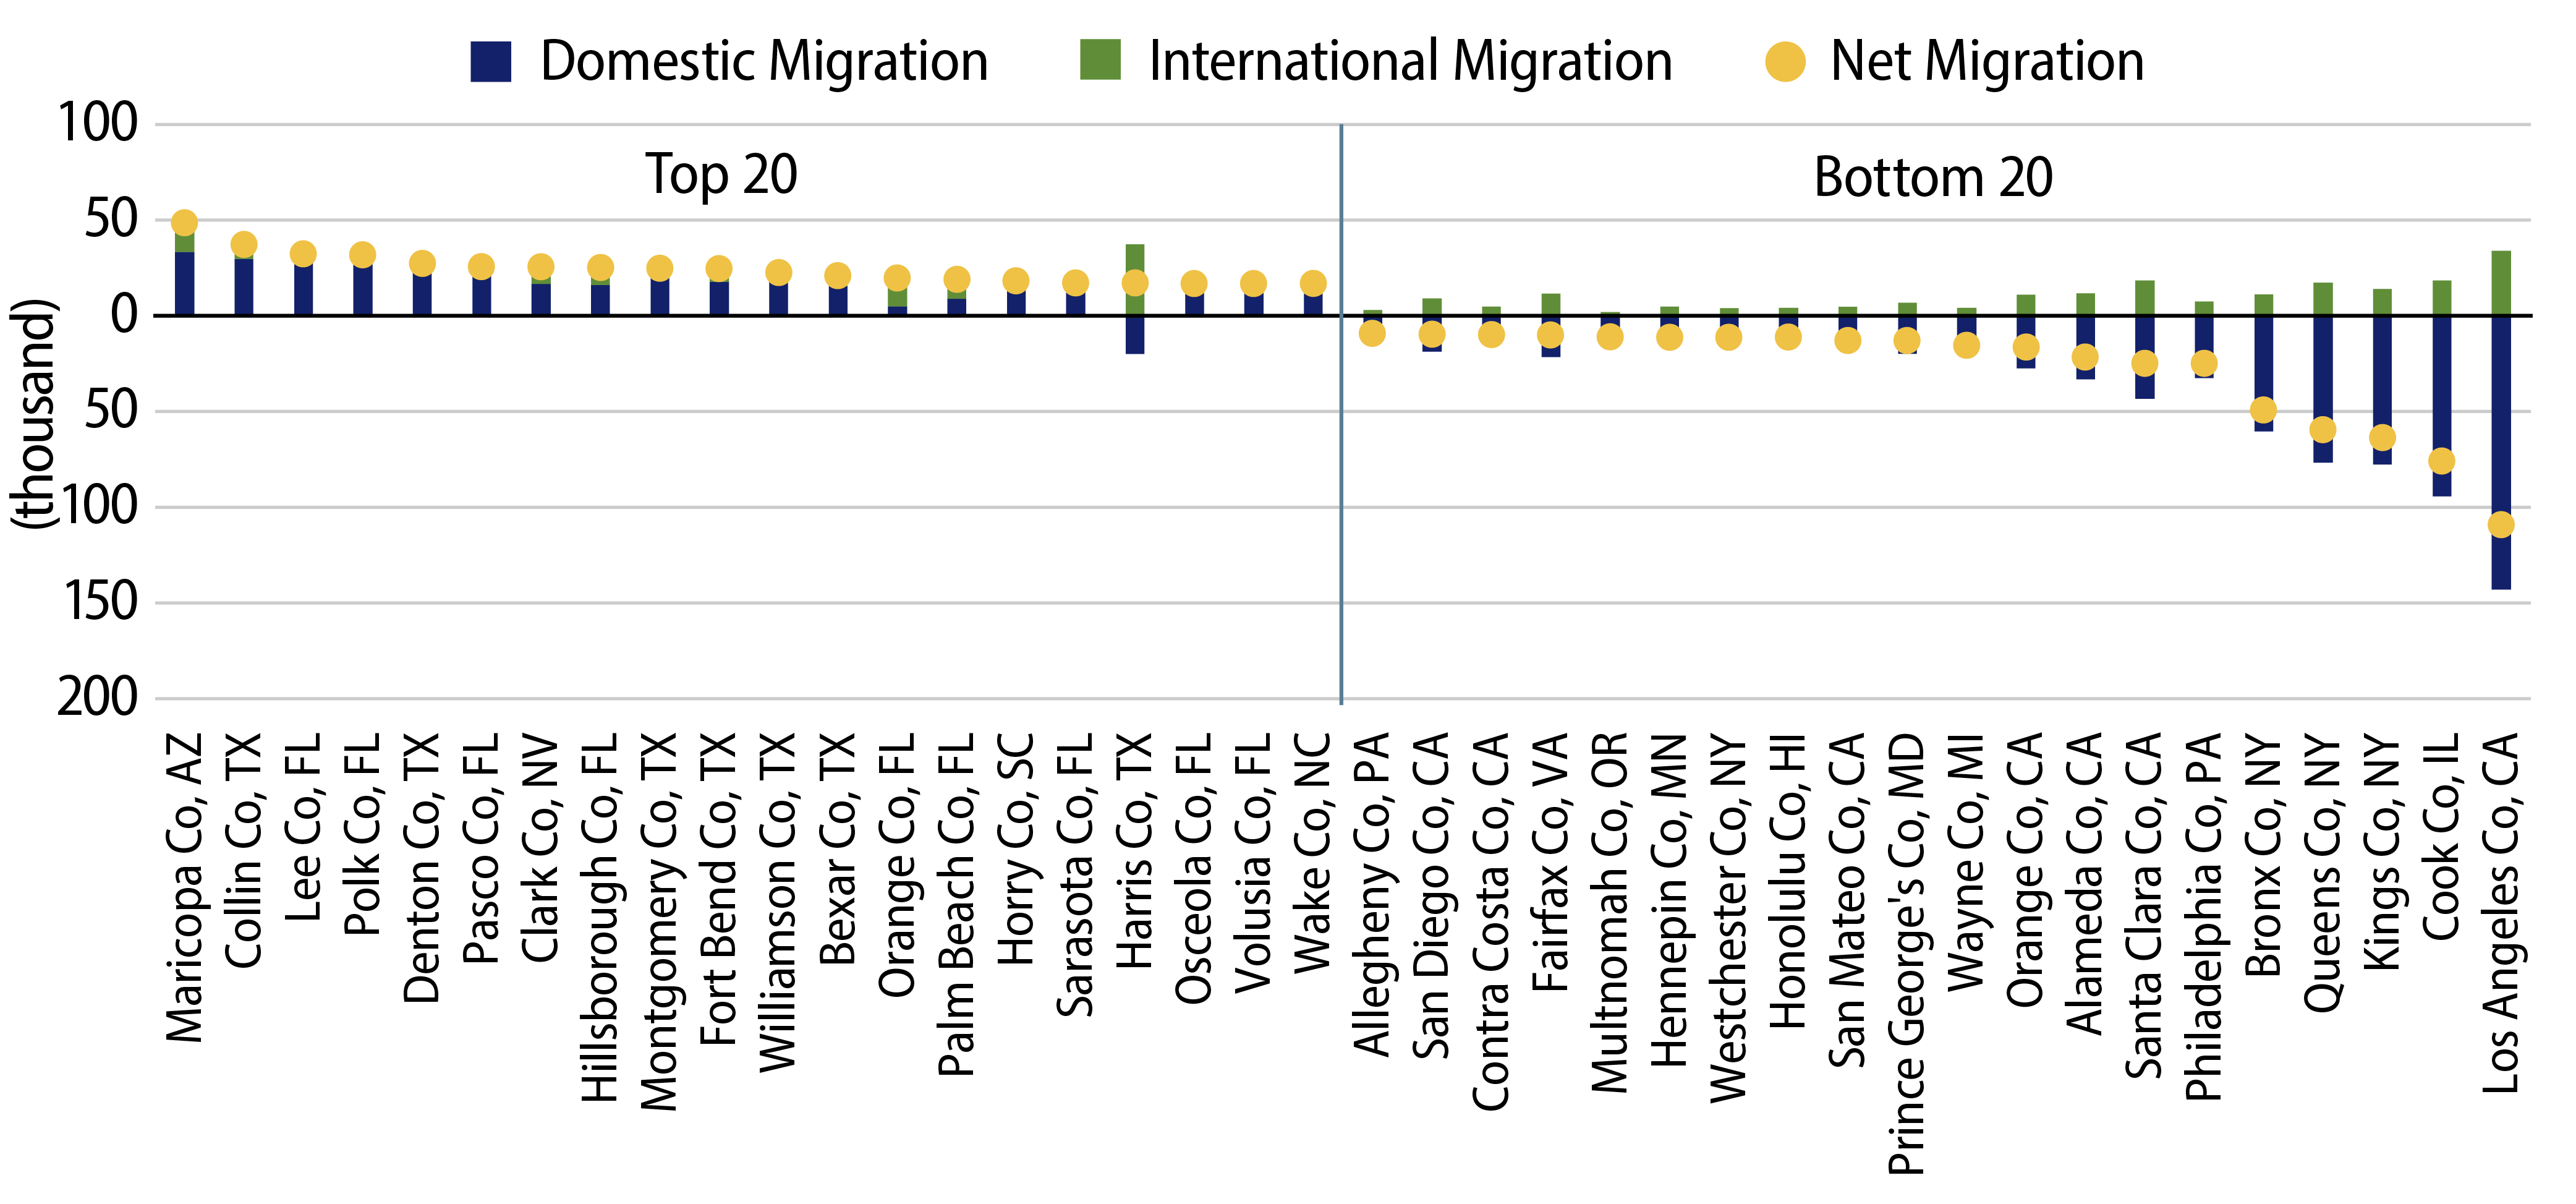
This Week in Munis: 2022 Population Data Underscores Long-Term Trends and Pandemic Flight

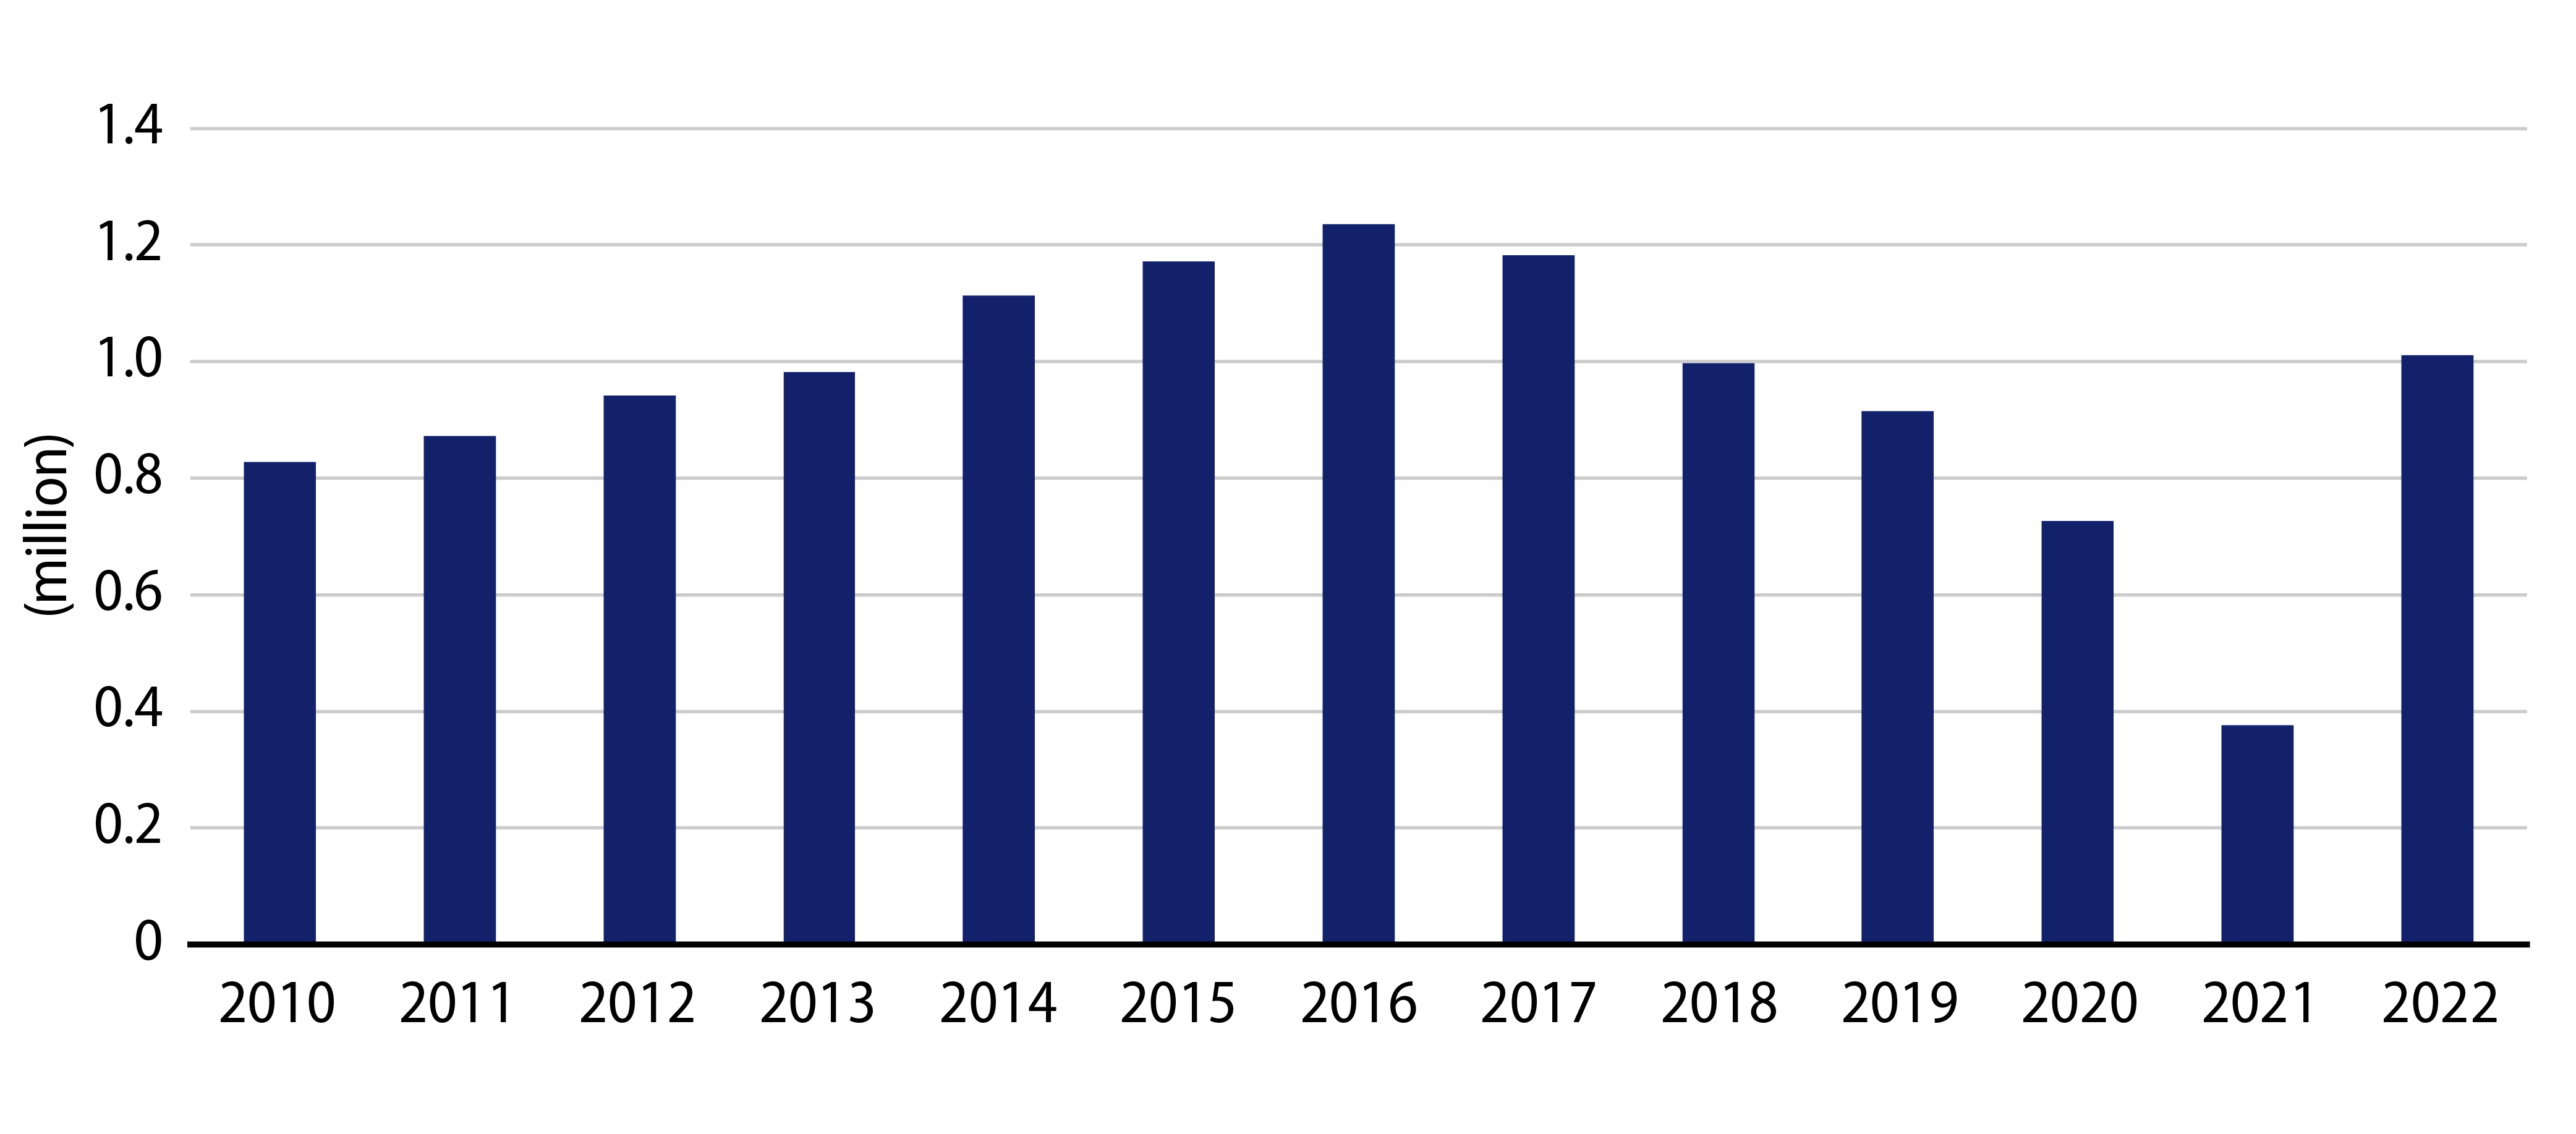
The Census Bureau released its July 2022 population estimates at the end of March. Population trends help inform the potential growth or decline of a municipality tax base, a key component of municipal credit quality. The state and county data released highlights a continuation of the long-term trend to the southeast and the northwest US. The data also reflects a pick-up in international migration, which has approached pre-pandemic highs and offset domestic outmigration pressures in certain regions.

Exhibit 1: International Net Migration
Explore International Net Migration
Source: US Census Bureau (data released March 2023). As of 01 Jul 22. Select the image to expand the view.

At the state level, Florida, Idaho, South Carolina and Texas observed the percentage population YoY gains of 1.9%, 1.8%, 1.7% and 1.6%, respectively. These gains were at the expense of New York and Illinois, which declined 0.8% and 0.9% due to elevated net domestic outmigration, potentially reflecting a demographic flight away from states with a higher cost of living.

Exhibit 2: 2022 Net Migration by State
Explore 2022 Net Migration by State
Source: US Census Bureau (data released March 2023). As of 01 Jul 22. Select the image to expand the view.

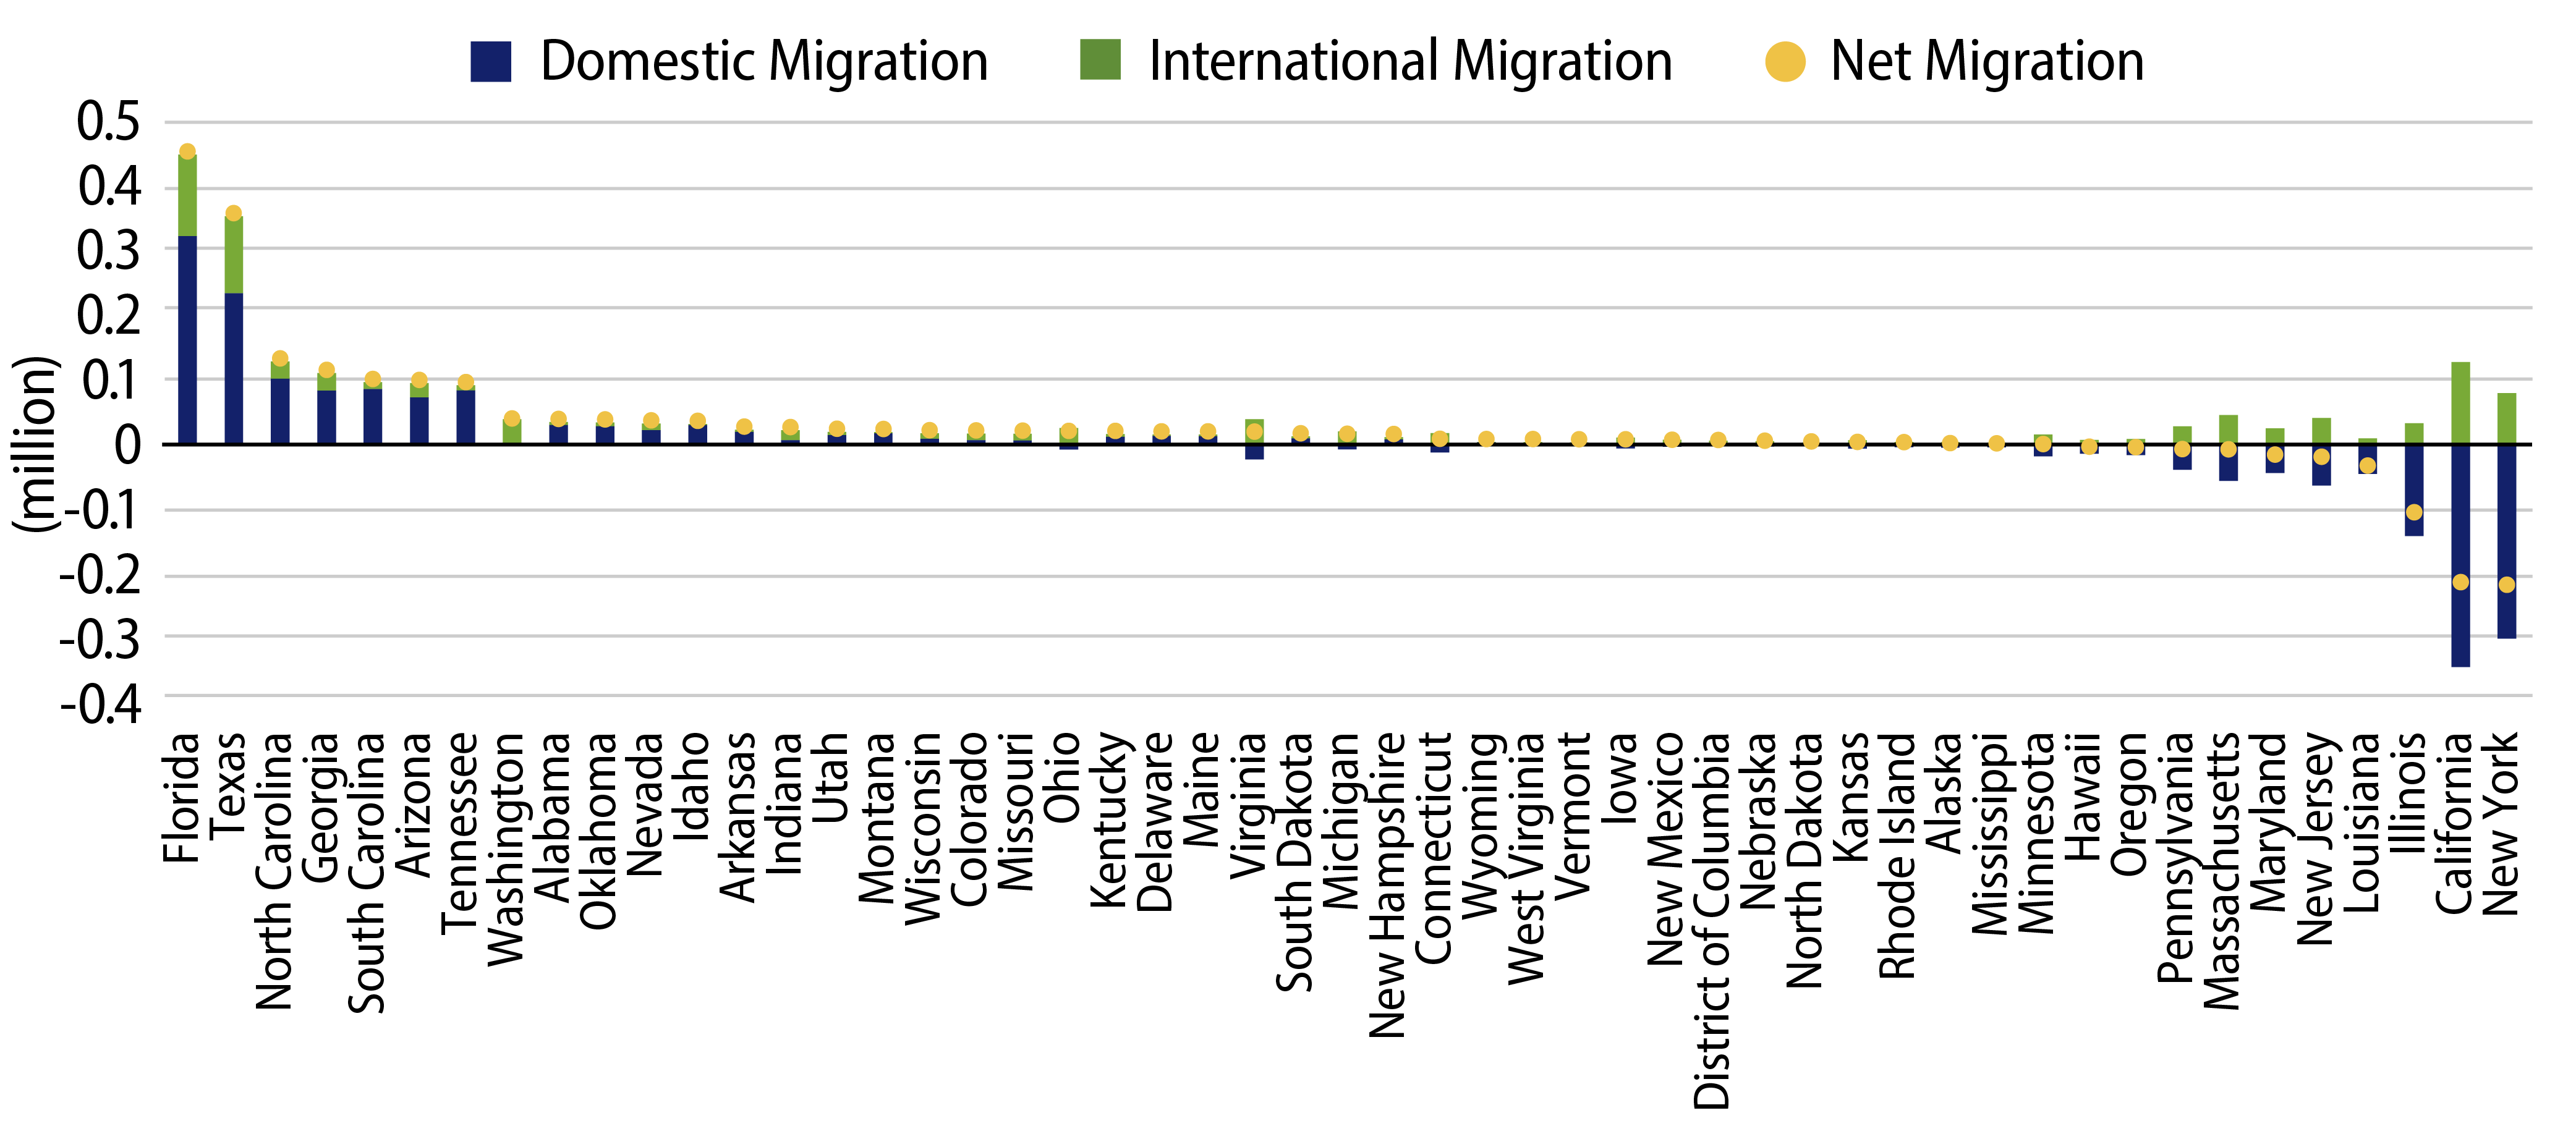
At the county level, Maricopa County, AZ, was the largest beneficiary of net migration in 2022, as the county garnered an estimated 49,000 new residents. Meanwhile, 16 counties in Florida and Texas rounded out the top 20 counties with the highest number of new residents. Los Angeles, CA, Cook County, IL (home of Chicago), and outer boroughs of New York recorded the largest levels of outmigration during the year through July 2022. While the New York, Chicago and Los Angeles metropolitan areas have been challenged by net outmigration in recent years, these tax bases continue to be supported by wealth levels that are well in excess of national averages.

Exhibit 3: 2022 Net Migration (Top 20 and Bottom 20 Counties)
Explore 2022 Net Migration (Top 20 and Bottom 20 Counties)
Source: US Census Bureau (data released March 2023). As of 01 Jul 22. Select the image to expand the view.

While this 2022 data provides insight into some of the population movement toward the tail end of the pandemic, we recognize that the YoY population trends during the pandemic have been quite volatile. We expect next year’s population figure to deliver more credible color on longer-term trends as metropolitan economies continue to reopen and more corporations institute return-to-office policies.

Exhibit 4: Municipal Bond Yields and Index Returns
Explore Municipal Bond Yields and Index Returns
Source: Bloomberg. As of 07 Apr 23. Select the image to expand the view.
Exhibit 5: Tax-Exempt and Taxable Muni Valuations
Explore Tax-Exempt and Taxable Muni Valuations
Source: Bloomberg. As of 07 Apr 23. Select the image to expand the view.
© Western Asset Management Company, LLC 2024. The information contained in these materials ("the materials") is intended for the exclusive use of the designated recipient ("the recipient"). This information is proprietary and confidential and may contain commercially sensitive information, and may not be copied, reproduced or republished, in whole or in part, without the prior written consent of Western Asset Management Company ("Western Asset").
Past performance does not predict future returns. These materials should not be deemed to be a prediction or projection of future performance. These materials are intended for investment professionals including professional clients, eligible counterparties, and qualified investors only.
These materials have been produced for illustrative and informational purposes only. These materials contain Western Asset's opinions and beliefs as of the date designated on the materials; these views are subject to change and may not reflect real-time market developments and investment views.
Third party data may be used throughout the materials, and this data is believed to be accurate to the best of Western Asset's knowledge at the time of publication, but cannot be guaranteed. These materials may also contain strategy or product awards or rankings from independent third parties or industry publications which are based on unbiased quantitative and/or qualitative information determined independently by each third party or publication. In some cases, Western Asset may subscribe to these third party's standard industry services or publications. These standard subscriptions and services are available to all asset managers and do not influence rankings or awards in any way.
Investment strategies or products discussed herein may involve a high degree of risk, including the loss of some or all capital. Investments in any products or strategies described in these materials may be volatile, and investors should have the financial ability and willingness to accept such risks.
Unless otherwise noted, investment performance contained in these materials is reflective of a strategy composite. All other strategy data and information included in these materials reflects a representative portfolio which is an account in the composite that Western Asset believes most closely reflects the current portfolio management style of the strategy. Performance is not a consideration in the selection of the representative portfolio. The characteristics of the representative portfolio shown may differ from other accounts in the composite. Information regarding the representative portfolio and the other accounts in the composite are available upon request. Statements in these materials should not be considered investment advice. References, either general or specific, to securities and/or issuers in the materials are for illustrative purposes only and are not intended to be, and should not be interpreted as, recommendation to purchase or sell such securities. Employees and/or clients of Western Asset may have a position in the securities or issuers mentioned.
These materials are not intended to provide, and should not be relied on for, accounting, legal, tax, investment or other advice. The recipient should consult its own counsel, accountant, investment, tax, and any other advisers for this advice, including economic risks and merits, related to making an investment with Western Asset. The recipient is responsible for observing the applicable laws and regulations of their country of residence.
Founded in 1971, Western Asset Management Company is a global fixed-income investment manager with offices in Pasadena, New York, London, Singapore, Tokyo, Melbourne, São Paulo, Hong Kong, and Zürich. Western Asset is a wholly owned subsidiary of Franklin Resources, Inc. but operates autonomously. Western Asset is comprised of six legal entities across the globe, each with distinct regional registrations: Western Asset Management Company, LLC, a registered Investment Adviser with the Securities and Exchange Commission; Western Asset Management Company Distribuidora de Títulos e Valores Mobiliários Limitada is authorized and regulated by Comissão de Valores Mobiliários and Brazilian Central Bank; Western Asset Management Company Pty Ltd ABN 41 117 767 923 is the holder of the Australian Financial Services License 303160; Western Asset Management Company Pte. Ltd. Co. Reg. No. 200007692R is a holder of a Capital Markets Services License for fund management and regulated by the Monetary Authority of Singapore; Western Asset Management Company Ltd, a registered Financial Instruments Business Operator and regulated by the Financial Services Agency of Japan; and Western Asset Management Company Limited is authorised and regulated by the Financial Conduct Authority ("FCA") (FRN 145930). This communication is intended for distribution to Professional Clients only if deemed to be a financial promotion in the UK as defined by the FCA. This communication may also be intended for certain EEA countries where Western Asset has been granted permission to do so. For the current list of the approved EEA countries please contact Western Asset at +44 (0)20 7422 3000.