skip navigation
Blog

Stay up to date on timely topics and market events. Subscribe to our Blog now.

MARKETS
May 20, 2025

Weekly Municipal Monitor—House Tax Bill Takeaways

By Sam Weitzman

Stay up to date on timely topics and market events. Subscribe to our Blog now.

Macros, Markets and Munis

Municipals posted positive returns last week as Treasury yields ultimately moved 9 to 11 basis points higher across the curve, while munis continued to retrace year-to-date (YTD) underperformance as demand improved. Fixed-income markets sold off early in the week on favorable growth prospects following the announcement of a 90-day pause on existing tariffs with China. Meanwhile, economic data continued to soften, with CPI, retail sales and University of Michigan sentiment data all coming in below expectations. Against this backdrop, muni mutual funds recorded inflows amid elevated supply conditions, reflecting renewed investor interest. This week we highlight potential municipal market implications arising from the recent House Ways and Means Committee’s tax bill.

Strong Fund Flows and Elevated Supply Continue

Fund Flows (up $769 million): During the week ending May 14, weekly reporting municipal mutual funds recorded $769 million of net inflows, according to Lipper. Long-term funds recorded $337 million of inflows, intermediate funds recorded $161 million of inflows and high-yield funds recorded $140 million of inflows. Last week’s inflows led YTD inflows higher to $5 billion.

Supply (YTD supply of $198 billion; up 28% YoY): The muni market recorded $14 billion of new-issue supply last week, up 38% from the prior week. YTD, the muni market has recorded $198 billion of new issuance, up 28% year-over-year (YoY). Tax-exempt and taxable issuance are up 25% and 28%, respectively, though tax-exempt issuance has comprised the vast majority (93%) of YTD supply. This week’s calendar is expected to increase to $15 billion. The largest deals include $731 million Kansas State Department of Transportation and $659 million Black Belt Energy (gas prepay) transactions.

This Week in Munis: House Bill Tax Takeaways

After extensive negotiations, last week the House Ways and Means Committee released the one “Big, Beautiful Bill” that includes tax measures which, if enacted, could have direct and indirect implications on the municipal market. Most notably, the draft bill does not include changes to the tax exemption of municipal bond interest. As highlighted in our prior blogs, earlier this year the Committee included the elimination of tax-exempt interest as part of a menu of measures that could be proposed within a broader reconciliation package to close budget gaps.

The proposal would extend individual income tax brackets of the 2017 Tax Cuts and Jobs Act, notably keeping the top marginal rate at 37% rather than reverting to the previous rate of 39.6%. Leading up to the bill’s release, there were discussions within the administration about a higher “millionaires’ tax,” but it was ultimately not included in the draft. The Tax Foundation estimates that the package would prevent tax rates from rising for 62% of taxpayers.

The bill also proposes increasing the state and local tax (SALT) deduction cap to $30,000 from $10,000, with income limits of $400,000 and $200,000 for joint and single filers, respectively. While a higher state and local tax deduction could reduce tax burdens that drive investors to munis, we believe that the income limits largely blunt the impact of the state and local tax deduction proposed in its current format.

Beyond these changes that largely influence the value of the municipal tax exemption, the draft bill also includes tax provisions that could impact municipal credit. Notably, it seeks to institute an endowment tax on higher education institutions based on endowment-per-student thresholds. Private universities with $2 million or more per student in endowment funds would pay 21% on net investment income, while schools with lower endowment levels would pay closer to the current rate of 1.4%.

Considering the slim Republican majority in Congress, Western Asset does not anticipate the bill will pass in its current form. The bill does little to appease deficit hawks with the estimated federal tax revenue reduction of $4 trillion over 10 years. Meanwhile, Republicans in higher-tax states remain committed to expanding the SALT deduction beyond the current proposal. However, as it stands, the bill should bring relief to muni investors concerned about losing the tax exemption on municipal interest. With the House aiming to vote on the legislation by the end of the month, we believe it will be difficult to add significant new measures at this stage.

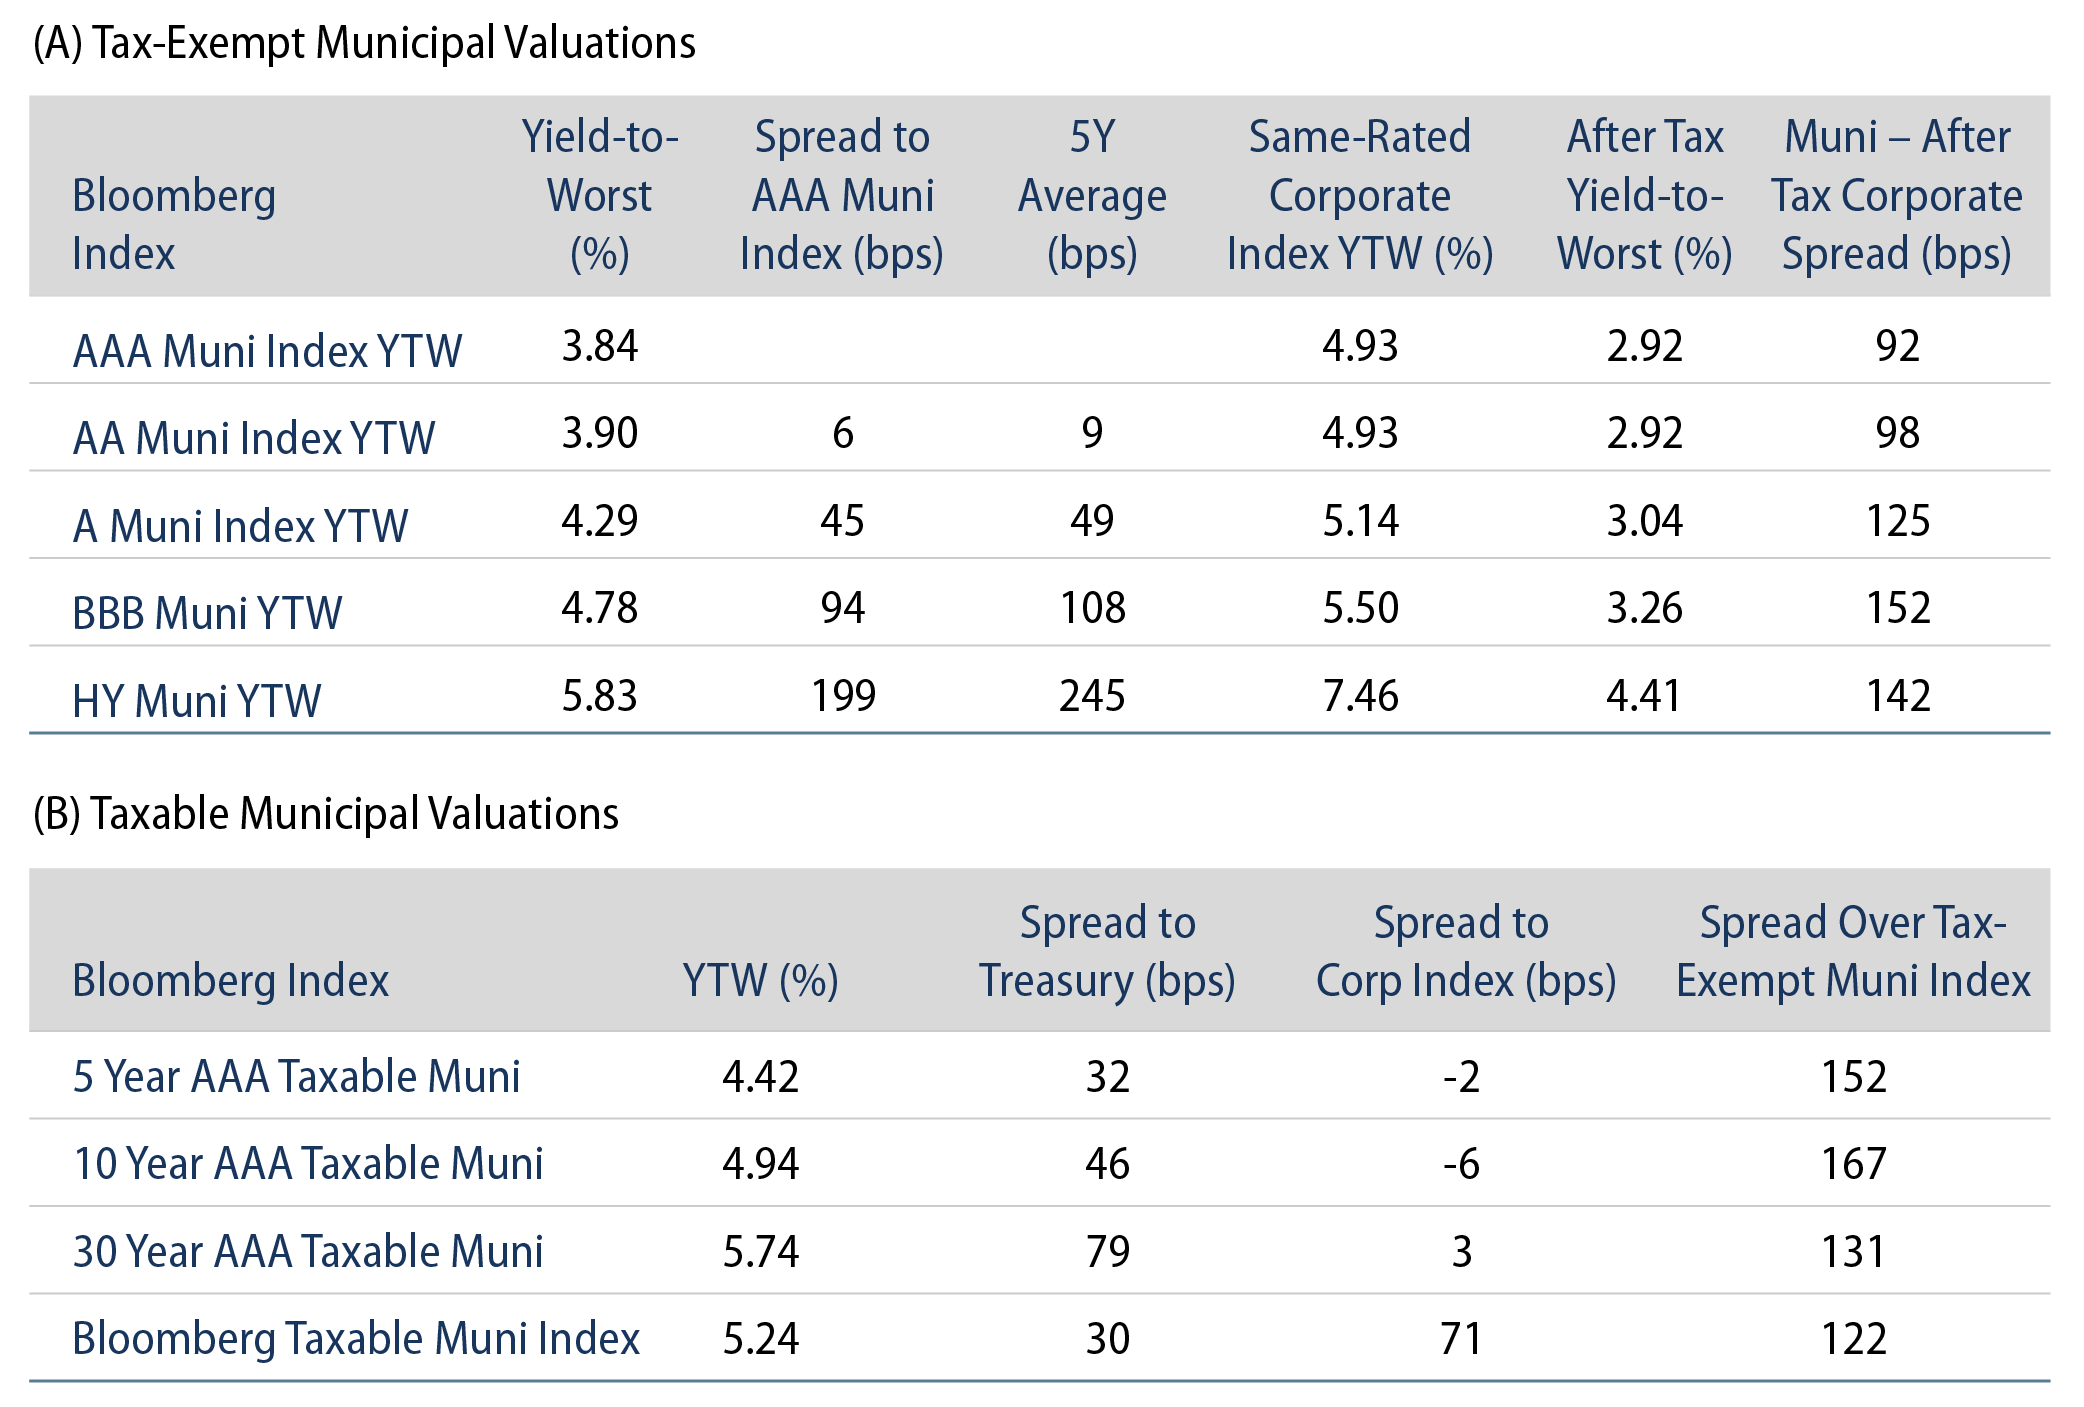
Municipal Credit Curves and Relative Value

Exhibit 1: Muni Credit Curves
Muni Credit Curves
Source: Bloomberg, Western Asset. As of 16 May 25. Bloomberg Valuation Service (BVAL) Municipal Credit Indices (AAA, AA, A, BBB, respectively) and US Sovereign Curves. Taxable-Equivalent Muni Credit Curves consider the top marginal effective tax rate of 40.8%. AA Muni is represented by the US General Obligation AA Muni BVAL Yield Curve. The BVAL curve is populated with pricing from uninsured AA General Obligation bonds. A Muni is represented by the US General Obligation A Muni BVAL Yield Curve. The BVAL curve is populated with pricing from uninsured A General Obligation bonds. BBB Muni is represented by the US General Obligation BBB Muni BVAL Yield Curve. The BVAL curve is populated with pricing from uninsured BBB General Obligation bonds. Indices are unmanaged and one cannot directly invest in them. They do not include fees, expenses or sales charges. Past performance is not an indicator or a guarantee of future results. Select the image to expand the view.
Exhibit 2: Taxable-Equivalent Muni Credit Curves
Taxable-Equivalent Muni Credit Curves
Source: Bloomberg, Western Asset. As of 16 May 25. Bloomberg Valuation Service (BVAL) Municipal Credit Indices (AAA, AA, A, BBB, respectively) and US Sovereign Curves. Taxable-Equivalent Muni Credit Curves consider the top marginal effective tax rate of 40.8%. AA Muni is represented by the US General Obligation AA Muni BVAL Yield Curve. The BVAL curve is populated with pricing from uninsured AA General Obligation bonds. A Muni is represented by the US General Obligation A Muni BVAL Yield Curve. The BVAL curve is populated with pricing from uninsured A General Obligation bonds. BBB Muni is represented by the US General Obligation BBB Muni BVAL Yield Curve. The BVAL curve is populated with pricing from uninsured BBB General Obligation bonds. Indices are unmanaged and one cannot directly invest in them. They do not include fees, expenses or sales charges. Past performance is not an indicator or a guarantee of future results. Select the image to expand the view.
Exhibit 3: AAA Munis vs. Treasuries
AAA Munis vs. Treasuries
Source: Muni Yields: Thomson Reuters MMD, Treasury Yields: Bloomberg. As of 16 May 25. Past performance is not a guarantee of future results. It is not possible to invest directly in an index. Select the image to expand the view.
Exhibit 4: Tax-Exempt and Taxable Muni Valuations
Tax-Exempt and Taxable Muni Valuations
Source: Bloomberg, Western Asset. As of 16 May 25. Yield-to-worst (YTW) is the lowest potential yield that can be received on a bond without the issuer actually defaulting. AAA, AA, A, BBB Corporate Indices; After-Tax Yield assumes a top effective tax rate of 40.8%. Taxable Muni Index Corporate comparable used is the Global Corporate Aggregate (ex. BBB) to better align credit quality and duration. Select the image to expand the view.

Western Asset Key Themes for Muni Investors

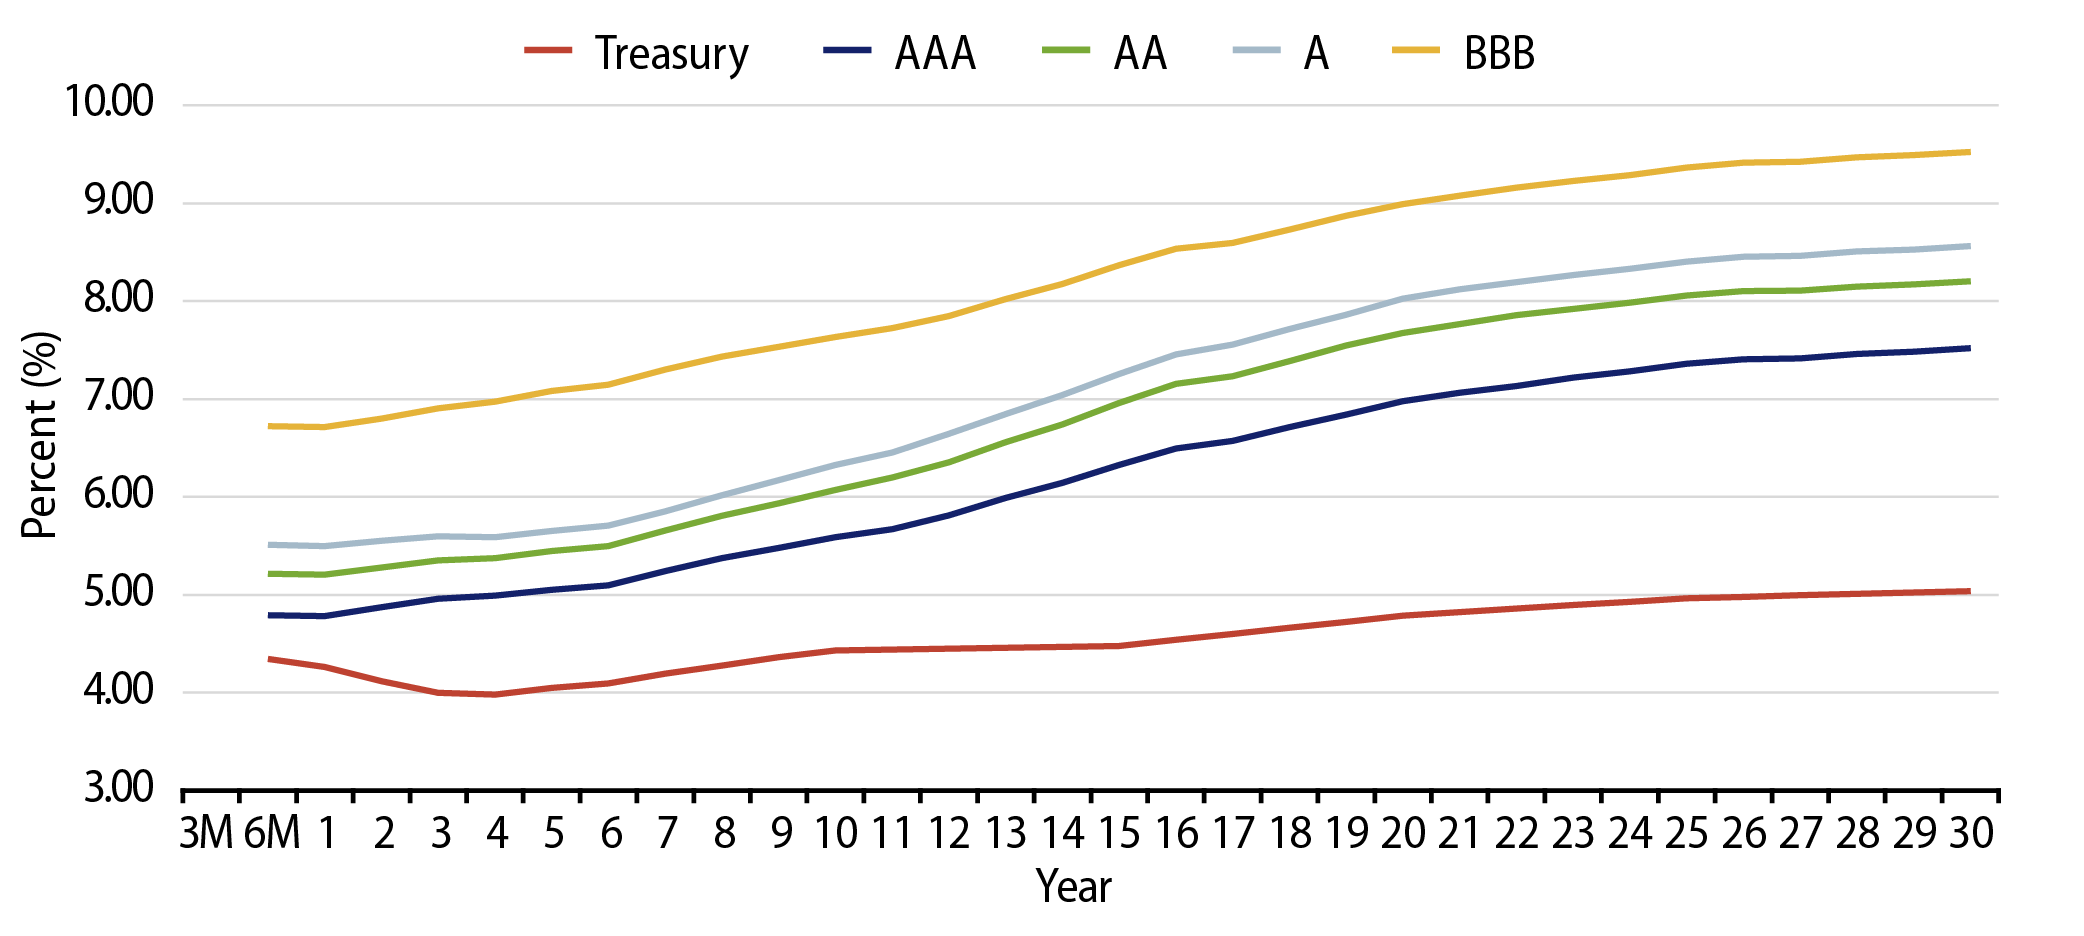
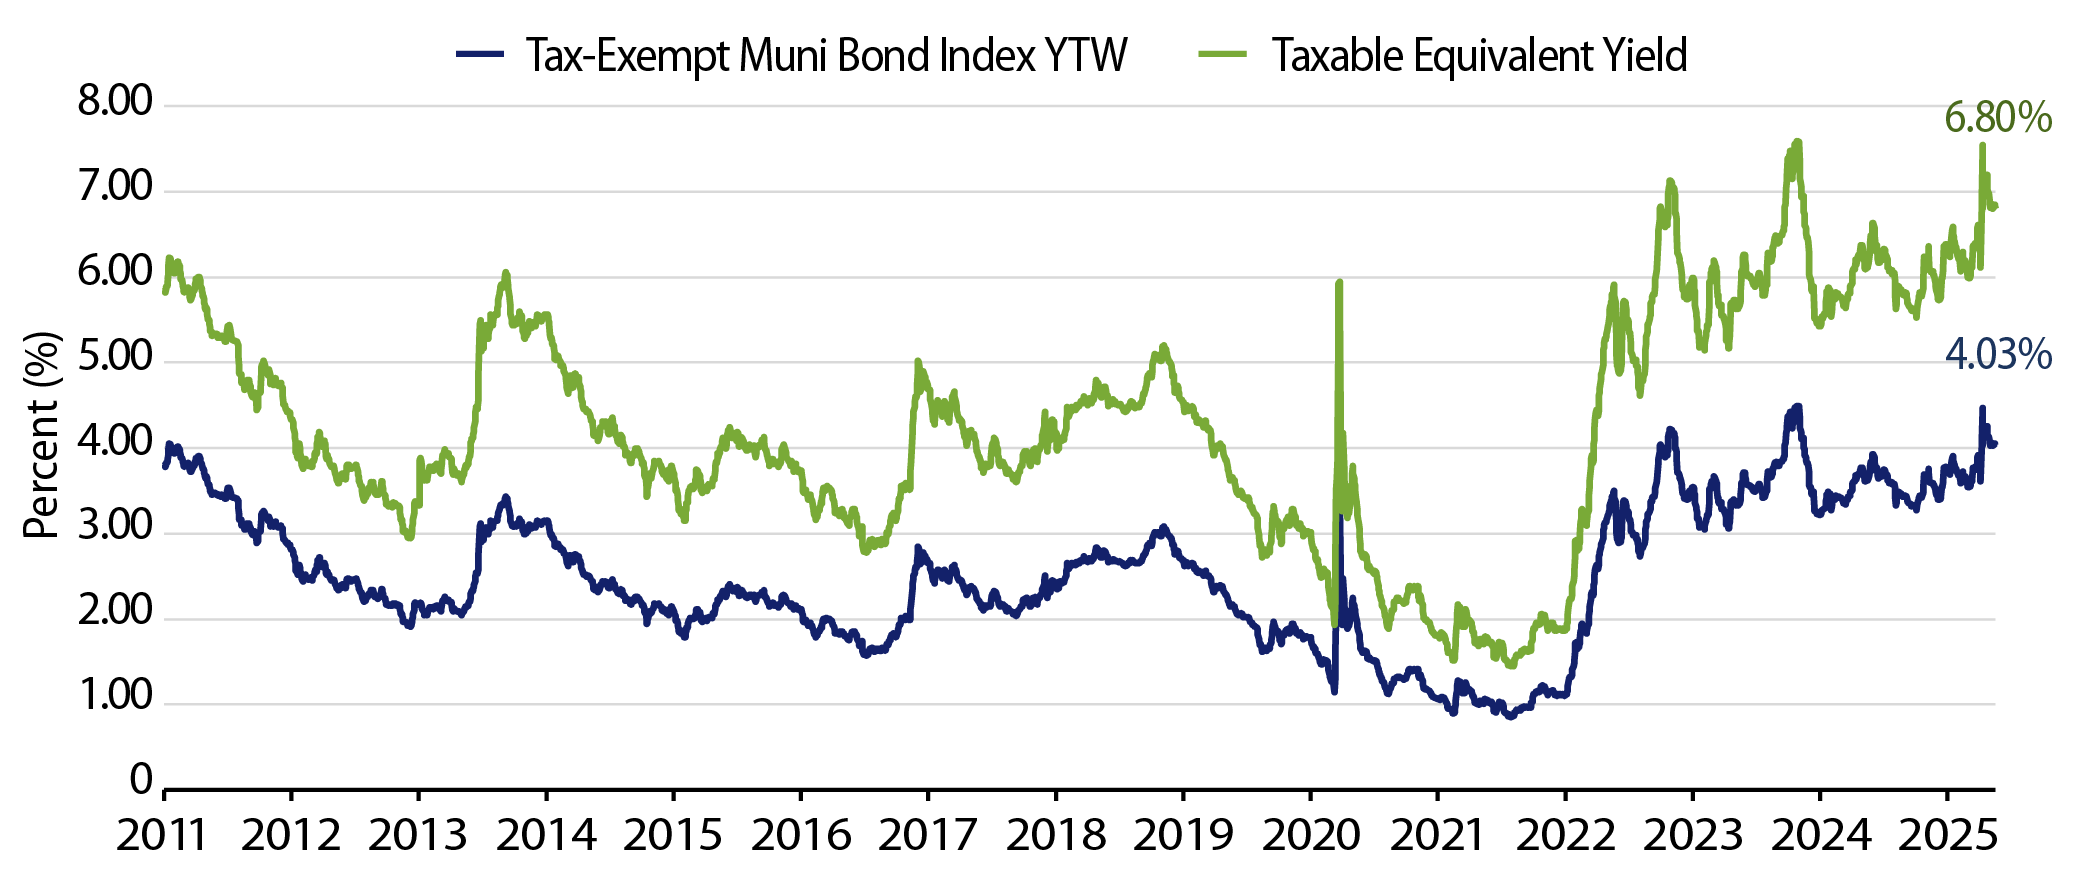
Theme #1: Municipal taxable-equivalent yields and income opportunities remain near decade-high levels.

Exhibit 5: Muni and Taxable-Equivalent Muni Yield-to-Worst
Muni and Taxable-Equivalent Muni Yield-to-Worst
Source: Bloomberg, Western Asset. As of 16 May 25. Bloomberg Municipal Bond Index yield considering highest marginal tax rate of 40.8%. Indexes are unmanaged and one cannot directly invest in them. They do not include fees, expenses or sales charges. Past performance is not an indicator or a guarantee of future results. Select the image to expand the view.

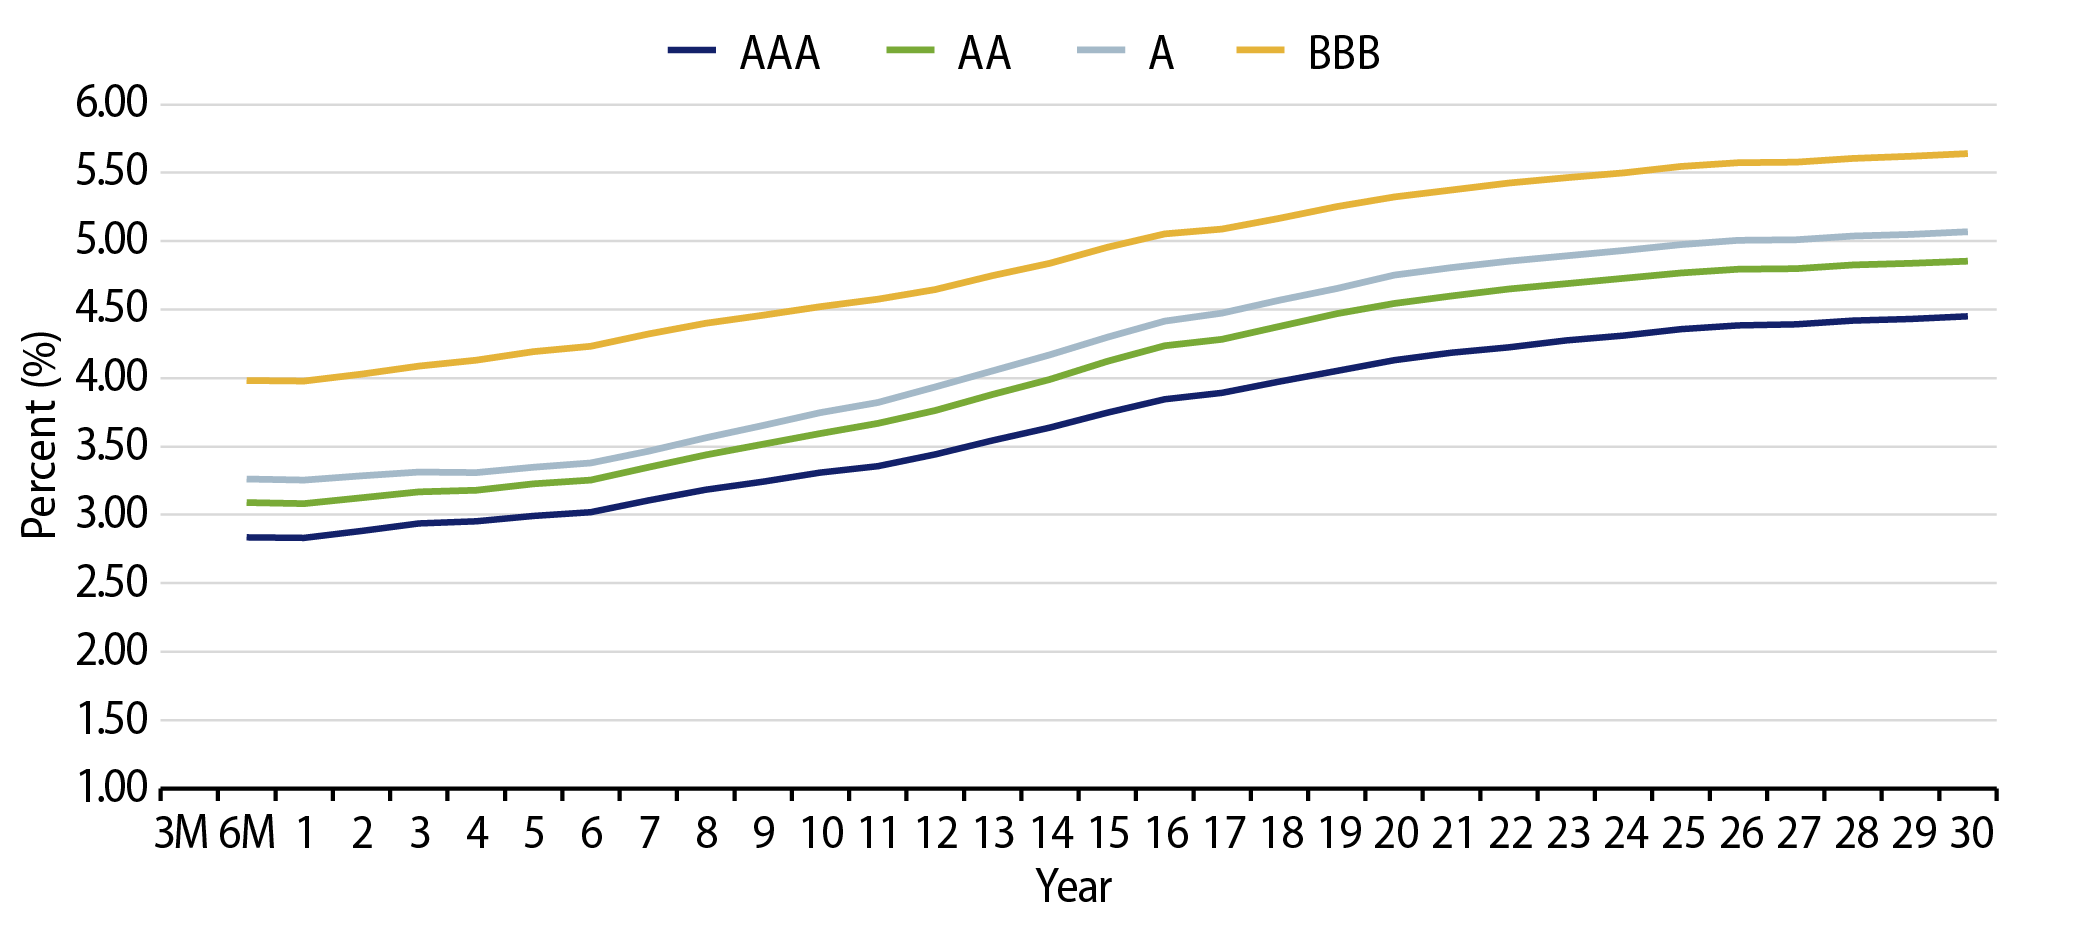
Theme #2: The muni curve has steepened, offering better value in intermediate and longer maturities.

Exhibit 6: AAA Municipal vs. Treasury Yield Curves
AAA Municipal vs. Treasury Yield Curves
Source: Bloomberg, Western Asset. As of 16 May 25. Bloomberg Valuation Service (BVAL) AAA Muni Curve and US On-/Off-the-Run Sovereign Curve. Indexes are unmanaged and one cannot directly invest in them. They do not include fees, expenses or sales charges. Past performance is not an indicator or a guarantee of future results. Select the image to expand the view.

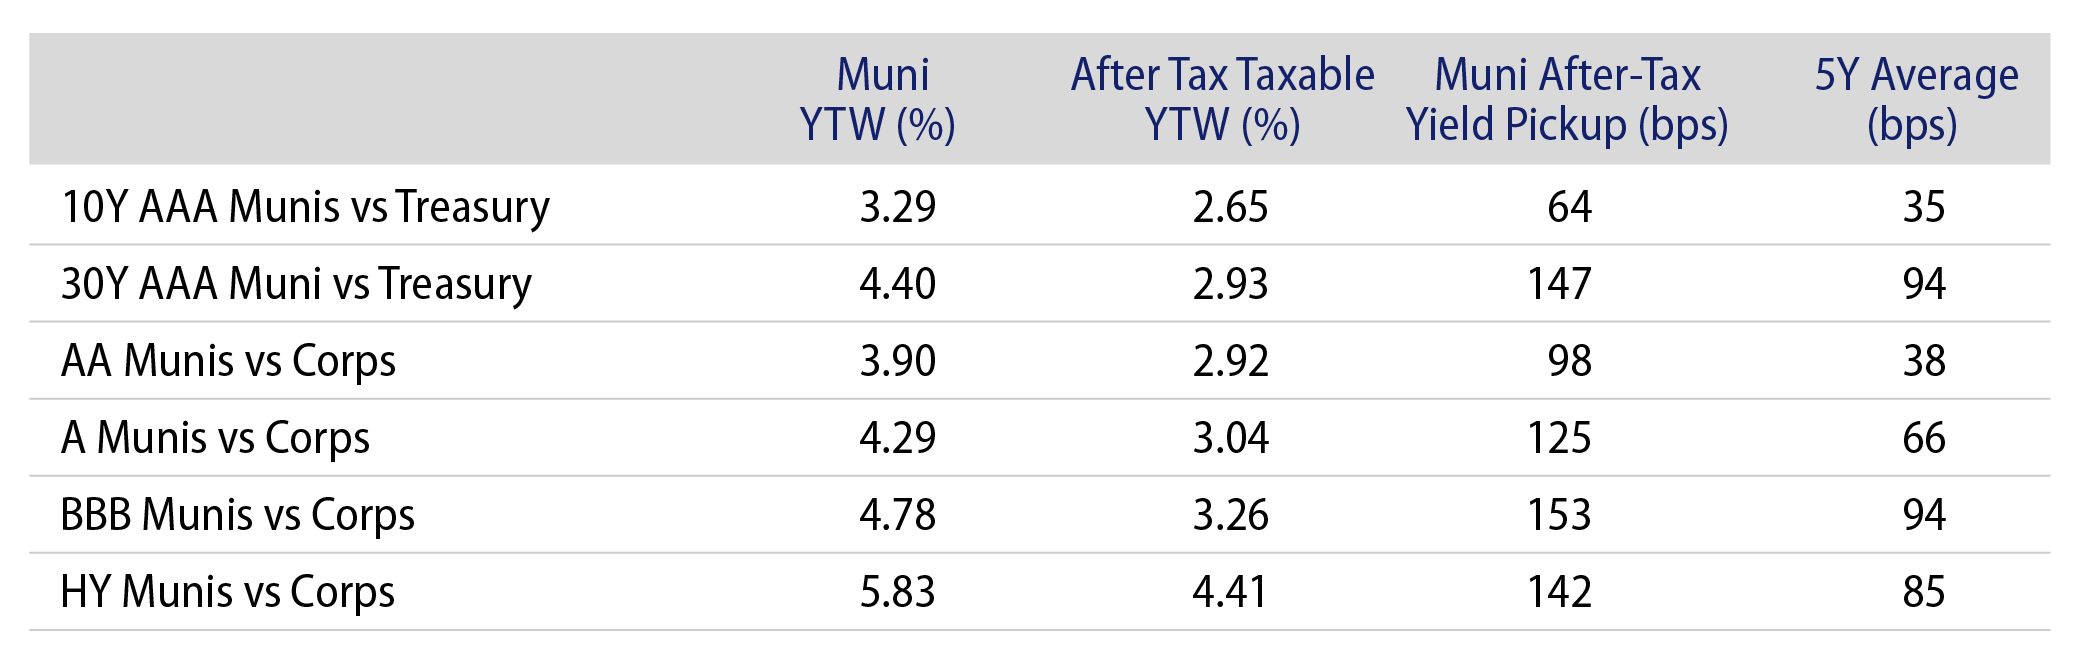
Theme #3: Munis offer attractive after-tax yield compared to taxable alternatives.

Exhibit 7: Municipal vs. Taxable Fixed-Income Yields by Quality
Municipal vs. Taxable Fixed-Income Yields by Quality
Source: Western Asset, Bloomberg. As 16 May 25. 10- and 30-Year comparison reflects Bloomberg Valuation Service (BVAL) AAA Muni Curve and US On-/Off-the-Run Sovereign Curve. AA Muni reflects the Bloomberg AA Muni Bond Index. A Muni reflects the Bloomberg A Muni Bond Index. BBB Muni reflects the Bloomberg BBB Muni Bond Index. HY Muni reflects the Bloomberg High Yield Muni Bond Index. AA Corp reflects the Bloomberg AA Corporate Bond Index. A Corp reflects the Bloomberg A Corporate Bond Index. BBB Corp reflects the Bloomberg BBB Corporate Bond Index. After-tax yield considers the top marginal tax rate of 40.8%. Indexes are unmanaged and one cannot directly invest in them. They do not include fees, expenses or sales charges. Past performance is not an indicator or a guarantee of future results. Select the image to expand the view.

© Western Asset Management Company, LLC 2025. The information contained in these materials ("the materials") is intended for the exclusive use of the designated recipient ("the recipient"). This information is proprietary and confidential and may contain commercially sensitive information, and may not be copied, reproduced or republished, in whole or in part, without the prior written consent of Western Asset Management Company ("Western Asset").
Past performance does not predict future returns. These materials should not be deemed to be a prediction or projection of future performance. These materials are intended for investment professionals including professional clients, eligible counterparties, and qualified investors only.
These materials have been produced for illustrative and informational purposes only. These materials contain Western Asset's opinions and beliefs as of the date designated on the materials; these views are subject to change and may not reflect real-time market developments and investment views.
Third party data may be used throughout the materials, and this data is believed to be accurate to the best of Western Asset's knowledge at the time of publication, but cannot be guaranteed. These materials may also contain strategy or product awards or rankings from independent third parties or industry publications which are based on unbiased quantitative and/or qualitative information determined independently by each third party or publication. In some cases, Western Asset may subscribe to these third party's standard industry services or publications. These standard subscriptions and services are available to all asset managers and do not influence rankings or awards in any way.
Investment strategies or products discussed herein may involve a high degree of risk, including the loss of some or all capital. Investments in any products or strategies described in these materials may be volatile, and investors should have the financial ability and willingness to accept such risks.
Unless otherwise noted, investment performance contained in these materials is reflective of a strategy composite. All other strategy data and information included in these materials reflects a representative portfolio which is an account in the composite that Western Asset believes most closely reflects the current portfolio management style of the strategy. Performance is not a consideration in the selection of the representative portfolio. The characteristics of the representative portfolio shown may differ from other accounts in the composite. Information regarding the representative portfolio and the other accounts in the composite are available upon request. Statements in these materials should not be considered investment advice. References, either general or specific, to securities and/or issuers in the materials are for illustrative purposes only and are not intended to be, and should not be interpreted as, recommendation to purchase or sell such securities. Employees and/or clients of Western Asset may have a position in the securities or issuers mentioned.
These materials are not intended to provide, and should not be relied on for, accounting, legal, tax, investment or other advice. The recipient should consult its own counsel, accountant, investment, tax, and any other advisers for this advice, including economic risks and merits, related to making an investment with Western Asset. The recipient is responsible for observing the applicable laws and regulations of their country of residence.
Founded in 1971, Western Asset Management Company is a global fixed-income investment manager with offices in Pasadena, New York, London, Singapore, Tokyo, Melbourne, São Paulo, Hong Kong, and Zürich. Western Asset is a wholly owned subsidiary of Franklin Resources, Inc. but operates autonomously. Western Asset is comprised of six legal entities across the globe, each with distinct regional registrations: Western Asset Management Company, LLC, a registered Investment Adviser with the Securities and Exchange Commission; Western Asset Management Company Ltda. is regulated by Comissão de Valores Mobiliários; Western Asset Management Company Pty Ltd ABN 41 117 767 923 is the holder of the Australian Financial Services License 303160; Western Asset Management Company Pte. Ltd. Co. Reg. No. 200007692R is a holder of a Capital Markets Services License for fund management and regulated by the Monetary Authority of Singapore; Western Asset Management Company Ltd, a registered Financial Instruments Business Operator and regulated by the Financial Services Agency of Japan; and Western Asset Management Company Limited is authorised and regulated by the Financial Conduct Authority ("FCA") (FRN 145930). This communication is intended for distribution to Professional Clients only if deemed to be a financial promotion in the UK as defined by the FCA. This communication may also be intended for certain EEA countries where Western Asset has been granted permission to do so. For the current list of the approved EEA countries please contact Western Asset at +44 (0)20 7422 3000.