skip navigation
Blog

Stay up to date on timely topics and market events. Subscribe to our Blog now.

MARKETS
September 01, 2022

The Cyclical Shift in Yields Between Bank Deposits and Money Market Funds

By Jason Straker, Ivor Schucking, Sebastian Angerer

Stay up to date on timely topics and market events. Subscribe to our Blog now.

The composition of traditional US banks was fundamentally reshaped by the fallout from the global financial crisis. Through strict and pragmatic regulation, balance sheets became simpler, safer and stronger to benefit all stakeholders. This positive seismic shift was especially important during the recent COVID-19 pandemic when banks played an important role as part of the economic solution put in place by the world’s central banks.

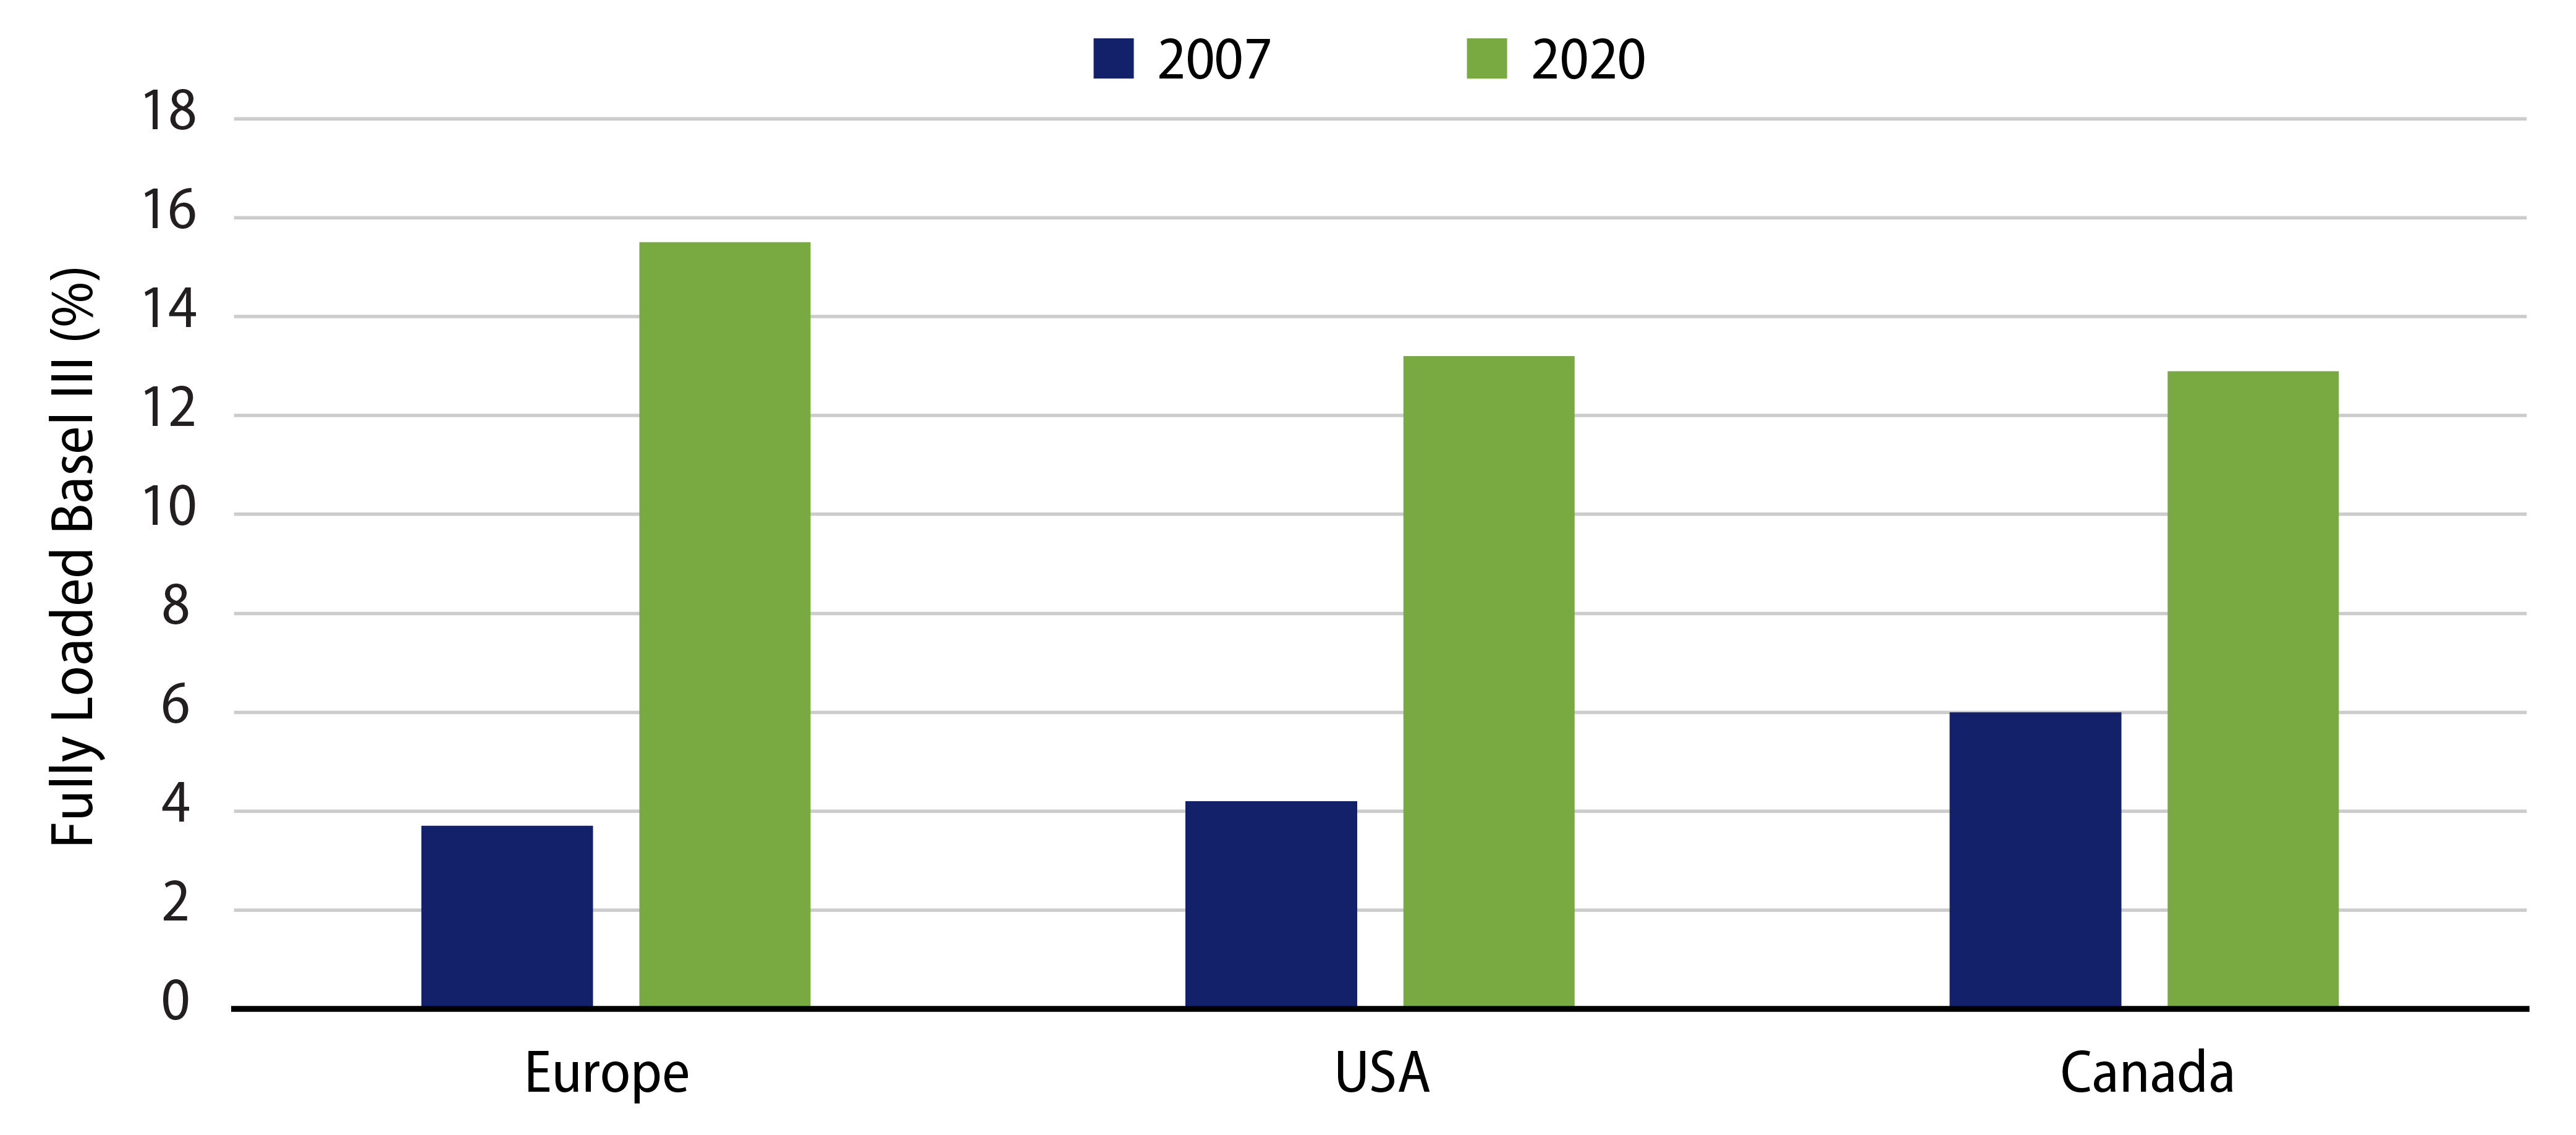
US bank balance sheets are now arguably the strongest they’ve been in decades and surprisingly stronger than they were pre-Covid. Record earnings combined with the Federal Reserve’s quantitative easing program resulted in banks coming out of the crisis with strong capital ratios (Exhibit 1).

Exhibit 1: Regulatory Equity Tier 1 Ratio for Selected Global Banks, Pre- and Post-Covid
Regulatory Equity Tier 1 Ratio for Selected Global Banks, Pre- and Post-Covid
Source: BNP Paribas. As of 31 Mar 21. Select the image to expand the view.

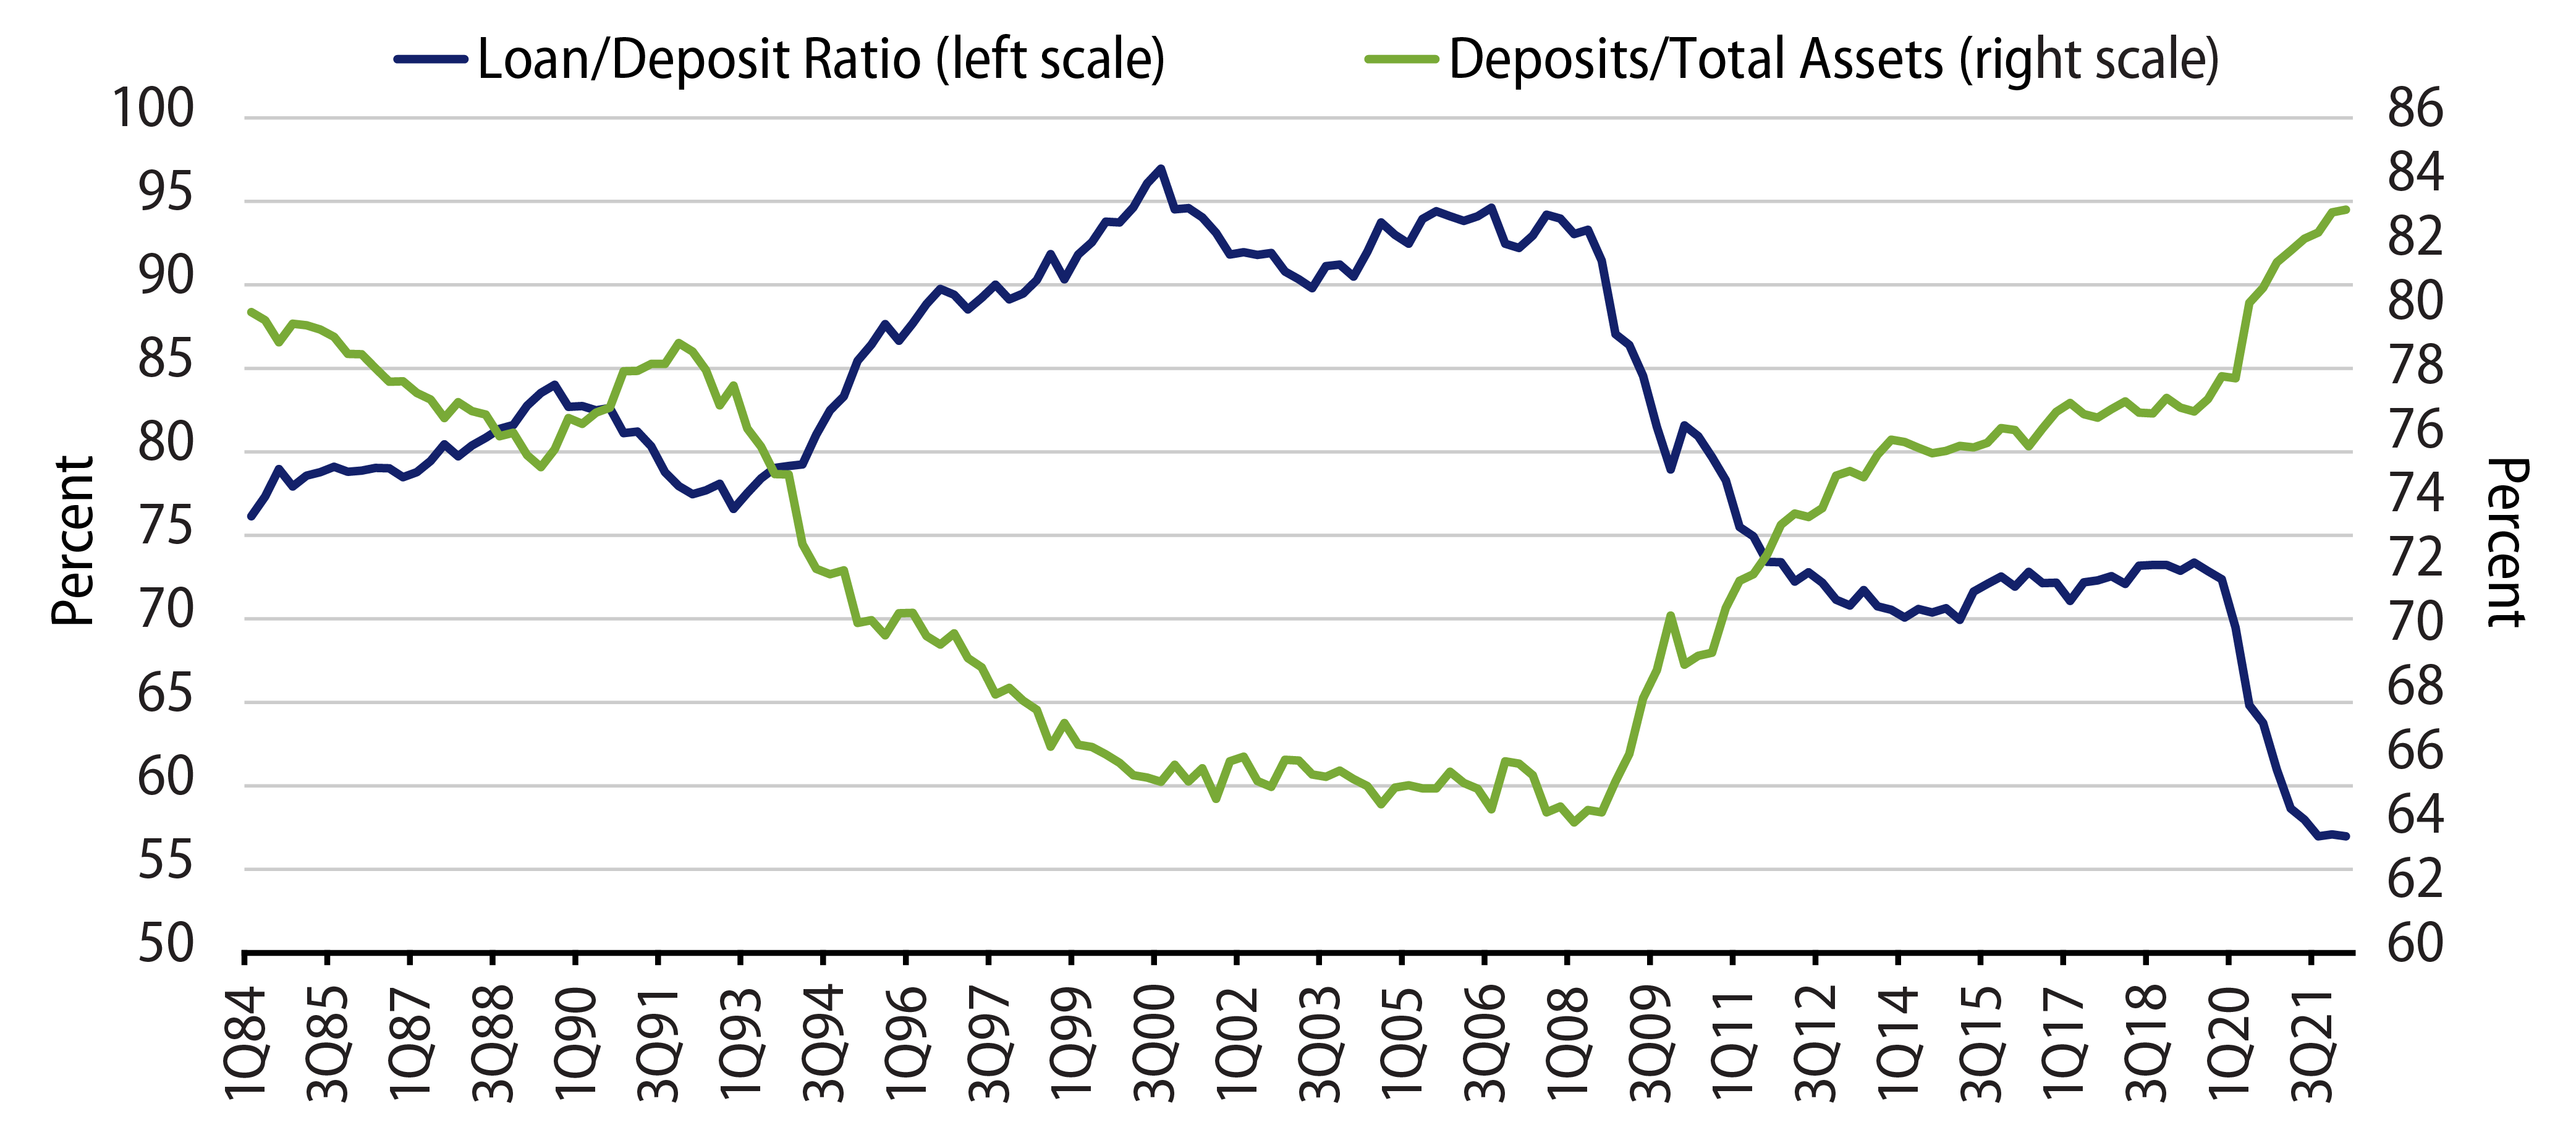
Bank funding entering 2022 continued to be the most conservative in decades with a 57% loan/deposit ratio, all-time-low average funding costs of 15 bps and a record-low 52% loans/earning assets ratio compared to the longer-term average of 68%. Deposits now fund 83% of bank industry assets versus 65% in 2008, the highest proportion since 1993.

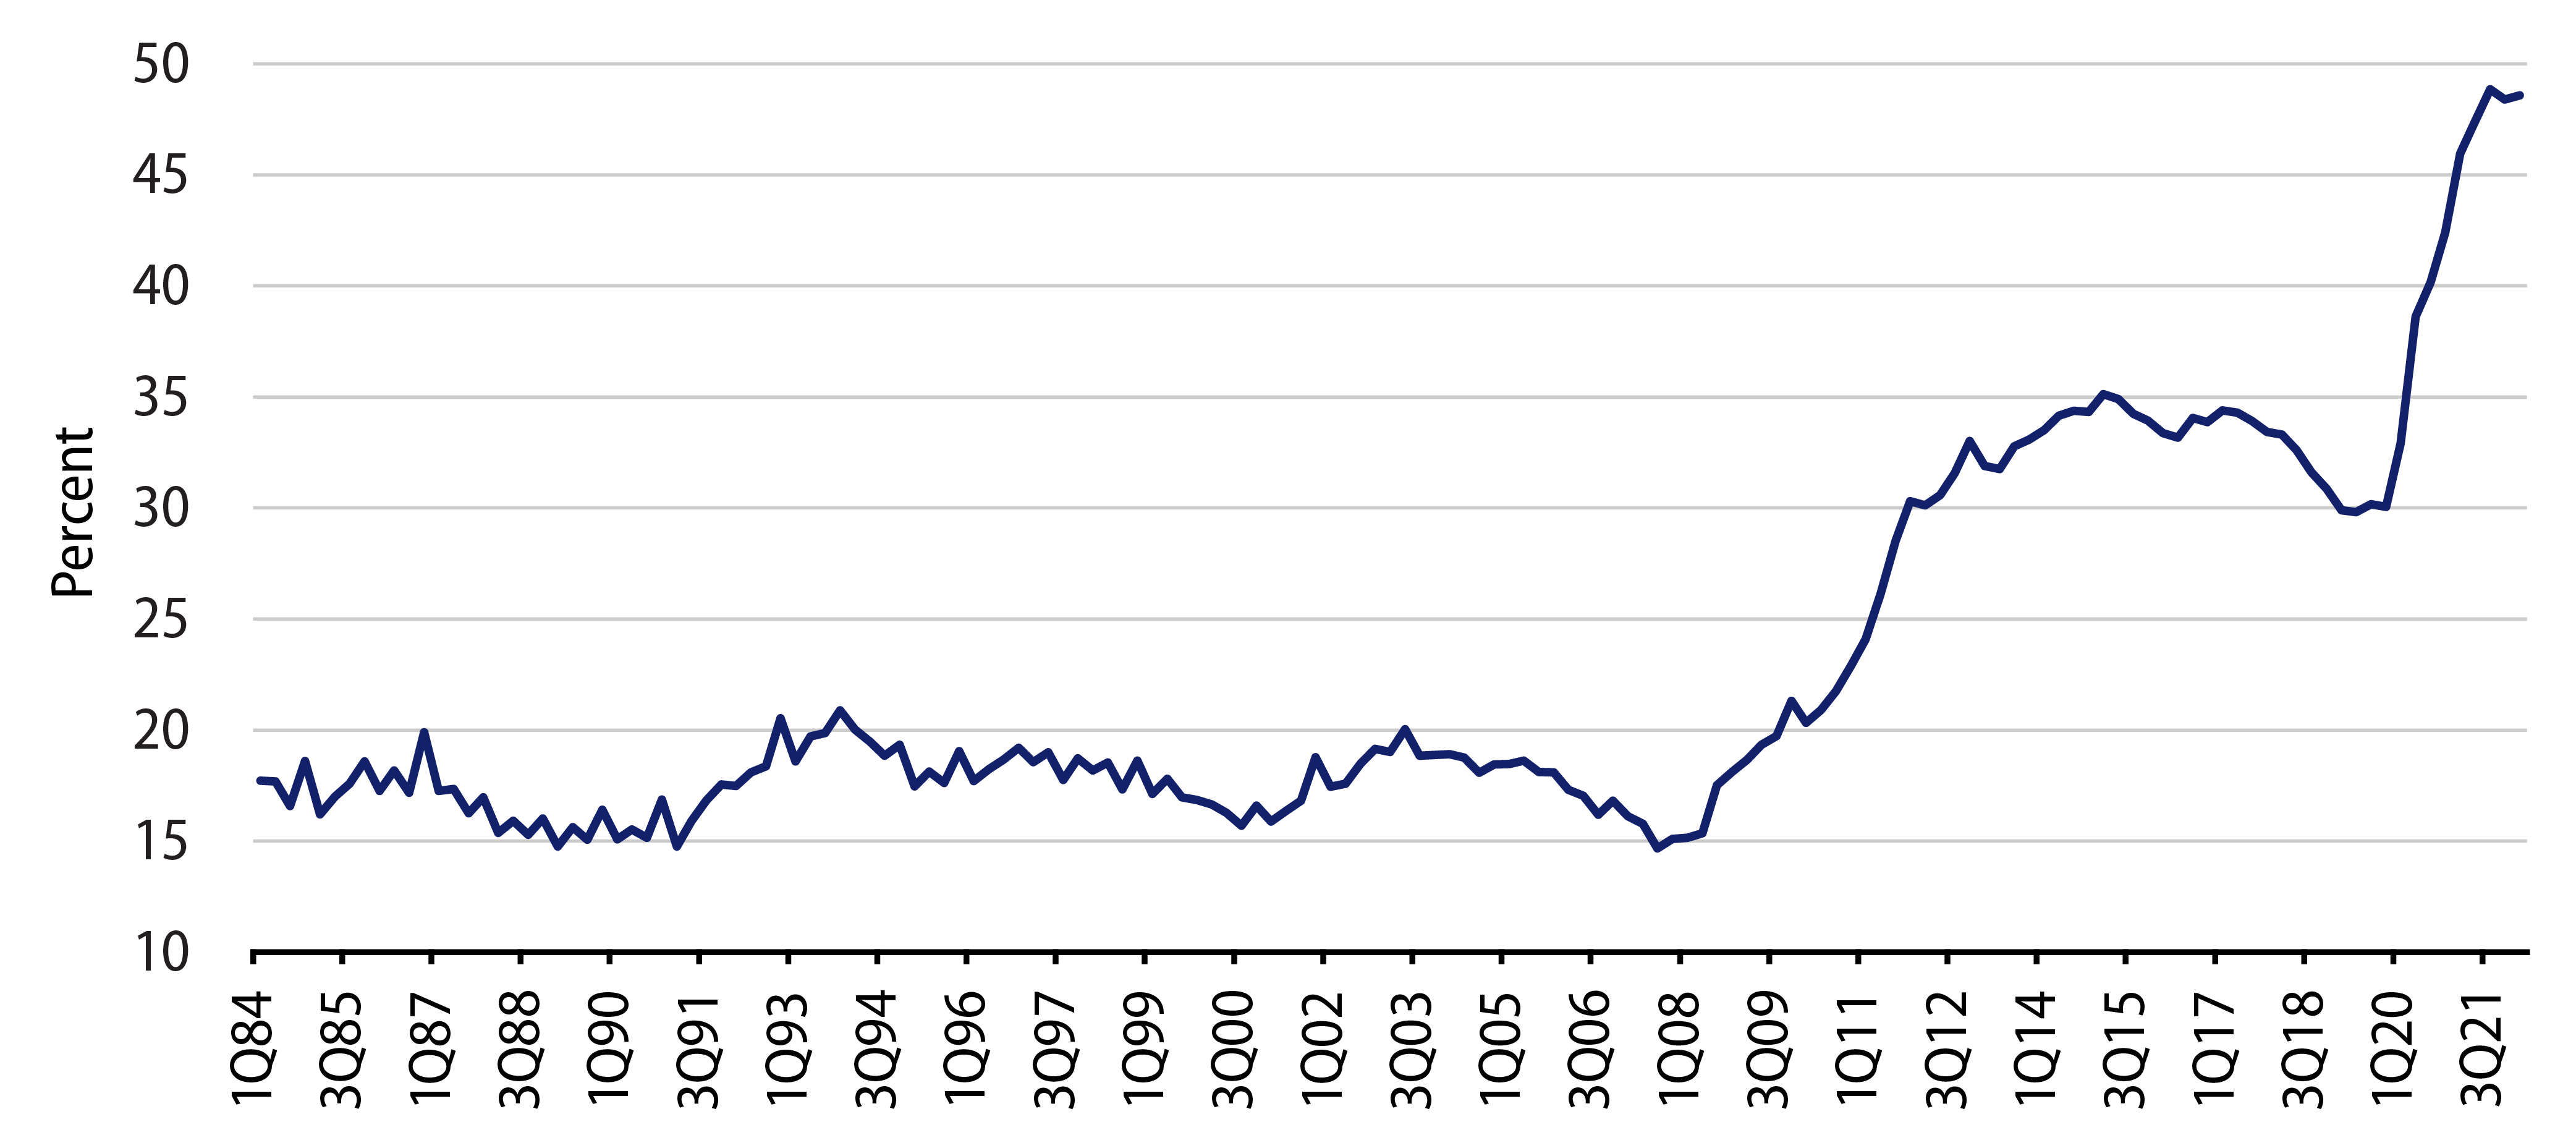
In fact, deposit growth of $5.2 trillion over the past nine quarters equals the deposit growth of all the past 10 years combined. This has led to deposits now exceeding loans by a record gap of $8.5 trillion, representing more than 15 years of average annual loan growth of 4% to 5% (Exhibits 2 and 3).

Exhibit 2: Funding Metrics of US Banks
Funding Metrics of US Banks
Source: Barclays Research. As of 31 Mar 22. Select the image to expand the view.
Exhibit 3: Share of Loans Funded by Non-Interesting-Bearing Deposits (%)
Share of Loans Funded by Non-Interesting-Bearing Deposits (%)
Source: Western Asset, Bloomberg. As of 31 Mar 22. Select the image to expand the view.

Parallel to this credit-positive environment, these structural changes have also had an impact on the correlation between the fed funds rate and US bank deposit interest rates, also known as “deposit betas.” Although at the start of 2022 US banks positioned themselves well for the prospect of higher rates and the subsequent expansion of net interest margins, this did not necessarily mean that these higher rates would be completely passed on to depositors. In fact, the record-high deposit balances have led to betas that were below market expectations in the current central bank rate-tightening cycle, and this will be especially true for non-operational deposits with the largest banks as well as deposits from retail customers.

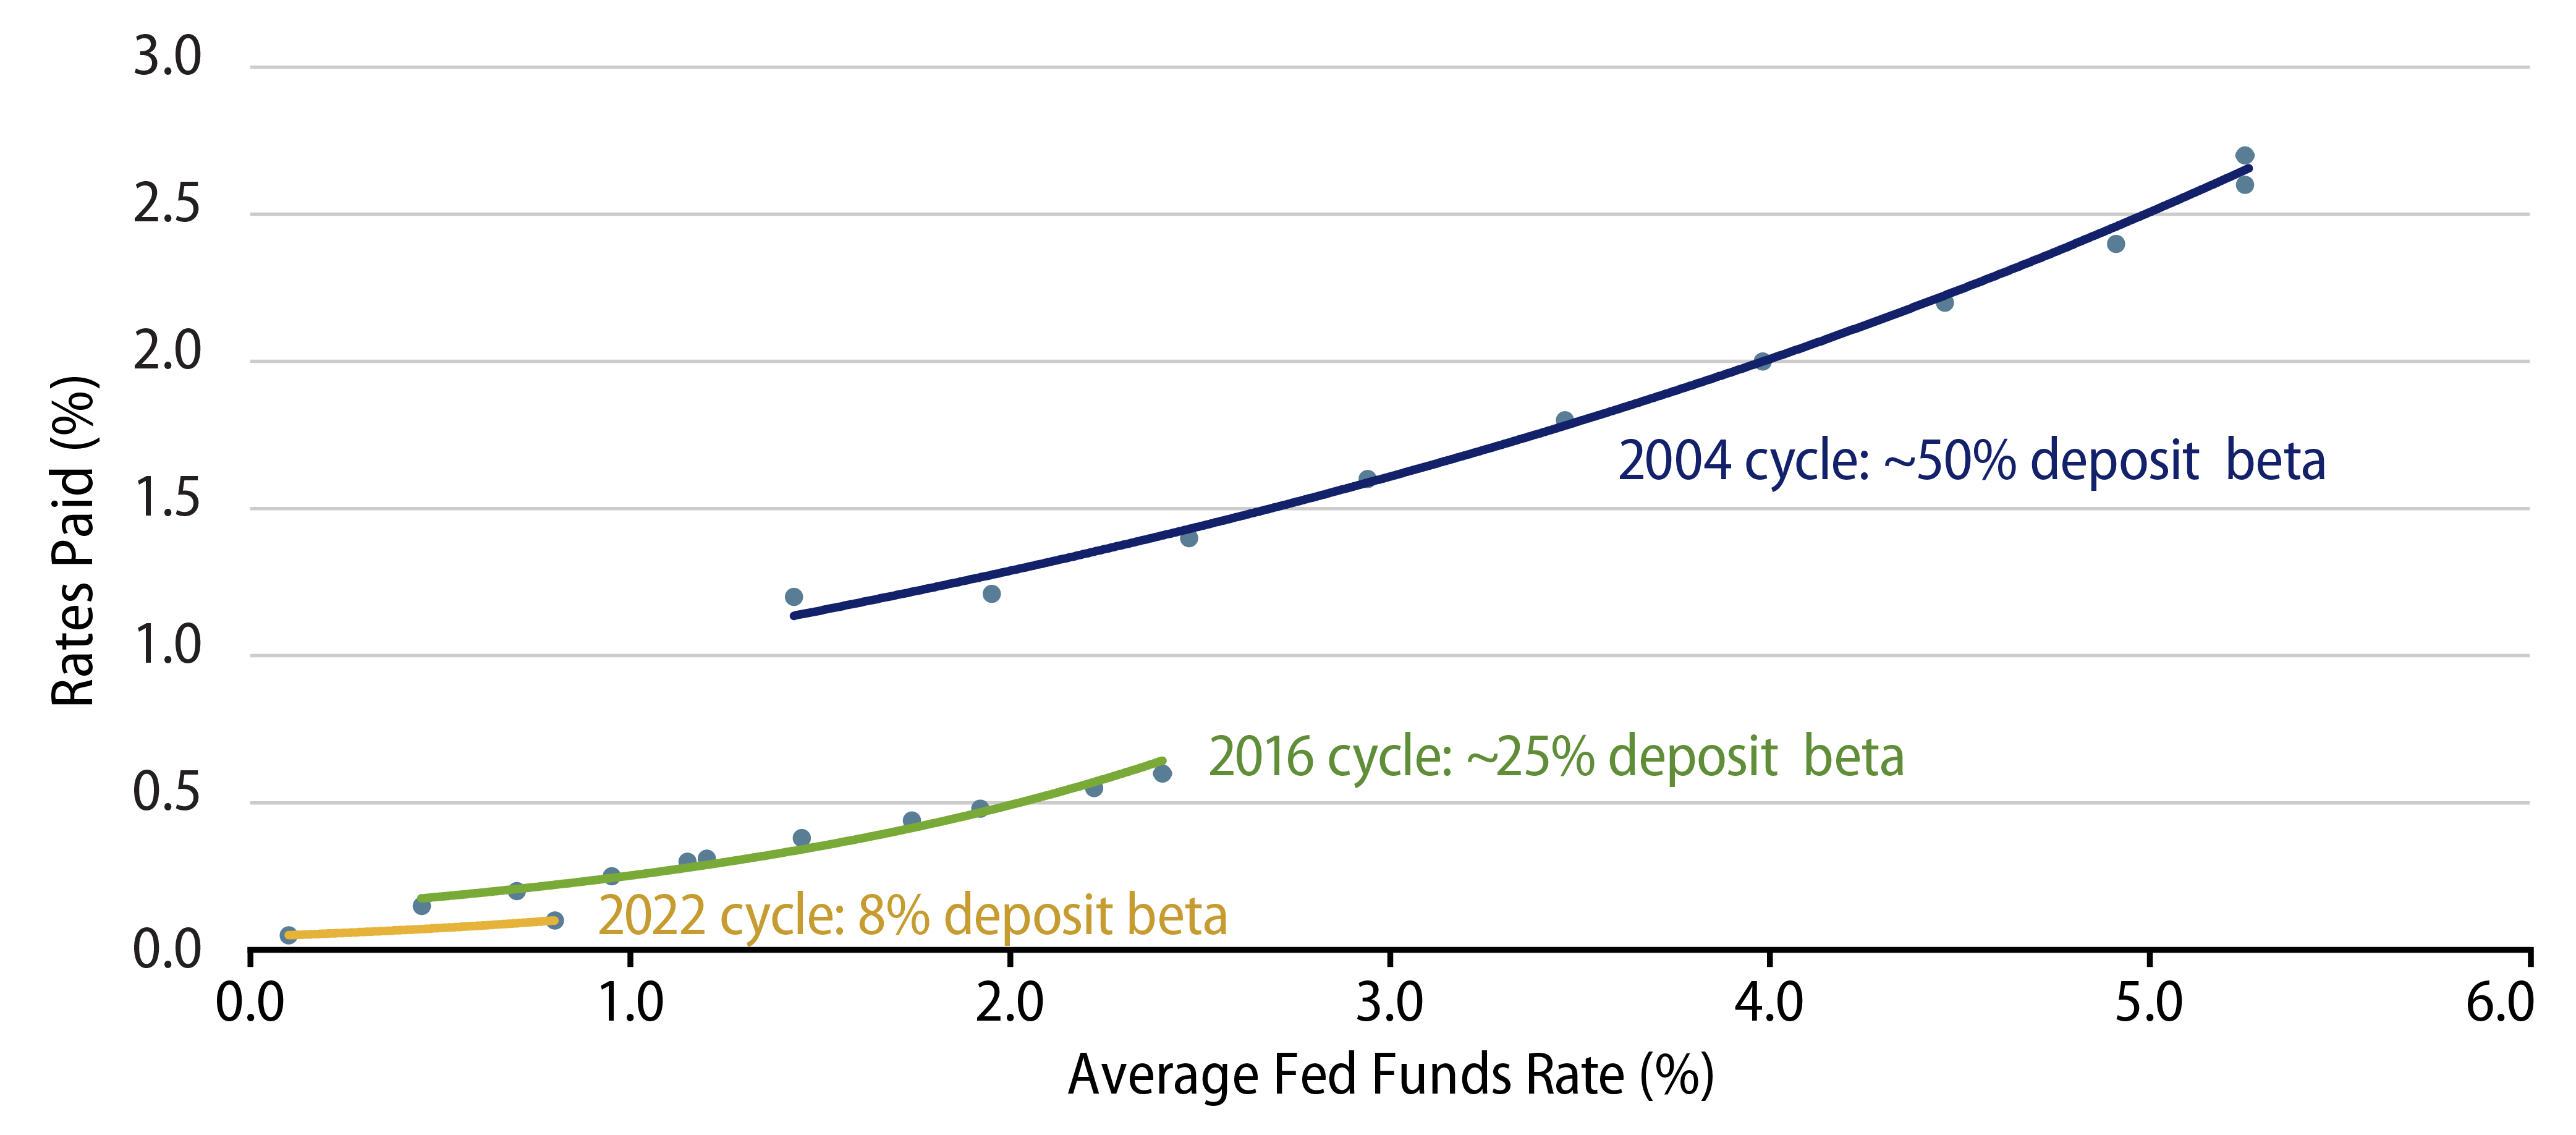
So far in 2022, as expected, deposit betas have been comparatively low in relation to prior tightening cycles. The 2004-2006 tightening cycle showed a beta close to 50% and the 2016-2018 cycle beta was close to 25%, but the first two quarters of the 2022 cycle have so far only exhibited a beta close to 8% (Exhibit 4).

Exhibit 4: Comparing the 2004, 2016 and 2022 Tightening Cycles—Deposit Beta Curves
Comparing the 2004, 2016 and 2022 Tightening Cycles—Deposit Beta Curves
Source: SNL, Credit Suisse. Represents selected universe of large US traditional banks. Deposit reprice beta is measured as the cumulative change in total cost of deposits relative to the change in average fed funds rate over the tightening cycle. Total cost of deposits includes interest and non-interest-bearing balances. As of 08 Jul 22. Select the image to expand the view.

The total amount of deposits is not the sole factor driving betas; banks are also concerned with the source of funding. Non-operational deposits are treated less favorably under banking regulation such as Basel III. As a result, banks are keen to reduce these deposit types where possible by setting interest rates at less competitive levels. It is expected that once this reduction has reached suitable targets, deposit betas will reset slightly higher as banks will aim to retain the more valuable operational deposits where possible.

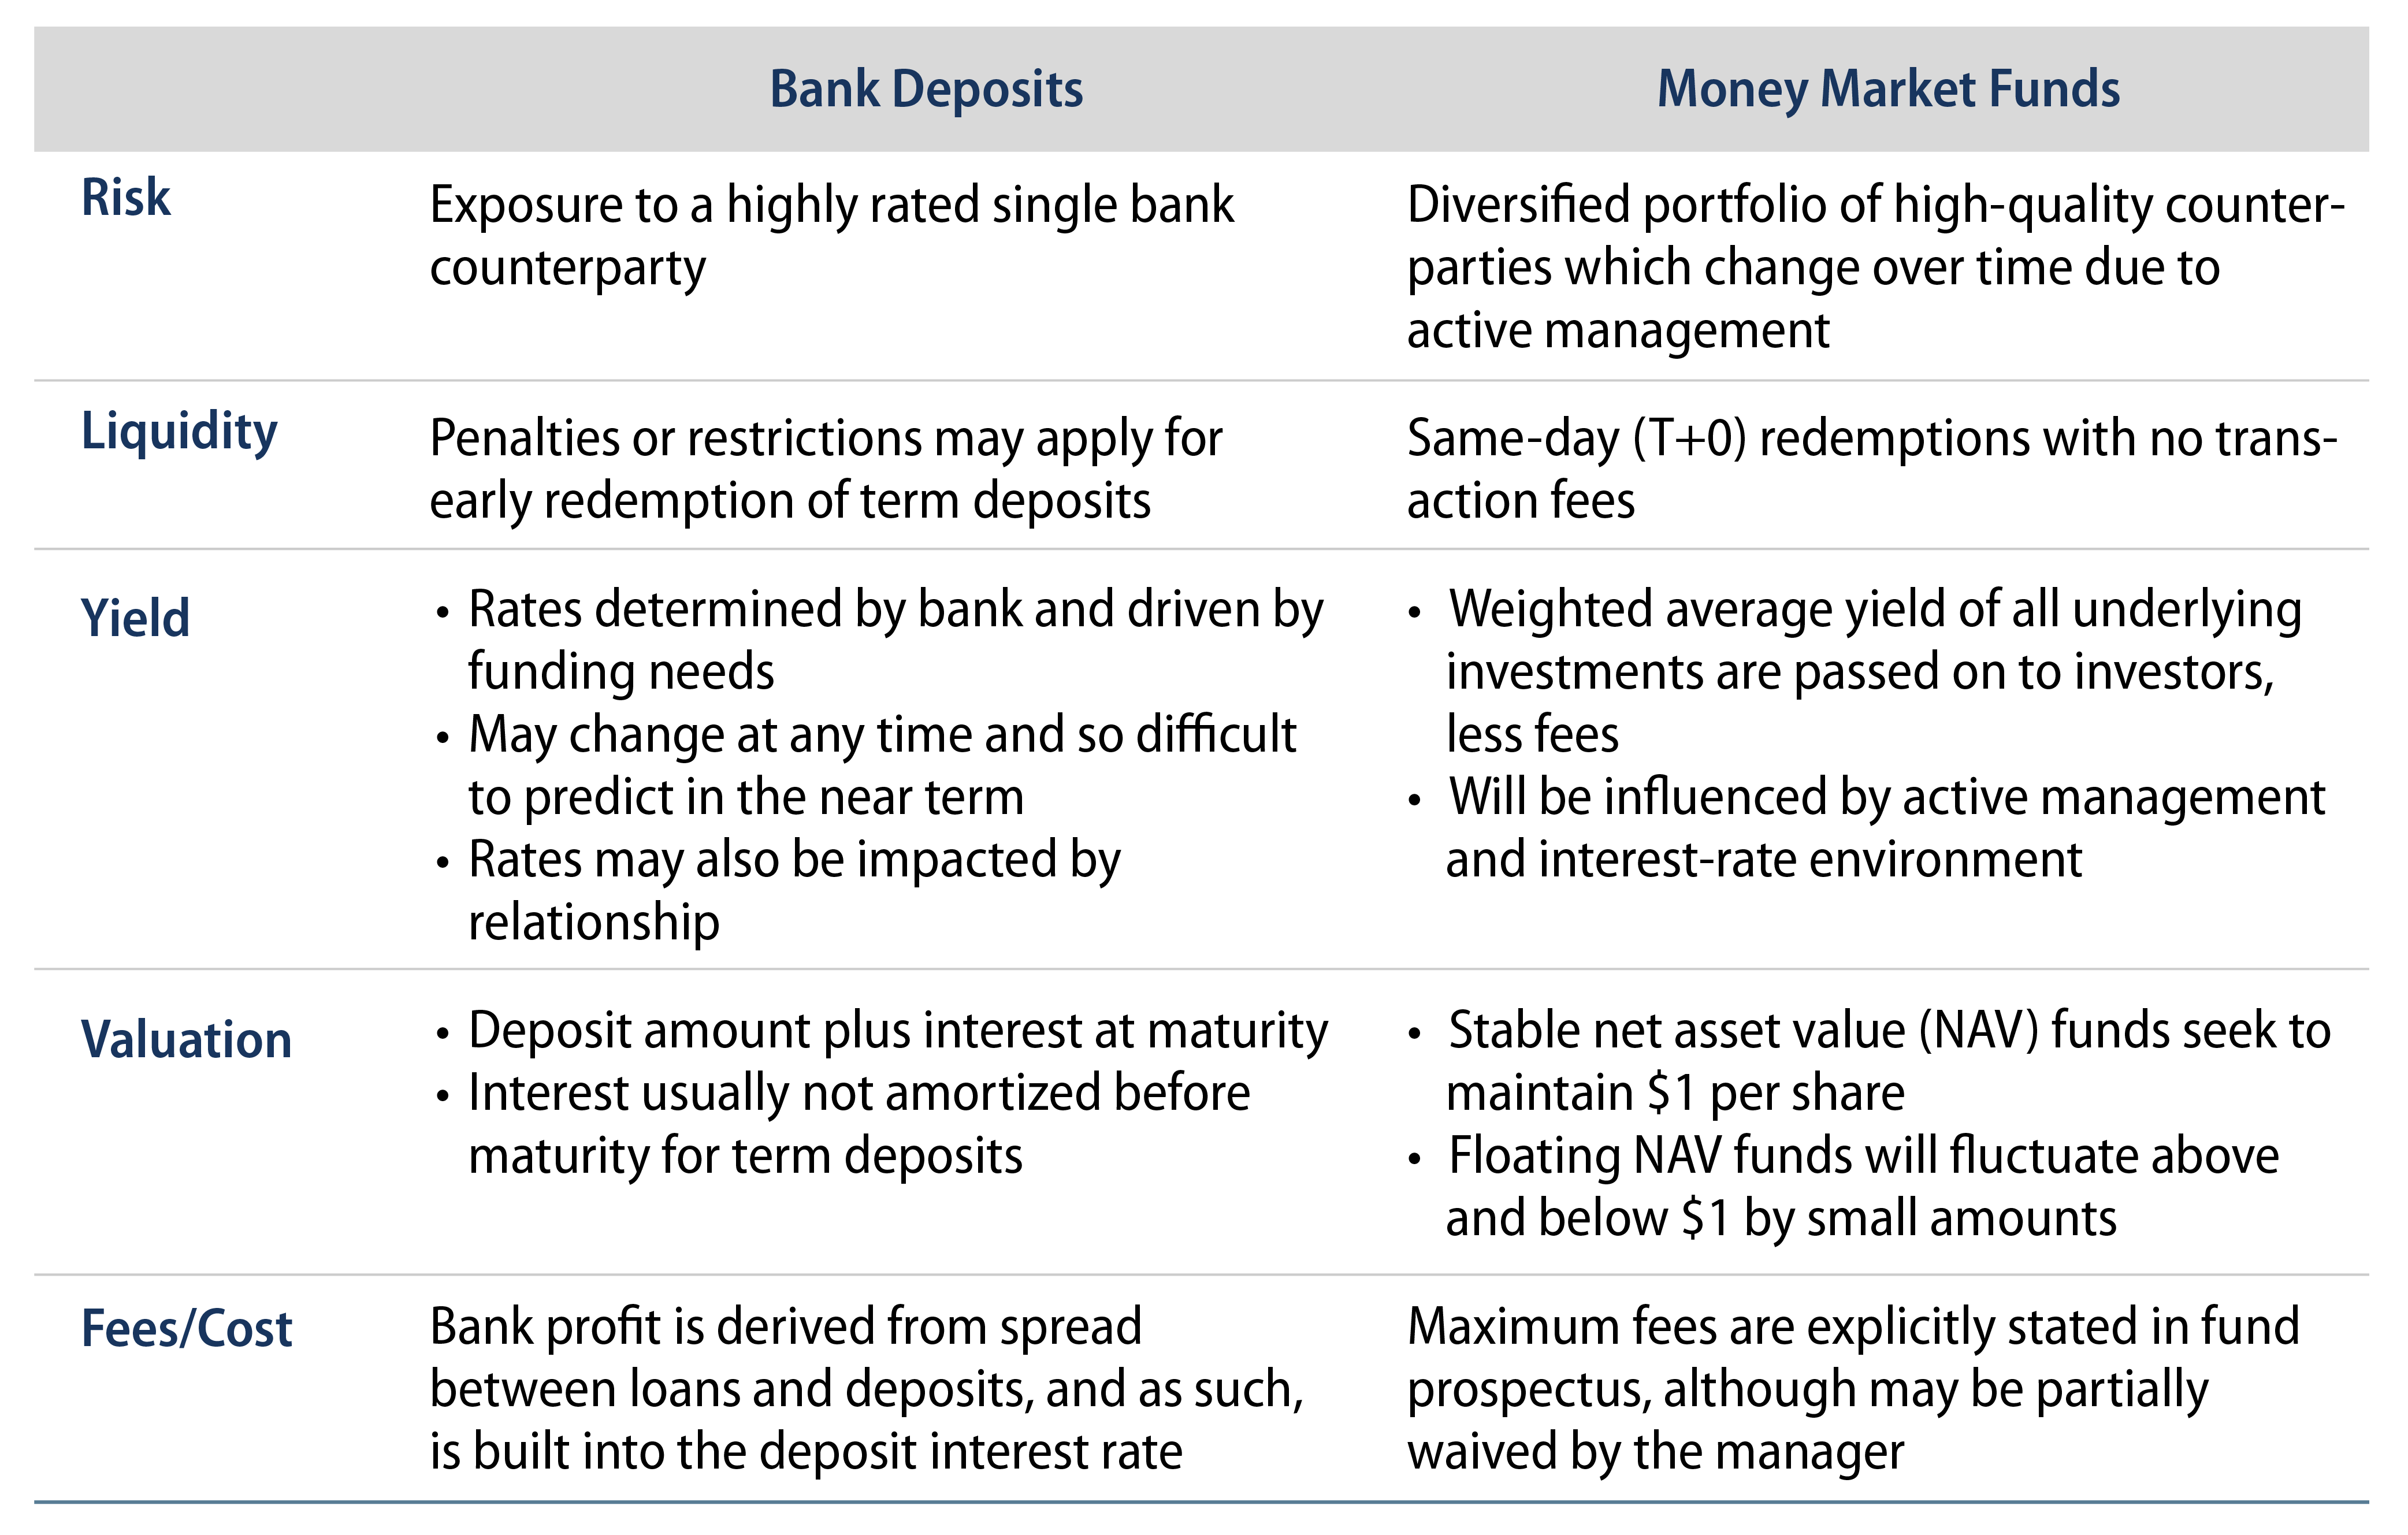
Despite the eventual uptick in betas, the wait will undoubtedly be frustrating for institutions and their staffs, such as corporate treasurers, who continue to need a place to park high cash reserves. Bank deposits, however, are not the only option for cash investors. Money market funds—although offering different risk, return, operational and liquidity attributes—have long been a viable alternative and may be viewed as a suitable complement or replacement if the yield is also attractive (Exhibit 5).

Exhibit 5: Features of Money Market Funds and Bank Deposits
Features of Money Market Funds and Bank Deposits
Source: Western Asset. As of 31 Jul 22. Select the image to expand the view.

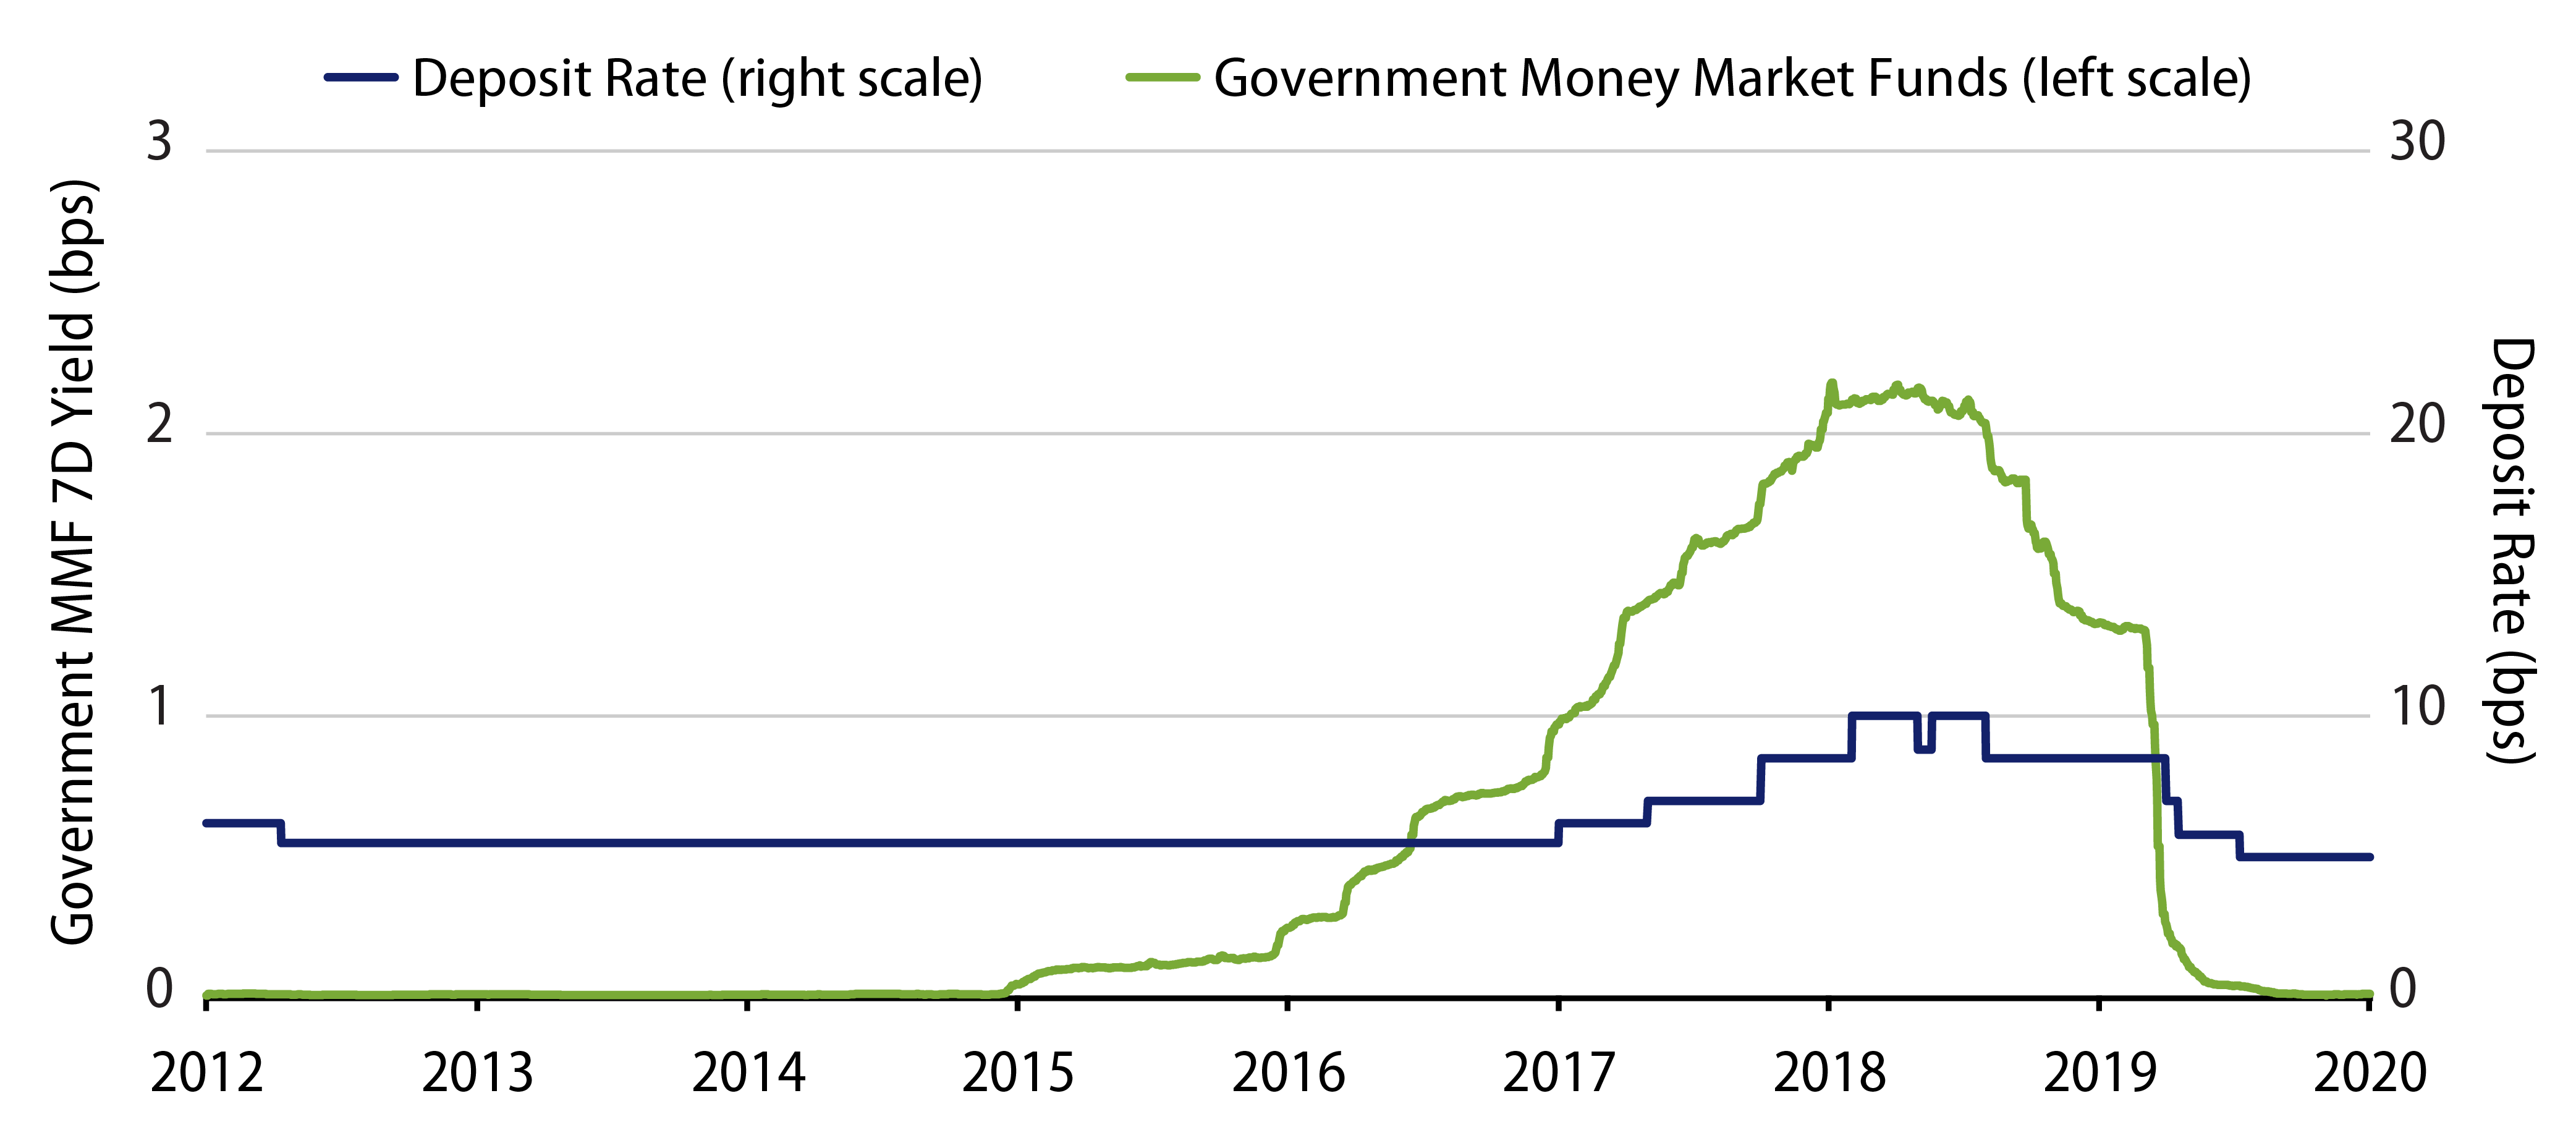
When deposit betas do eventually increase, the expected large volume of operational deposits on bank balance sheets will still remain a significant headwind. This will, in turn, likely cause deposit rates to underperform money market funds once the hiking cycle is well underway. This was certainly witnessed in 2016 during the last tightening cycle, when yields of government style money market funds started to rise off their zero base almost two years before the average deposit rate rose (Exhibit 6).

Exhibit 6: Government Money Market Fund Yield and Large Deposit Rates
Government Money Market Fund Yield and Large Deposit Rates
Source: BofA Global Research, iMoneyNet. As of 09 Feb 22. Select the image to expand the view.

Looking ahead to the current cycle of 2022, it’s important to realize that yields of money market funds stalled at the very beginning of the Fed’s current hiking path as fund fee waivers—which were applied to avoid net negative yields during the multi-year near zero interest rate environment—were slowly reduced and ultimately removed (Exhibit 7).

Exhibit 7: Average 7-Day Yield of Money Market Funds vs. Fed Funds Rate for 2022 Cycle
Average 7-Day Yield of Money Market Funds vs. Fed Funds Rate for 2022 Cycle
Source: iMoneyNet, Bloomberg. As of 31 Jul 22. Select the image to expand the view.

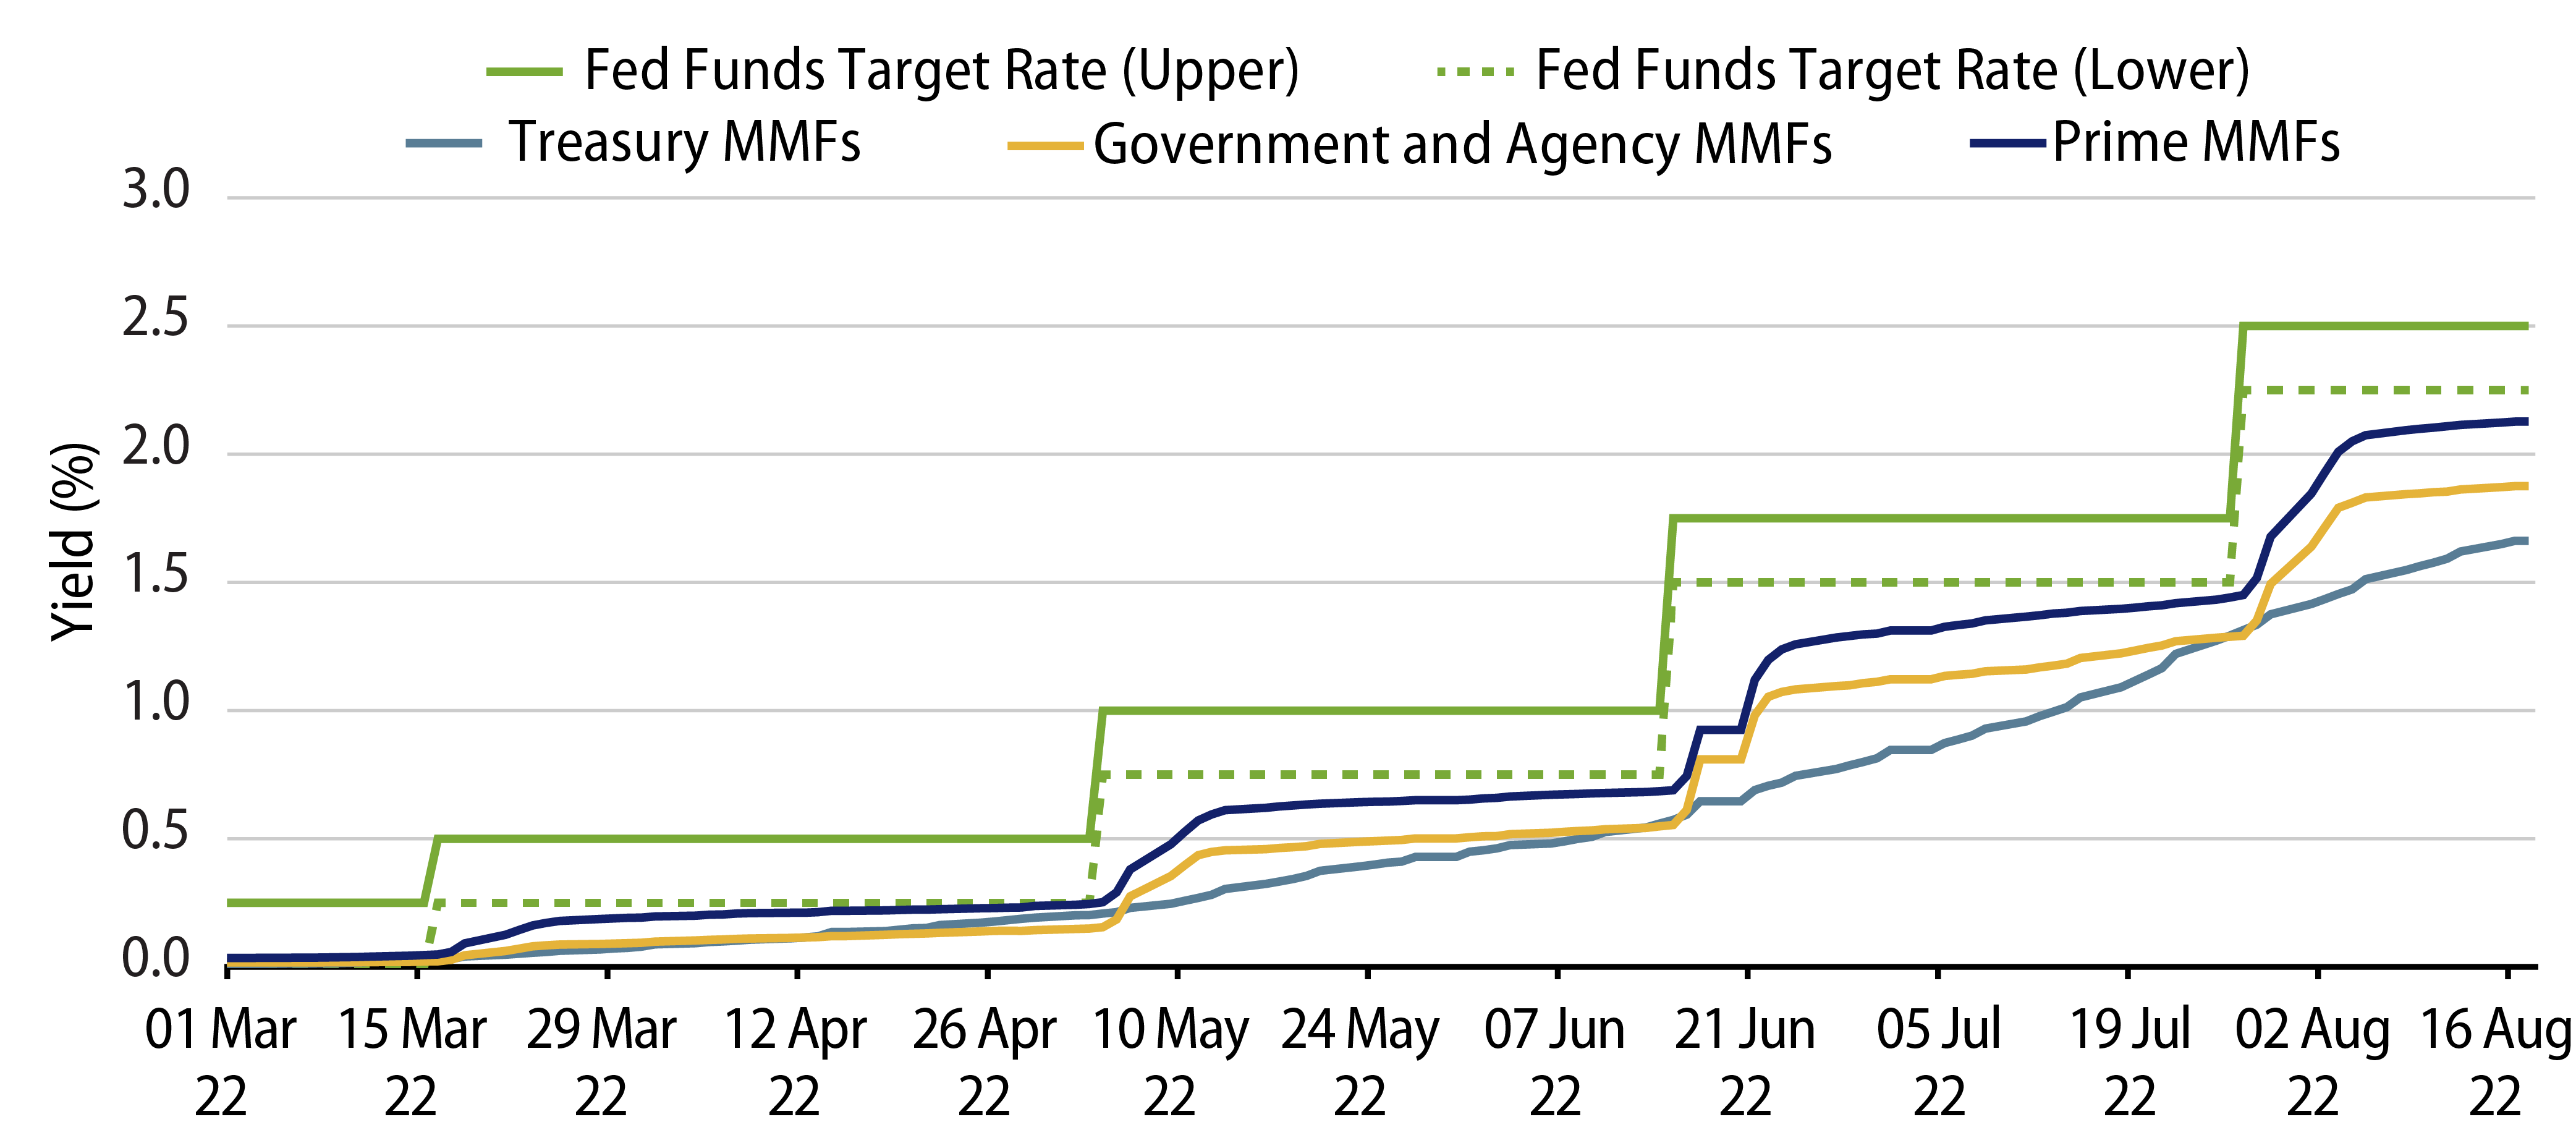
On average, the net seven-day yields of Treasury, government and prime money market funds fully reflected each of the first three rate hikes in 2022 within 36, 33 and 32 days, respectively. Differences between funds were driven by manager decisions such as the average maturity and average life going into the hike announcements. Although both money market funds and deposits exhibit different features and risks which may or may not be suitable for all investors, money market funds historically have outperformed deposits once a tightening path is underway. This suggests that money market funds may represent stiff competition for bank deposits for some time to come.

© Western Asset Management Company, LLC 2024. The information contained in these materials ("the materials") is intended for the exclusive use of the designated recipient ("the recipient"). This information is proprietary and confidential and may contain commercially sensitive information, and may not be copied, reproduced or republished, in whole or in part, without the prior written consent of Western Asset Management Company ("Western Asset").
Past performance does not predict future returns. These materials should not be deemed to be a prediction or projection of future performance. These materials are intended for investment professionals including professional clients, eligible counterparties, and qualified investors only.
These materials have been produced for illustrative and informational purposes only. These materials contain Western Asset's opinions and beliefs as of the date designated on the materials; these views are subject to change and may not reflect real-time market developments and investment views.
Third party data may be used throughout the materials, and this data is believed to be accurate to the best of Western Asset's knowledge at the time of publication, but cannot be guaranteed. These materials may also contain strategy or product awards or rankings from independent third parties or industry publications which are based on unbiased quantitative and/or qualitative information determined independently by each third party or publication. In some cases, Western Asset may subscribe to these third party's standard industry services or publications. These standard subscriptions and services are available to all asset managers and do not influence rankings or awards in any way.
Investment strategies or products discussed herein may involve a high degree of risk, including the loss of some or all capital. Investments in any products or strategies described in these materials may be volatile, and investors should have the financial ability and willingness to accept such risks.
Unless otherwise noted, investment performance contained in these materials is reflective of a strategy composite. All other strategy data and information included in these materials reflects a representative portfolio which is an account in the composite that Western Asset believes most closely reflects the current portfolio management style of the strategy. Performance is not a consideration in the selection of the representative portfolio. The characteristics of the representative portfolio shown may differ from other accounts in the composite. Information regarding the representative portfolio and the other accounts in the composite are available upon request. Statements in these materials should not be considered investment advice. References, either general or specific, to securities and/or issuers in the materials are for illustrative purposes only and are not intended to be, and should not be interpreted as, recommendation to purchase or sell such securities. Employees and/or clients of Western Asset may have a position in the securities or issuers mentioned.
These materials are not intended to provide, and should not be relied on for, accounting, legal, tax, investment or other advice. The recipient should consult its own counsel, accountant, investment, tax, and any other advisers for this advice, including economic risks and merits, related to making an investment with Western Asset. The recipient is responsible for observing the applicable laws and regulations of their country of residence.
Founded in 1971, Western Asset Management Company is a global fixed-income investment manager with offices in Pasadena, New York, London, Singapore, Tokyo, Melbourne, São Paulo, Hong Kong, and Zürich. Western Asset is a wholly owned subsidiary of Franklin Resources, Inc. but operates autonomously. Western Asset is comprised of six legal entities across the globe, each with distinct regional registrations: Western Asset Management Company, LLC, a registered Investment Adviser with the Securities and Exchange Commission; Western Asset Management Company Distribuidora de Títulos e Valores Mobiliários Limitada is authorized and regulated by Comissão de Valores Mobiliários and Brazilian Central Bank; Western Asset Management Company Pty Ltd ABN 41 117 767 923 is the holder of the Australian Financial Services License 303160; Western Asset Management Company Pte. Ltd. Co. Reg. No. 200007692R is a holder of a Capital Markets Services License for fund management and regulated by the Monetary Authority of Singapore; Western Asset Management Company Ltd, a registered Financial Instruments Business Operator and regulated by the Financial Services Agency of Japan; and Western Asset Management Company Limited is authorised and regulated by the Financial Conduct Authority ("FCA") (FRN 145930). This communication is intended for distribution to Professional Clients only if deemed to be a financial promotion in the UK as defined by the FCA. This communication may also be intended for certain EEA countries where Western Asset has been granted permission to do so. For the current list of the approved EEA countries please contact Western Asset at +44 (0)20 7422 3000.