The composition of traditional US banks was fundamentally reshaped by the fallout from the global financial crisis. Through strict and pragmatic regulation, balance sheets became simpler, safer and stronger to benefit all stakeholders. This positive seismic shift was especially important during the recent COVID-19 pandemic when banks played an important role as part of the economic solution put in place by the world’s central banks.
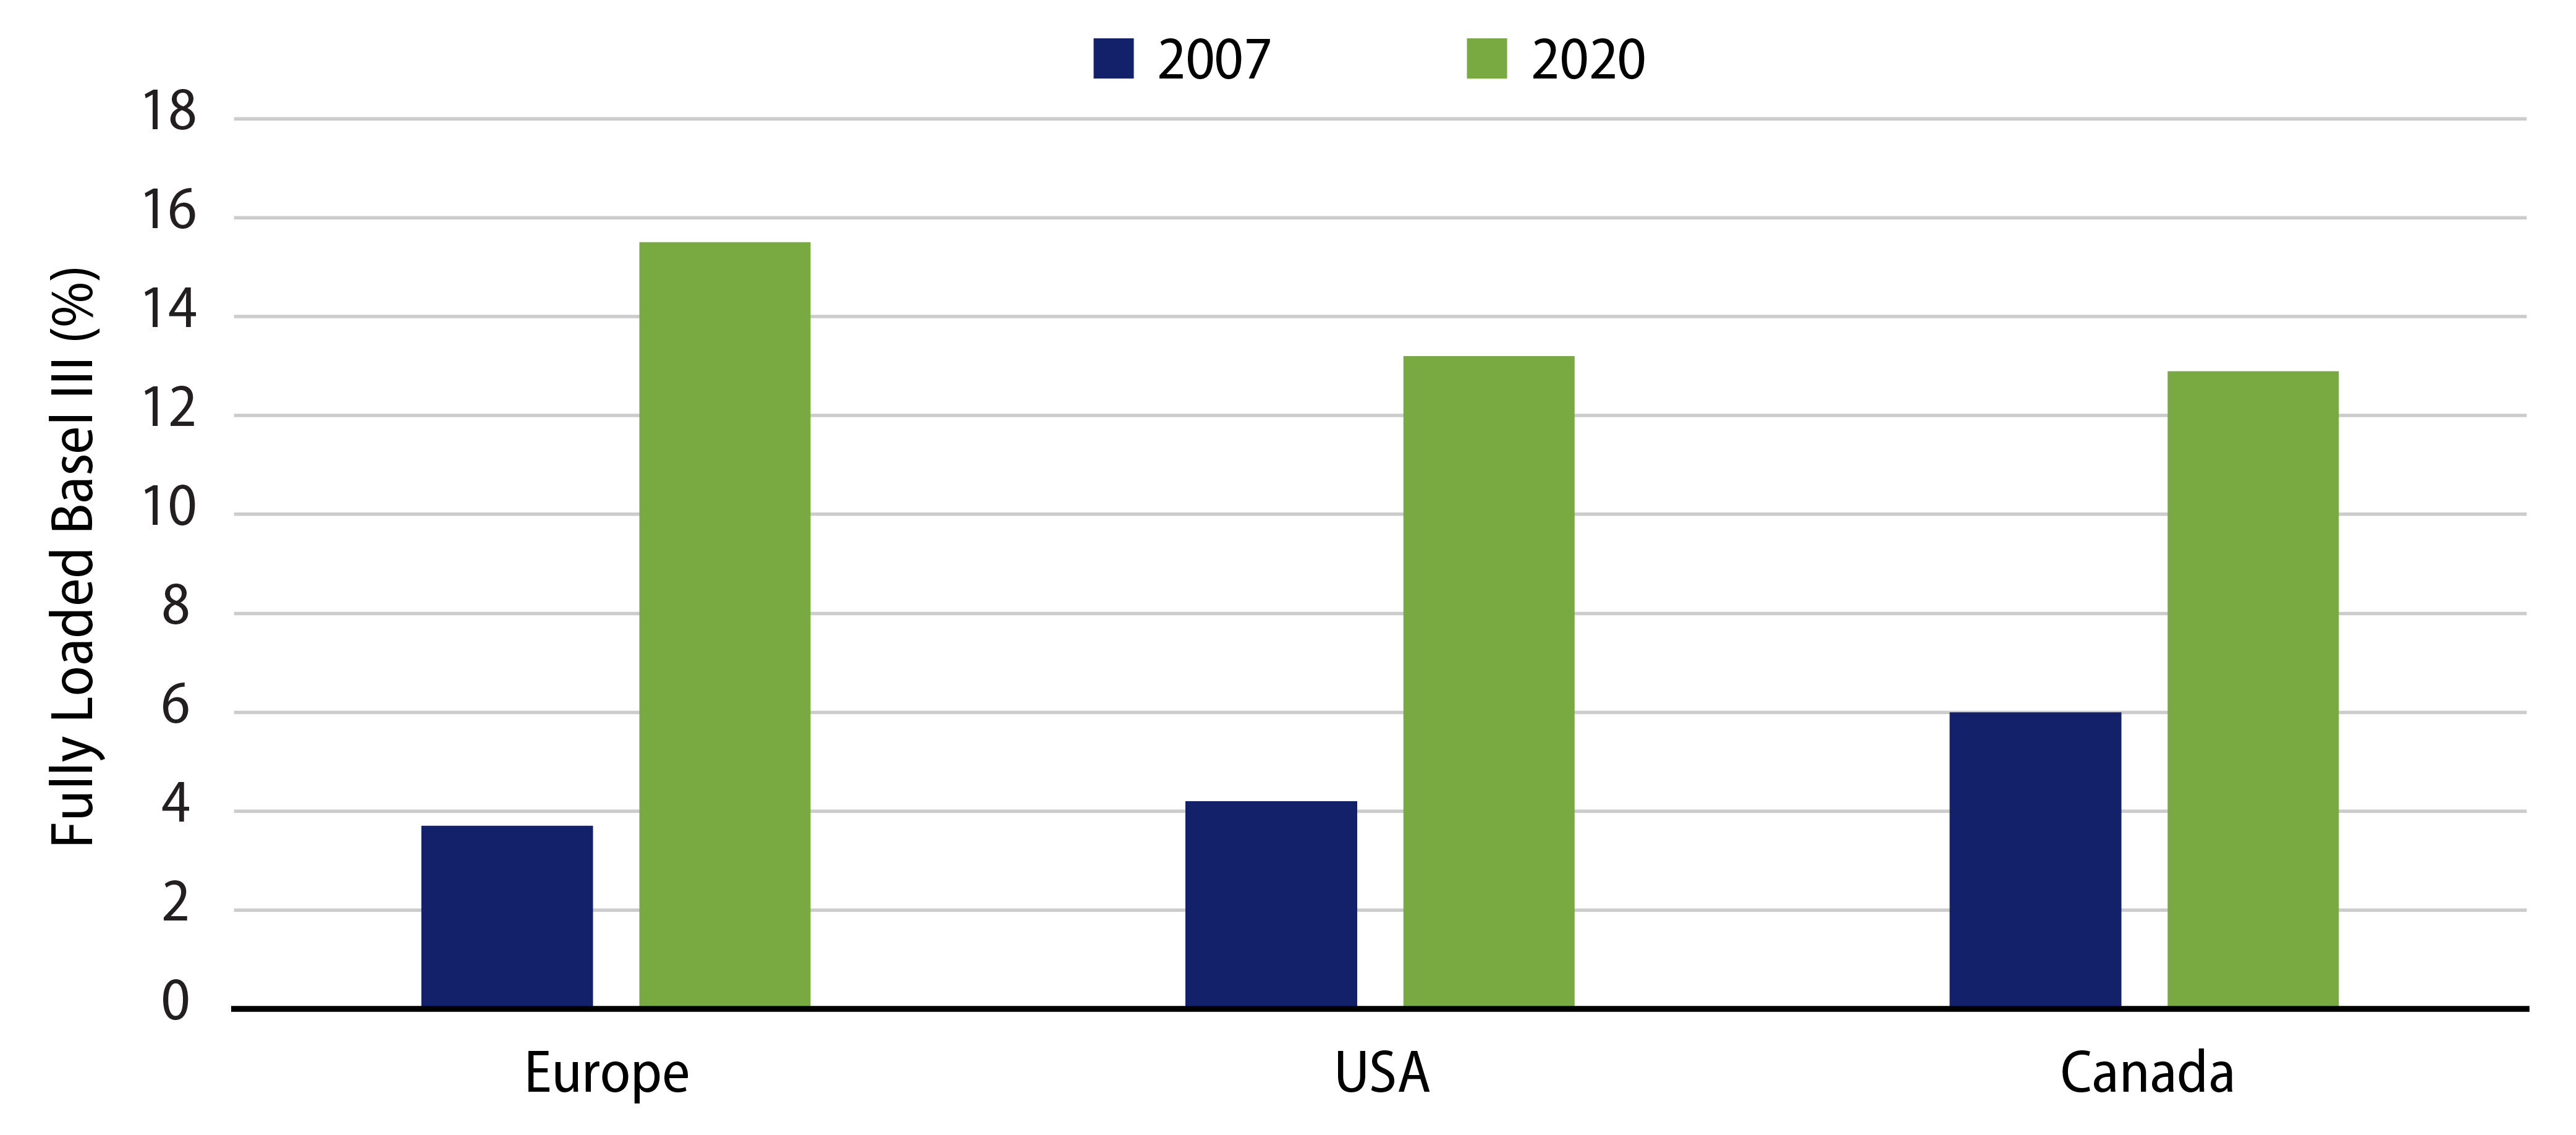
US bank balance sheets are now arguably the strongest they’ve been in decades and surprisingly stronger than they were pre-Covid. Record earnings combined with the Federal Reserve’s quantitative easing program resulted in banks coming out of the crisis with strong capital ratios (Exhibit 1).
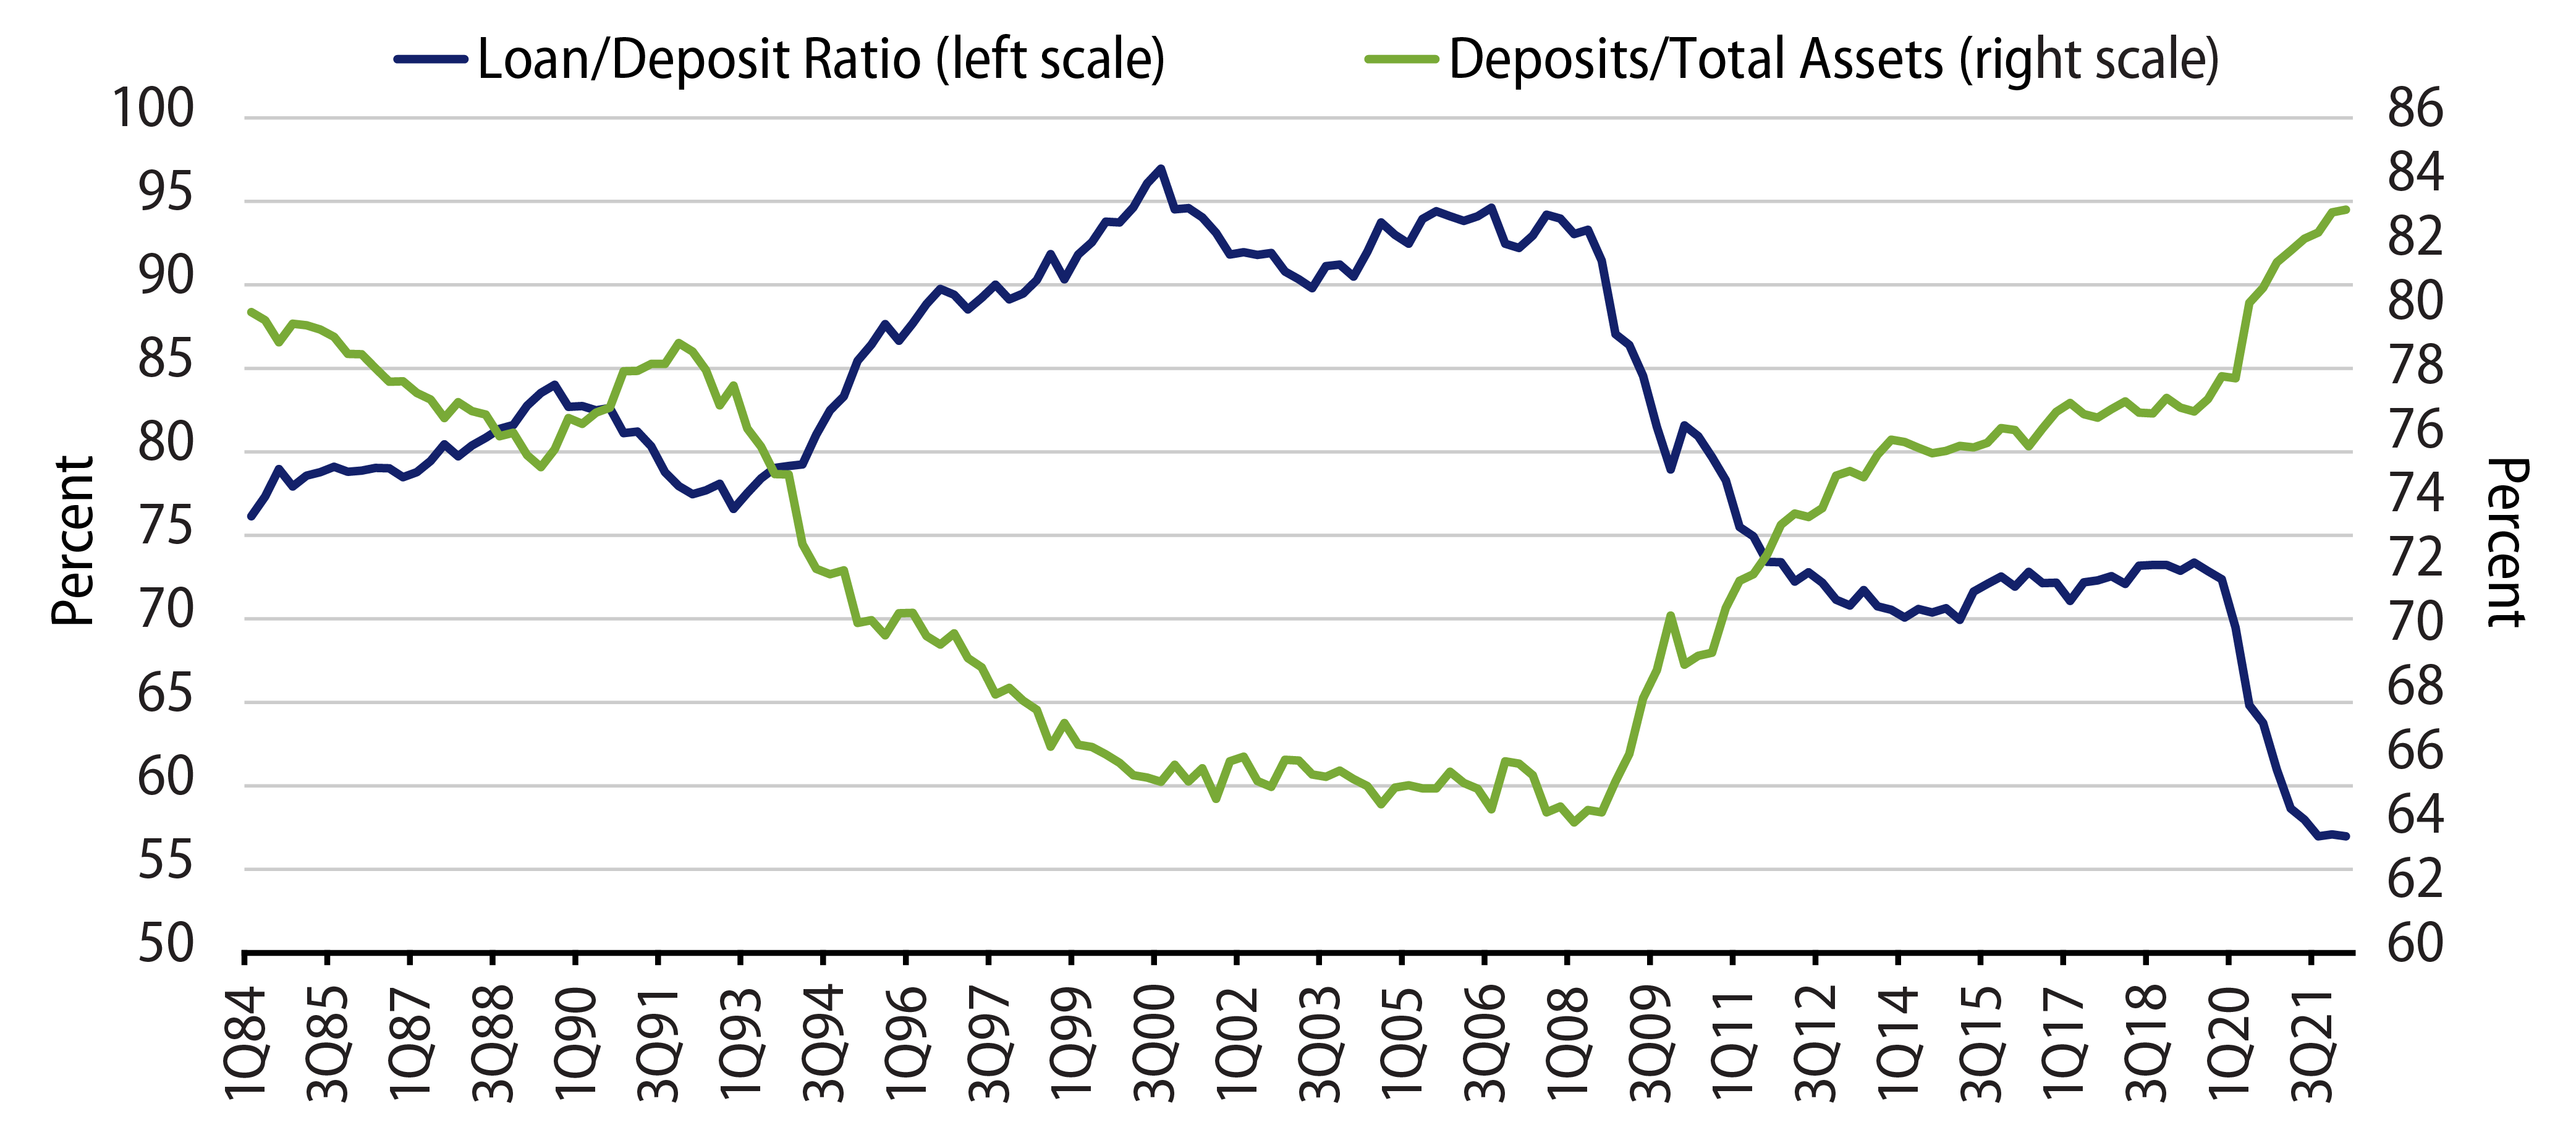
Bank funding entering 2022 continued to be the most conservative in decades with a 57% loan/deposit ratio, all-time-low average funding costs of 15 bps and a record-low 52% loans/earning assets ratio compared to the longer-term average of 68%. Deposits now fund 83% of bank industry assets versus 65% in 2008, the highest proportion since 1993.
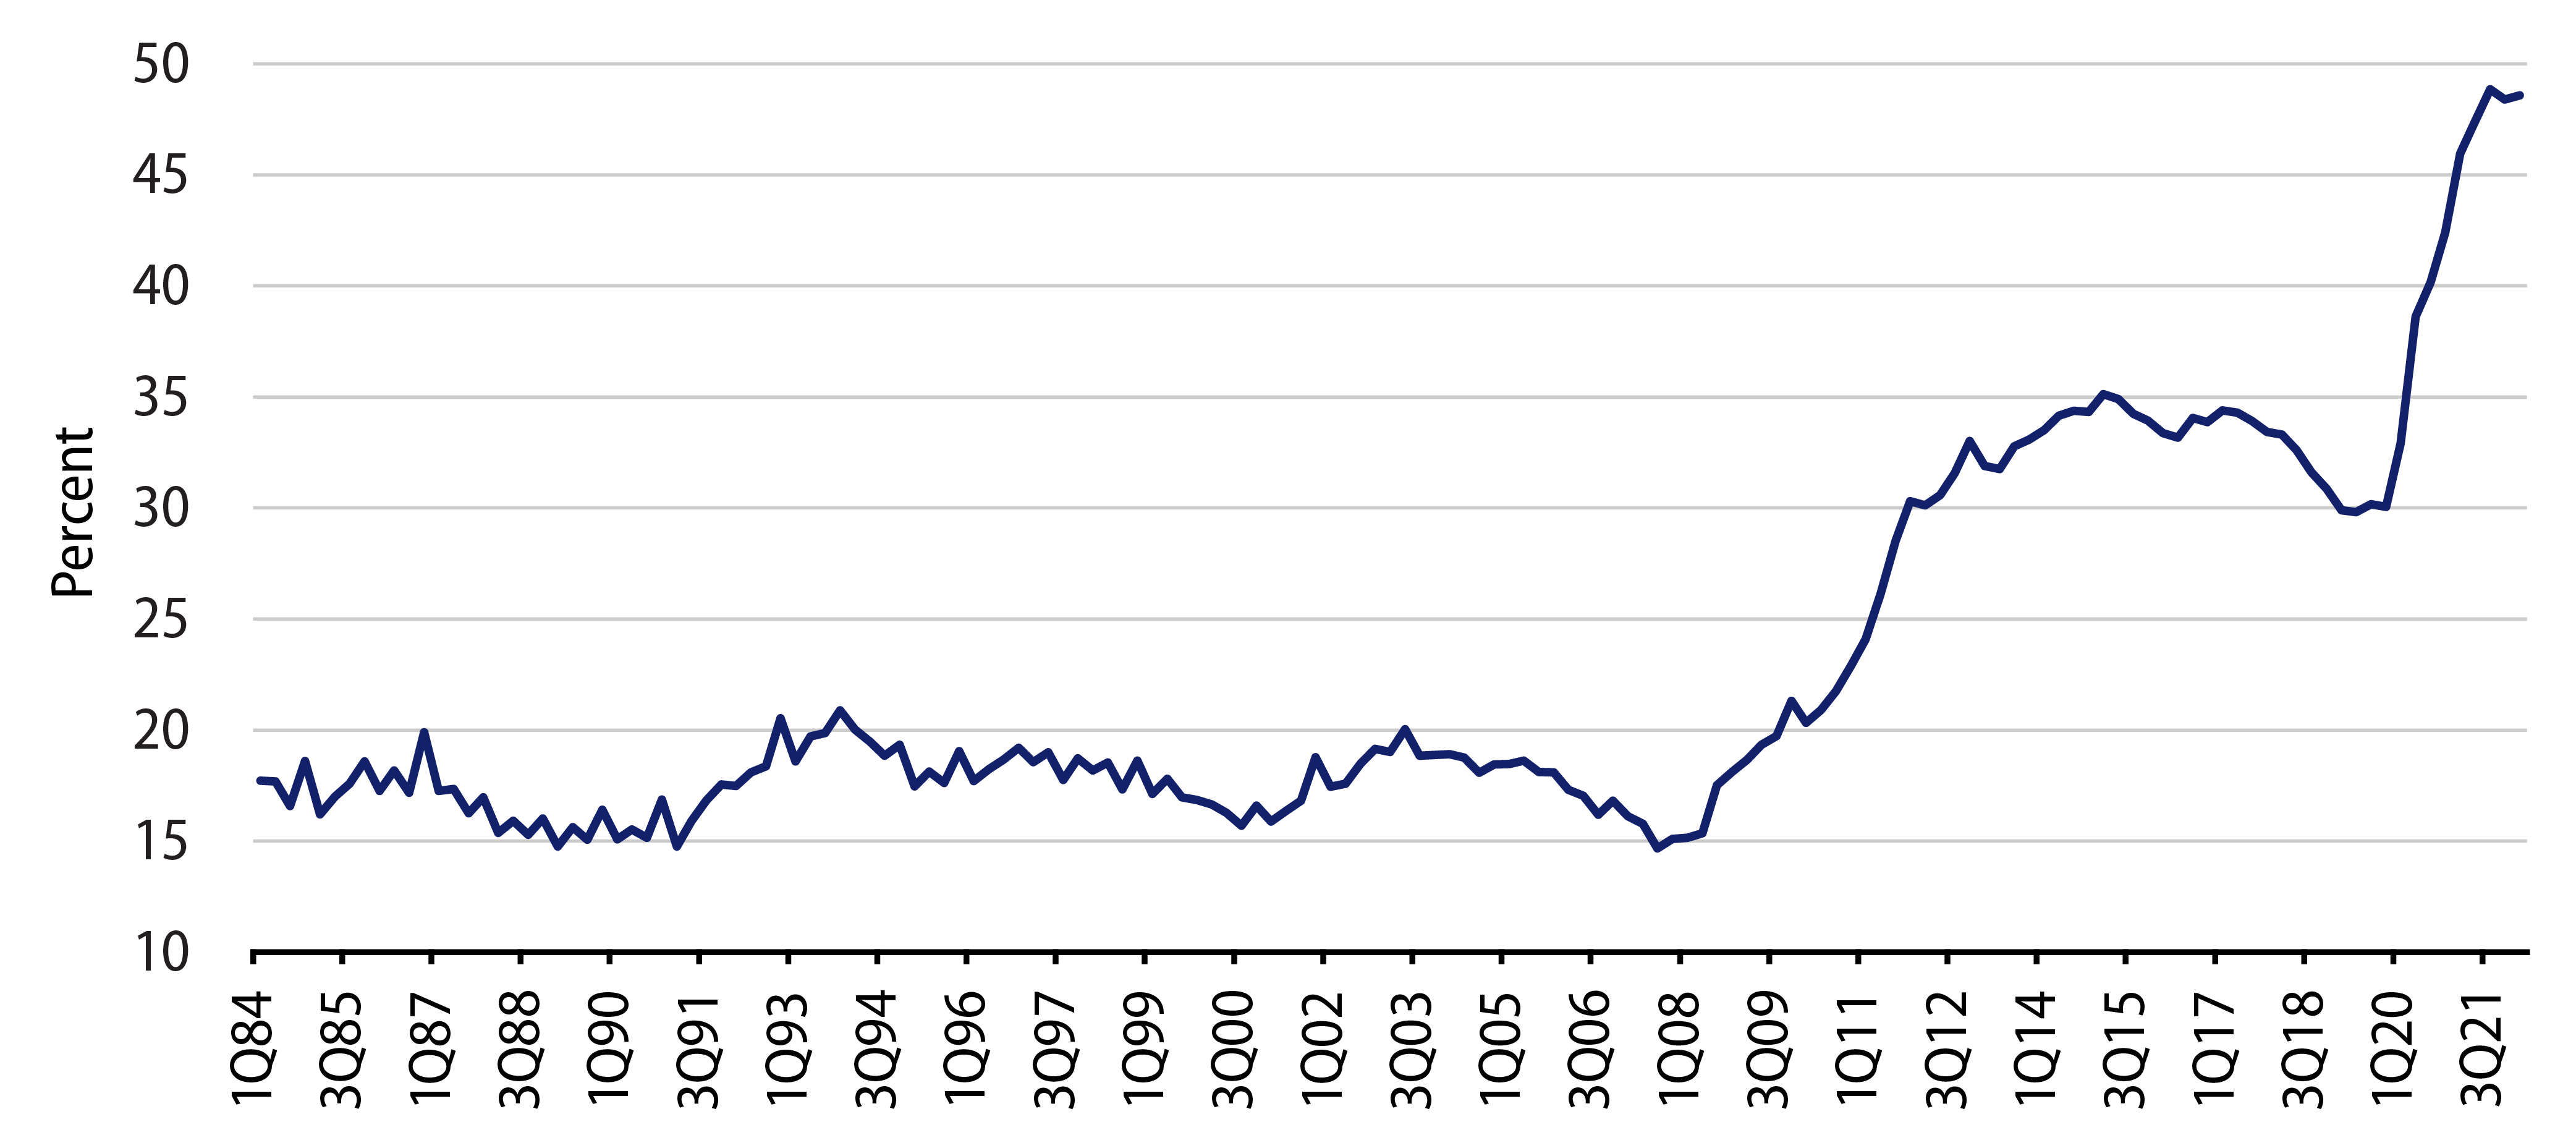
In fact, deposit growth of $5.2 trillion over the past nine quarters equals the deposit growth of all the past 10 years combined. This has led to deposits now exceeding loans by a record gap of $8.5 trillion, representing more than 15 years of average annual loan growth of 4% to 5% (Exhibits 2 and 3).
Parallel to this credit-positive environment, these structural changes have also had an impact on the correlation between the fed funds rate and US bank deposit interest rates, also known as “deposit betas.” Although at the start of 2022 US banks positioned themselves well for the prospect of higher rates and the subsequent expansion of net interest margins, this did not necessarily mean that these higher rates would be completely passed on to depositors. In fact, the record-high deposit balances have led to betas that were below market expectations in the current central bank rate-tightening cycle, and this will be especially true for non-operational deposits with the largest banks as well as deposits from retail customers.
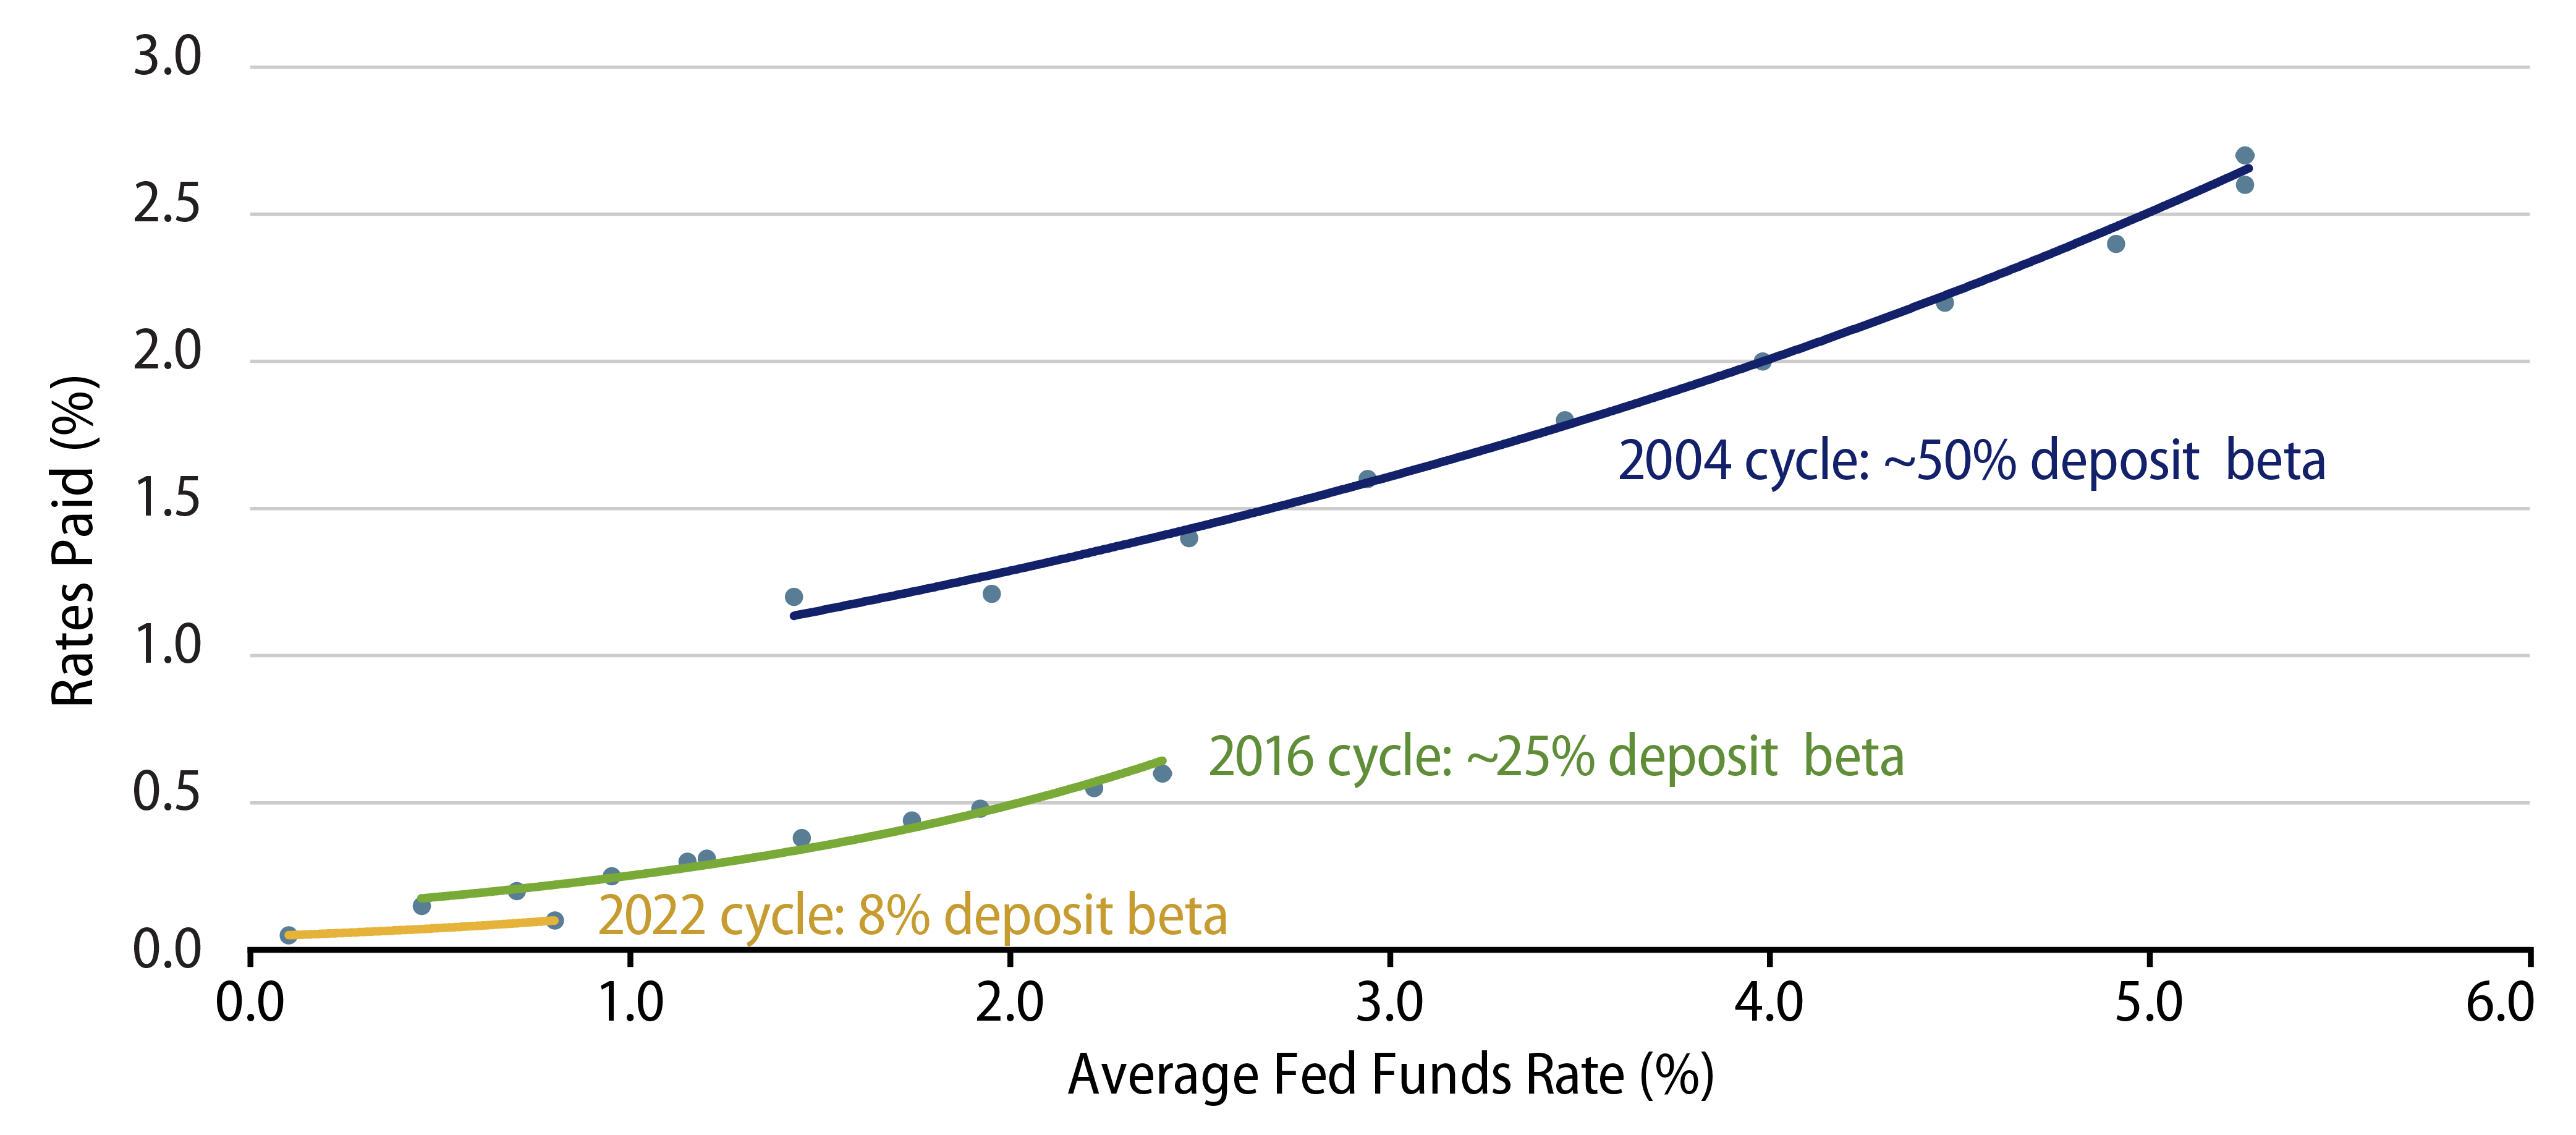
So far in 2022, as expected, deposit betas have been comparatively low in relation to prior tightening cycles. The 2004-2006 tightening cycle showed a beta close to 50% and the 2016-2018 cycle beta was close to 25%, but the first two quarters of the 2022 cycle have so far only exhibited a beta close to 8% (Exhibit 4).
The total amount of deposits is not the sole factor driving betas; banks are also concerned with the source of funding. Non-operational deposits are treated less favorably under banking regulation such as Basel III. As a result, banks are keen to reduce these deposit types where possible by setting interest rates at less competitive levels. It is expected that once this reduction has reached suitable targets, deposit betas will reset slightly higher as banks will aim to retain the more valuable operational deposits where possible.
Despite the eventual uptick in betas, the wait will undoubtedly be frustrating for institutions and their staffs, such as corporate treasurers, who continue to need a place to park high cash reserves. Bank deposits, however, are not the only option for cash investors. Money market funds—although offering different risk, return, operational and liquidity attributes—have long been a viable alternative and may be viewed as a suitable complement or replacement if the yield is also attractive (Exhibit 5).
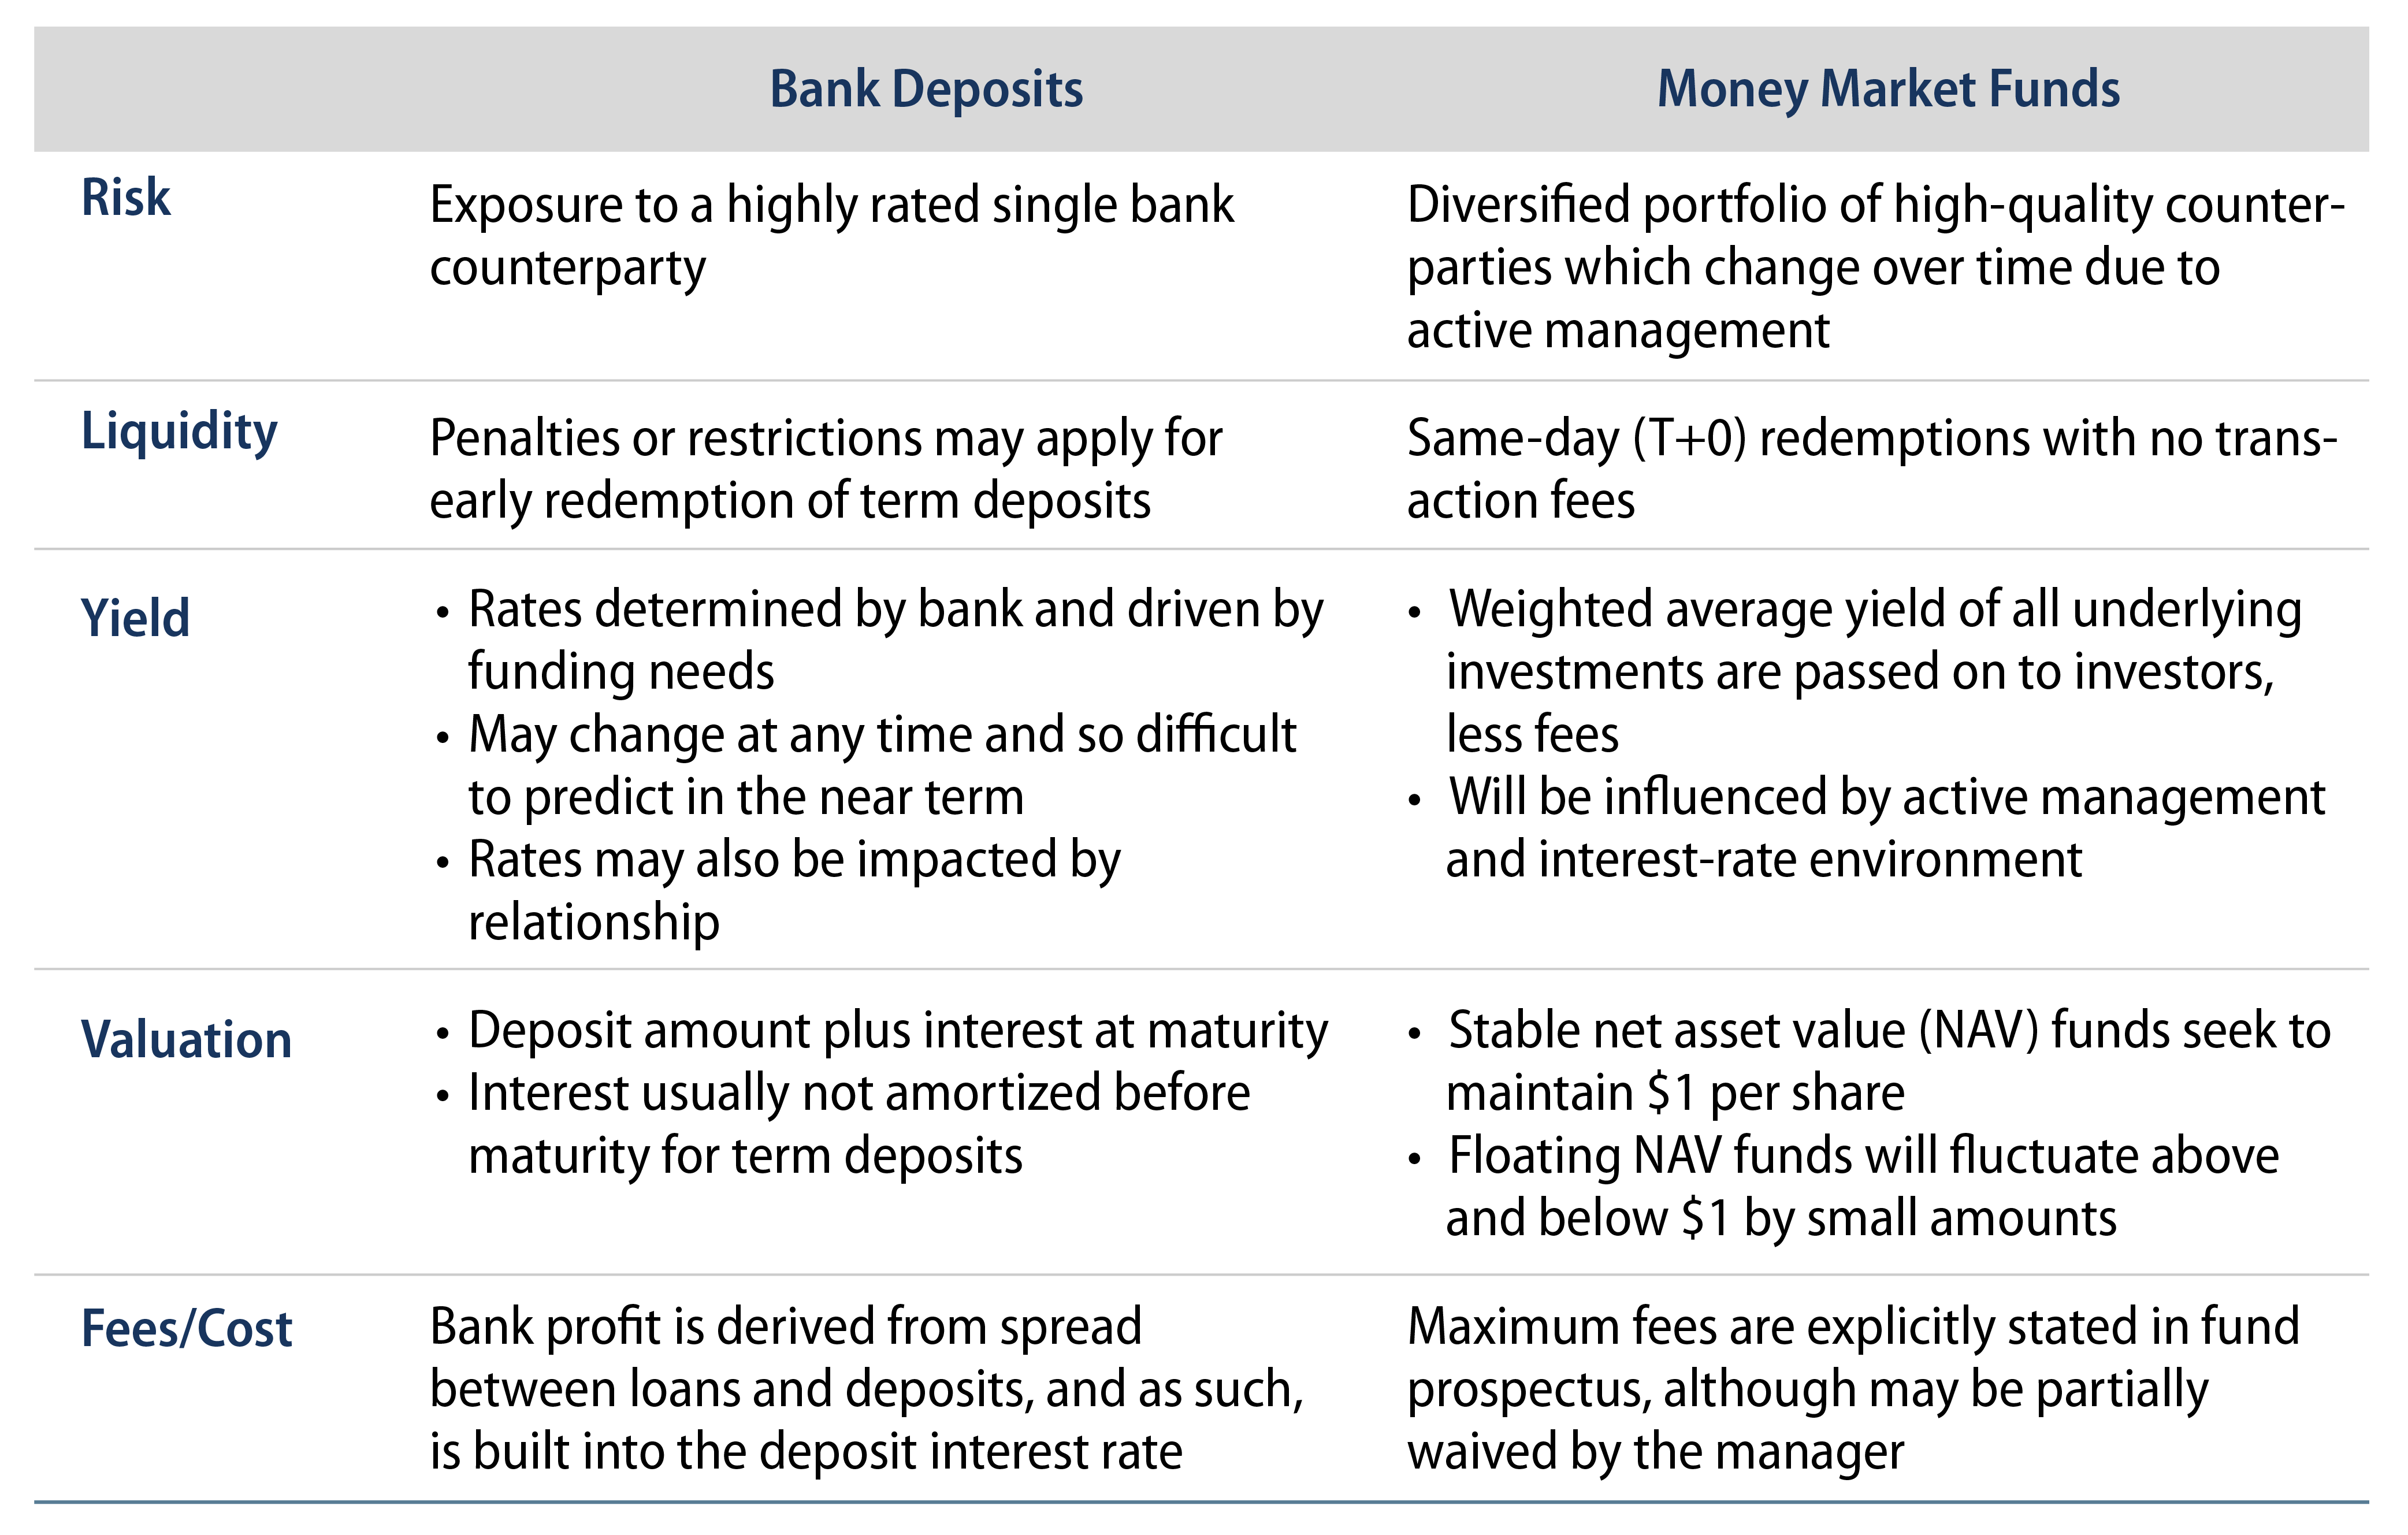
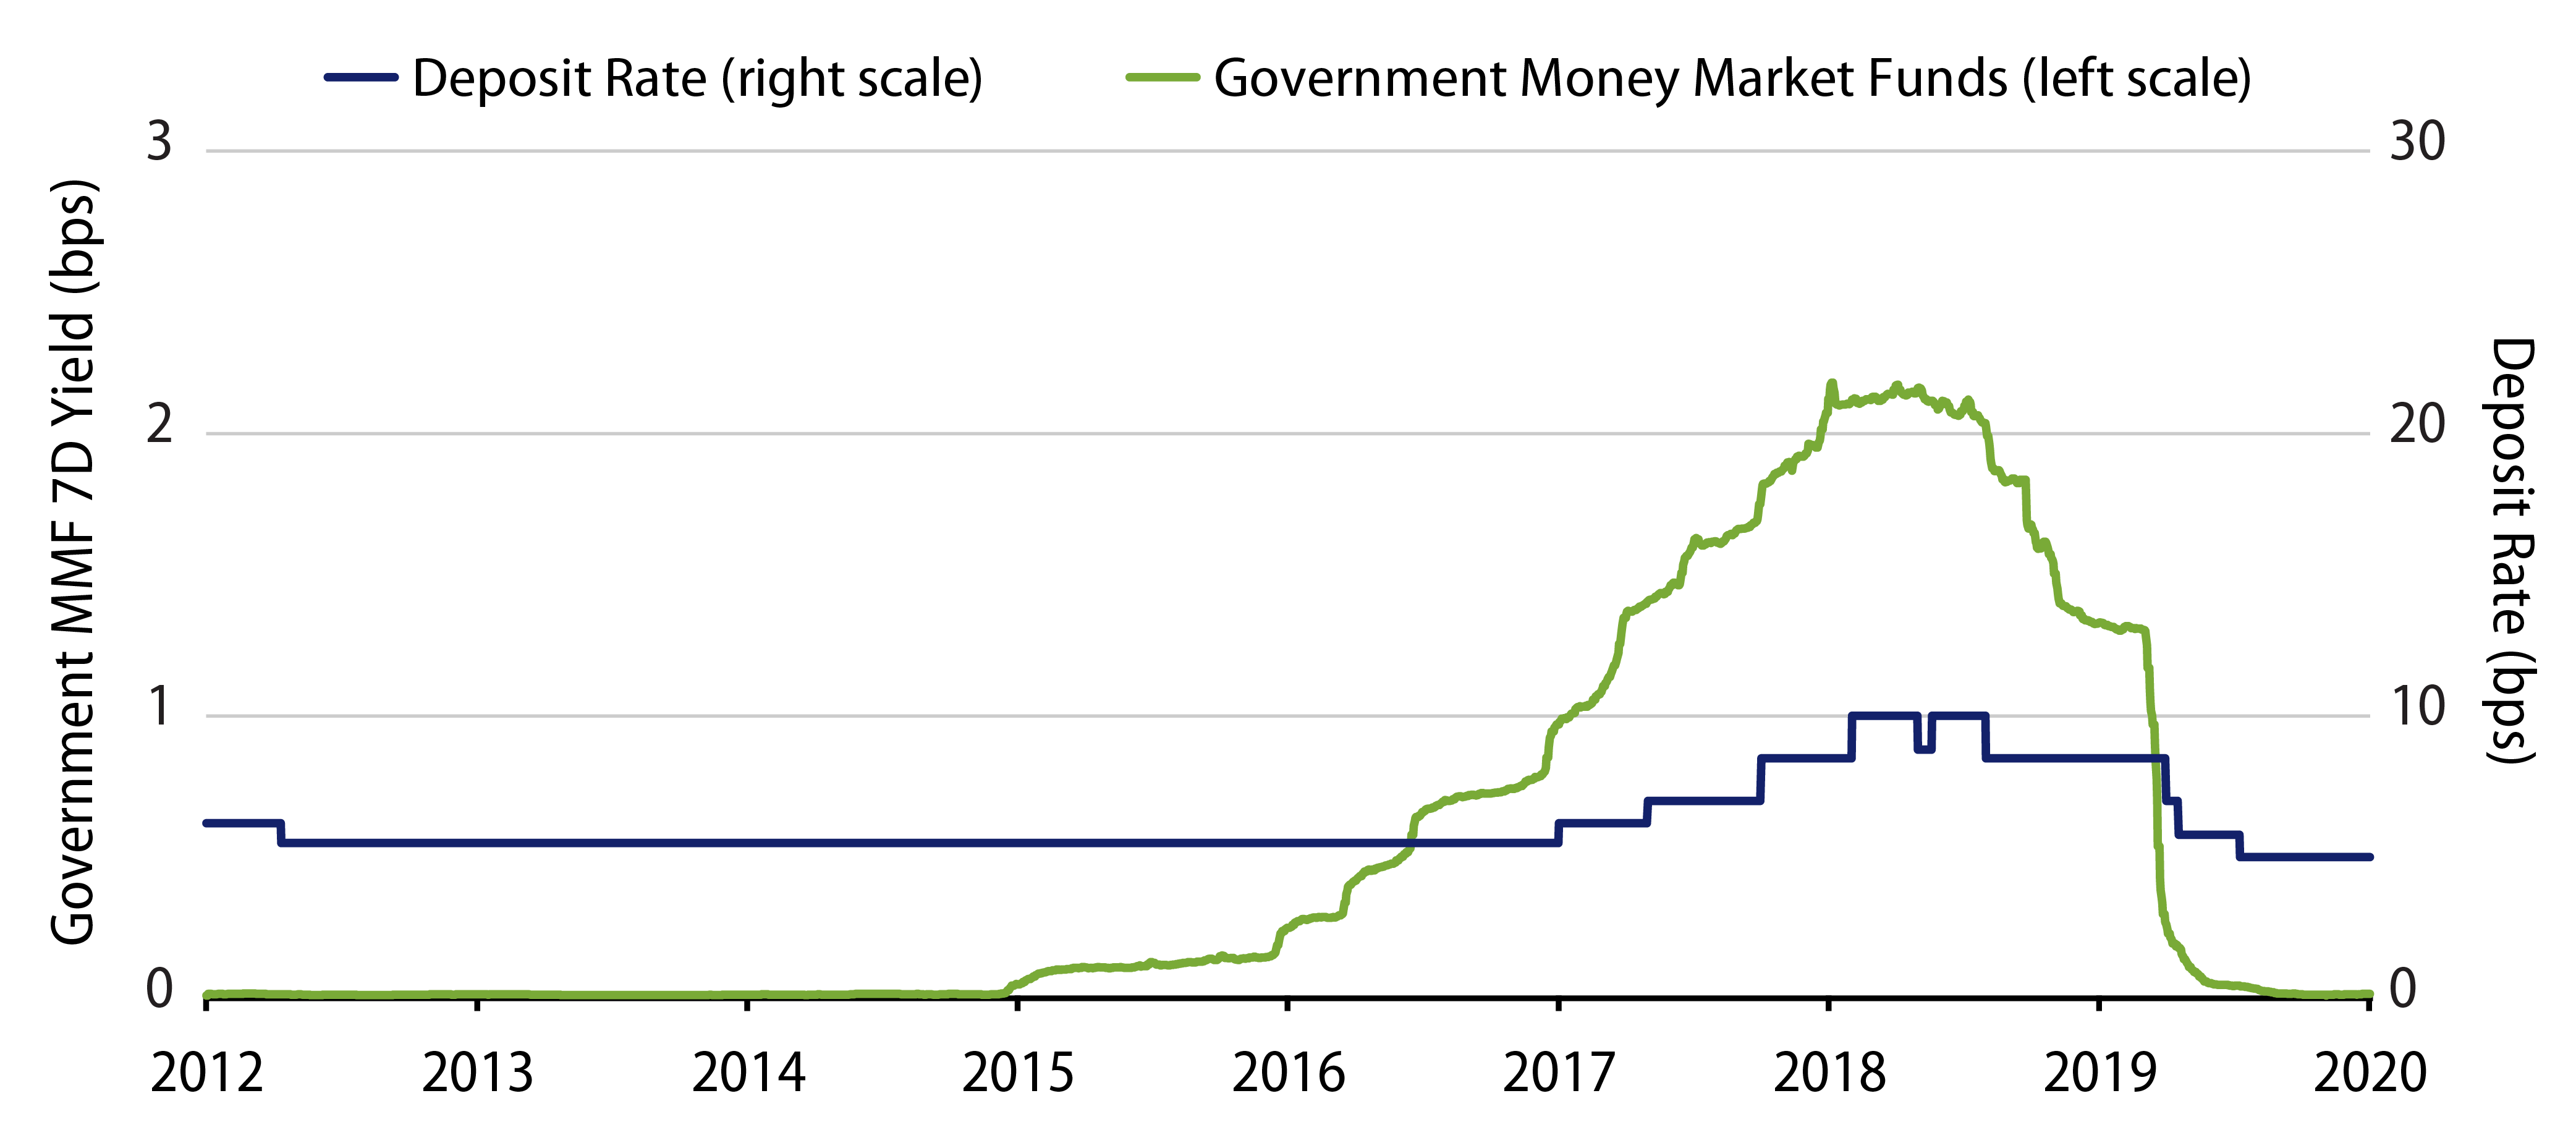
When deposit betas do eventually increase, the expected large volume of operational deposits on bank balance sheets will still remain a significant headwind. This will, in turn, likely cause deposit rates to underperform money market funds once the hiking cycle is well underway. This was certainly witnessed in 2016 during the last tightening cycle, when yields of government style money market funds started to rise off their zero base almost two years before the average deposit rate rose (Exhibit 6).
Looking ahead to the current cycle of 2022, it’s important to realize that yields of money market funds stalled at the very beginning of the Fed’s current hiking path as fund fee waivers—which were applied to avoid net negative yields during the multi-year near zero interest rate environment—were slowly reduced and ultimately removed (Exhibit 7).
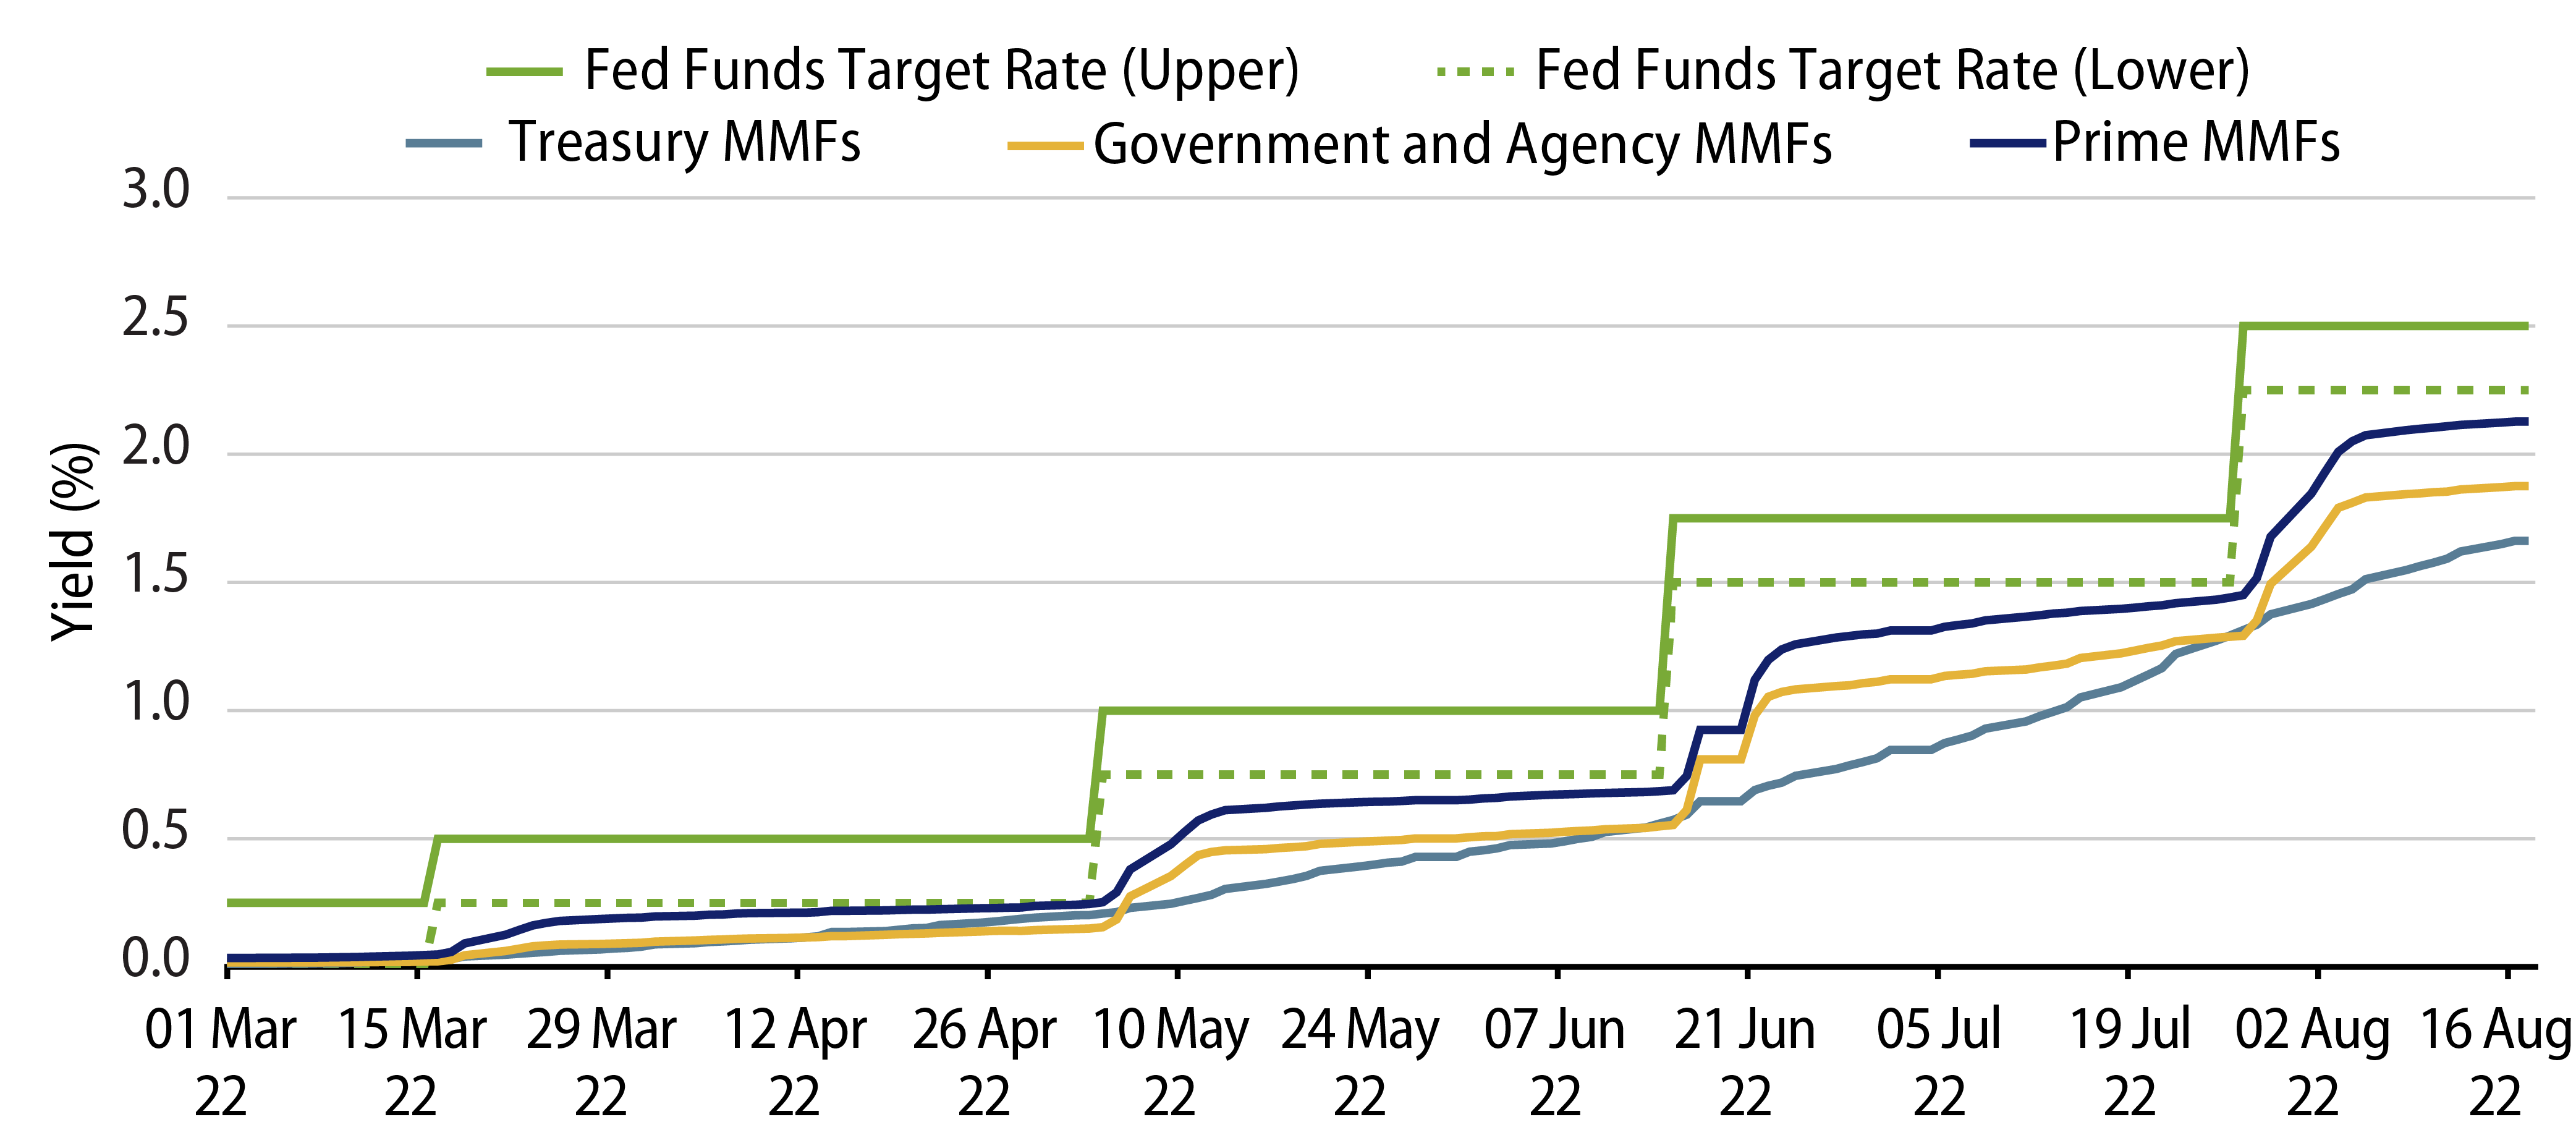
On average, the net seven-day yields of Treasury, government and prime money market funds fully reflected each of the first three rate hikes in 2022 within 36, 33 and 32 days, respectively. Differences between funds were driven by manager decisions such as the average maturity and average life going into the hike announcements. Although both money market funds and deposits exhibit different features and risks which may or may not be suitable for all investors, money market funds historically have outperformed deposits once a tightening path is underway. This suggests that money market funds may represent stiff competition for bank deposits for some time to come.


