Municipal Yields Moved Lower Across the Curve with Treasuries
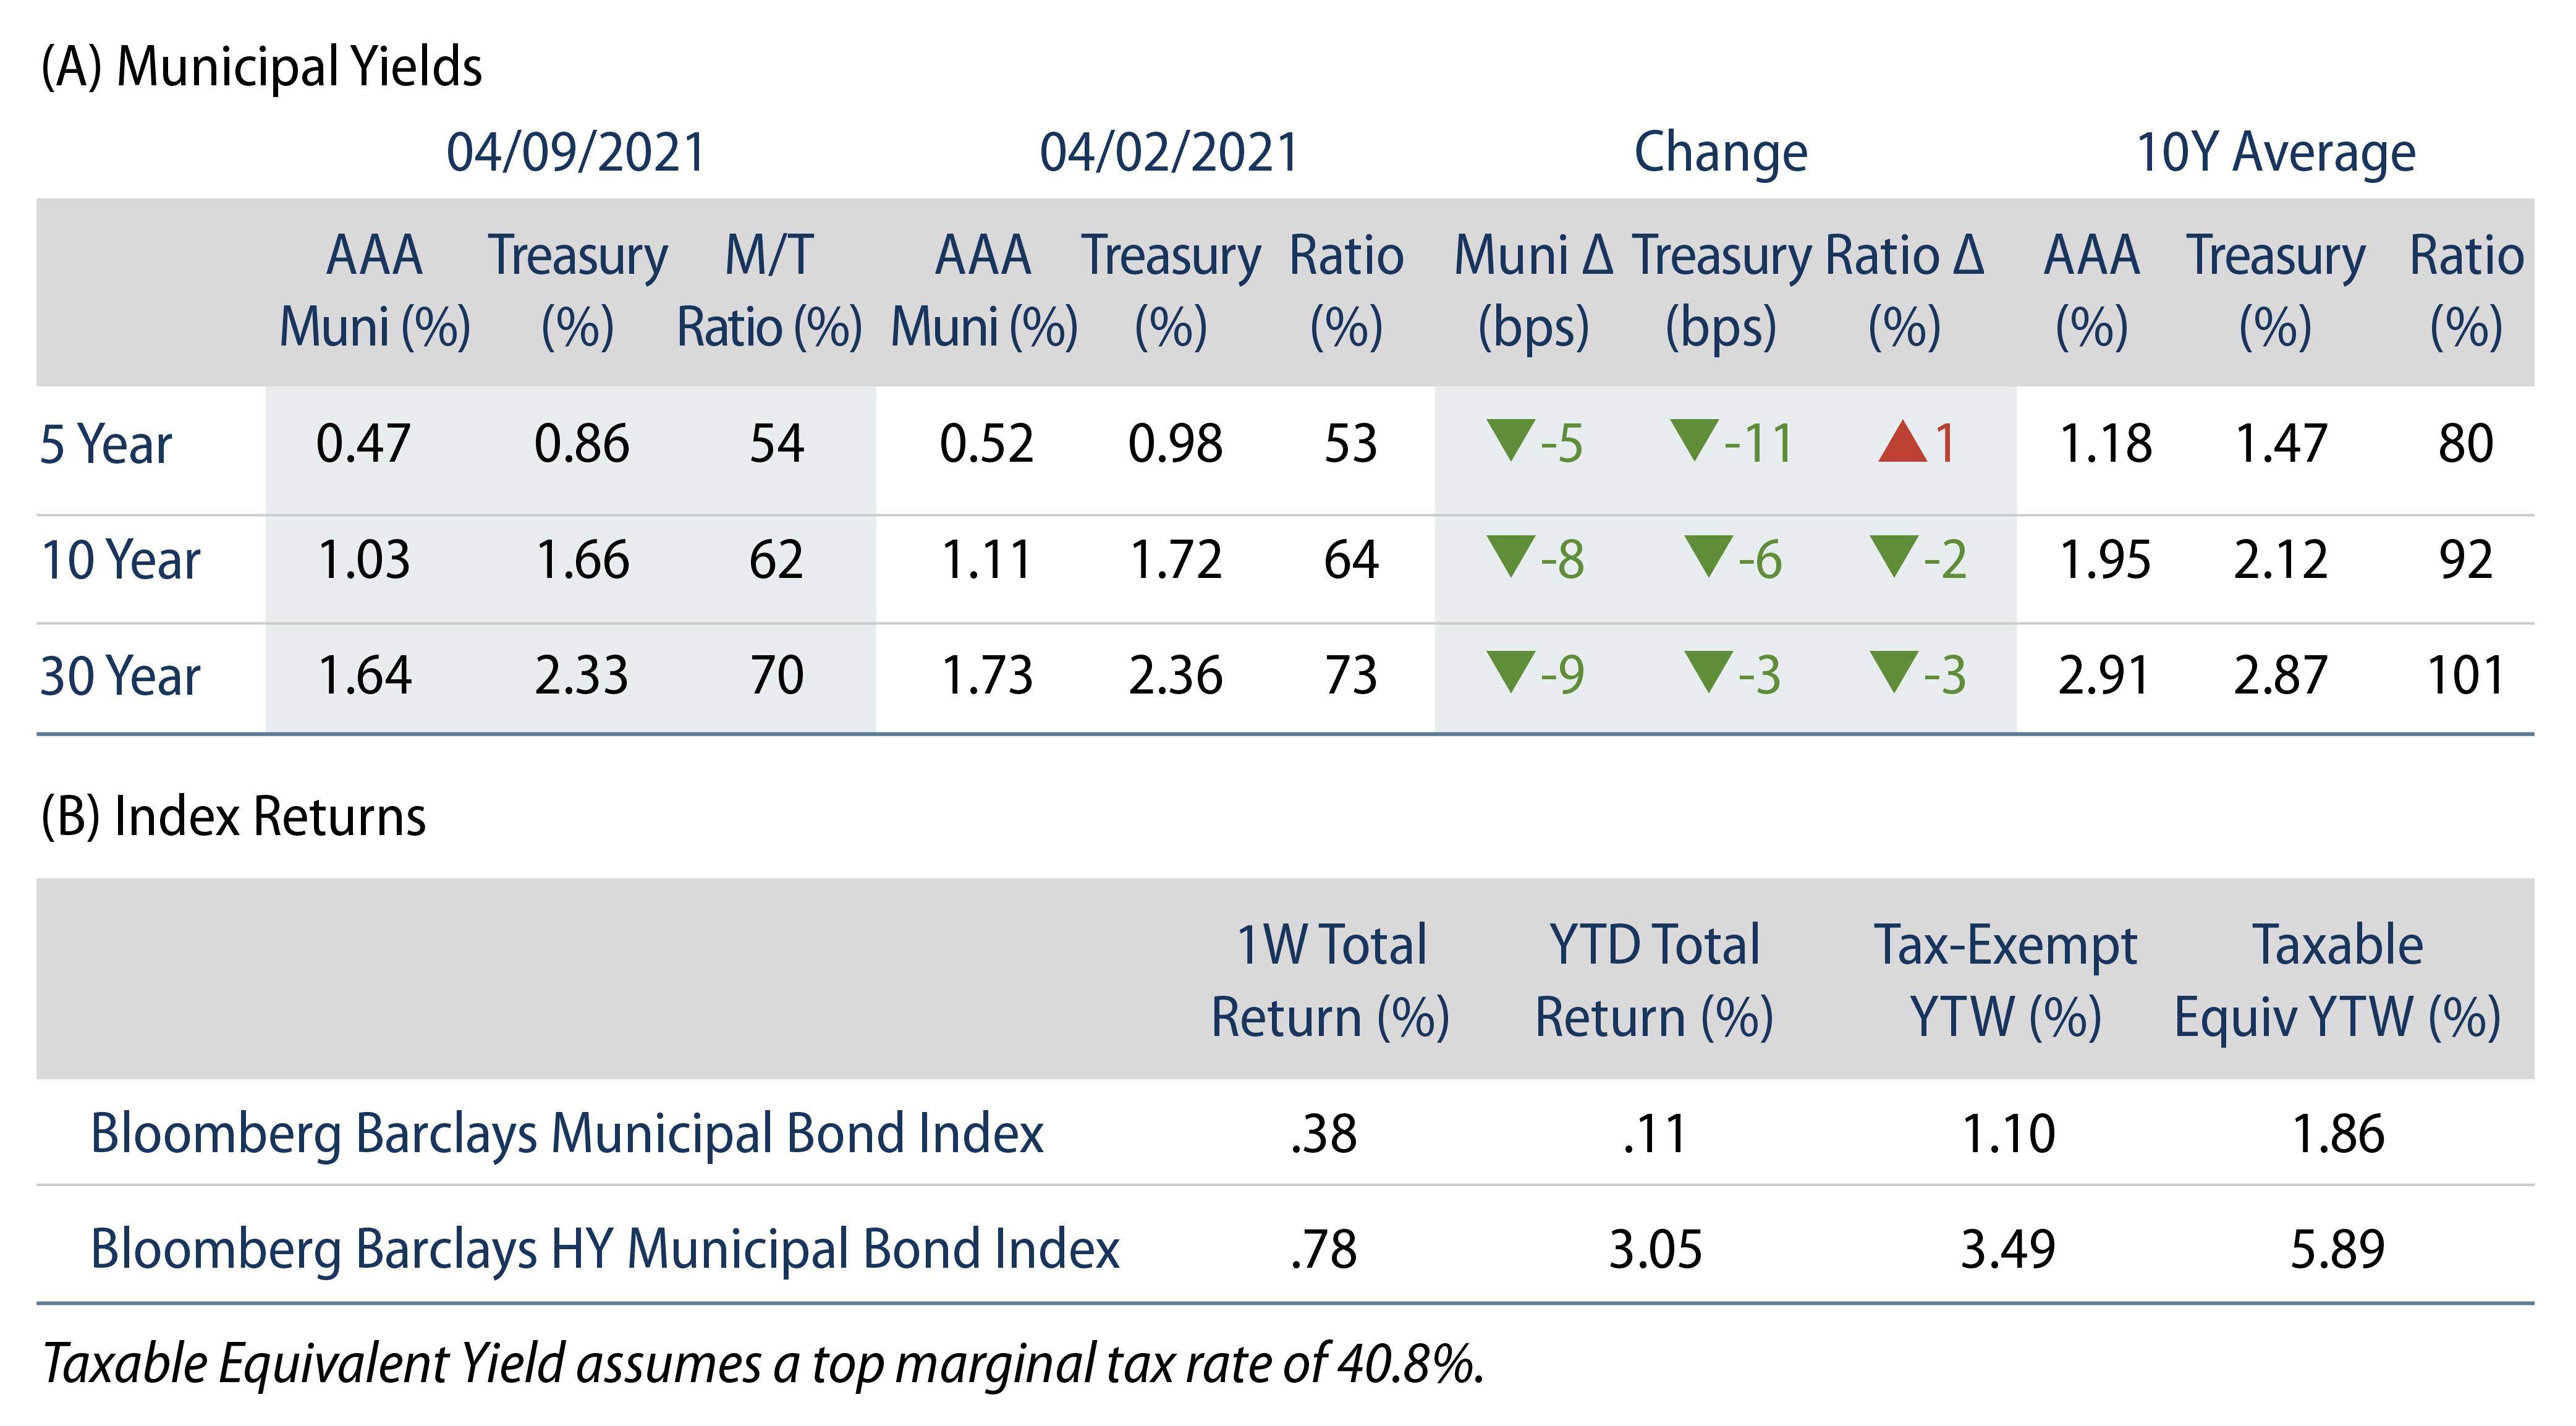
US municipal yields moved lower across the curve as munis outperformed Treasuries in intermediate and long maturities. Fund flows remained robust as supply picked back up to elevated levels. The Bloomberg Barclays Municipal Index returned 0.38%, while the HY Muni Index returned 0.78%. This week we explore the latest infrastructure developments following the release of President Biden’s $2.3 trillion American Jobs Plan.
Municipal Mutual Funds Inflows Continue their Record Pace
Fund Flows: During the week ending April 7, municipal mutual funds recorded $2.1 billion of net inflows. Long-term funds recorded $1.7 billion of inflows, high-yield funds recorded $821 million of inflows and intermediate funds recorded $259 million of inflows. Net inflows year to date (YTD) totaled $35.6 billion.
Supply: The muni market recorded $10.1 billion of new-issue volume during the week, returning back to elevated levels following a holiday-shortened week. Total issuance YTD of $118 billion is up 24% from last year’s levels, with tax-exempt issuance 21% higher and taxable issuance 32% higher. This week’s new-issue calendar is expected to decline to $7.8 billion (-23% week-over-week). The largest deals include $827 million taxable Pennsylvania Economic Development Financing Authority and $634 million Alabama Department of Corrections Facilities Project transactions.
This Week in Munis: Infrastructure Policy Begins to Take Shape
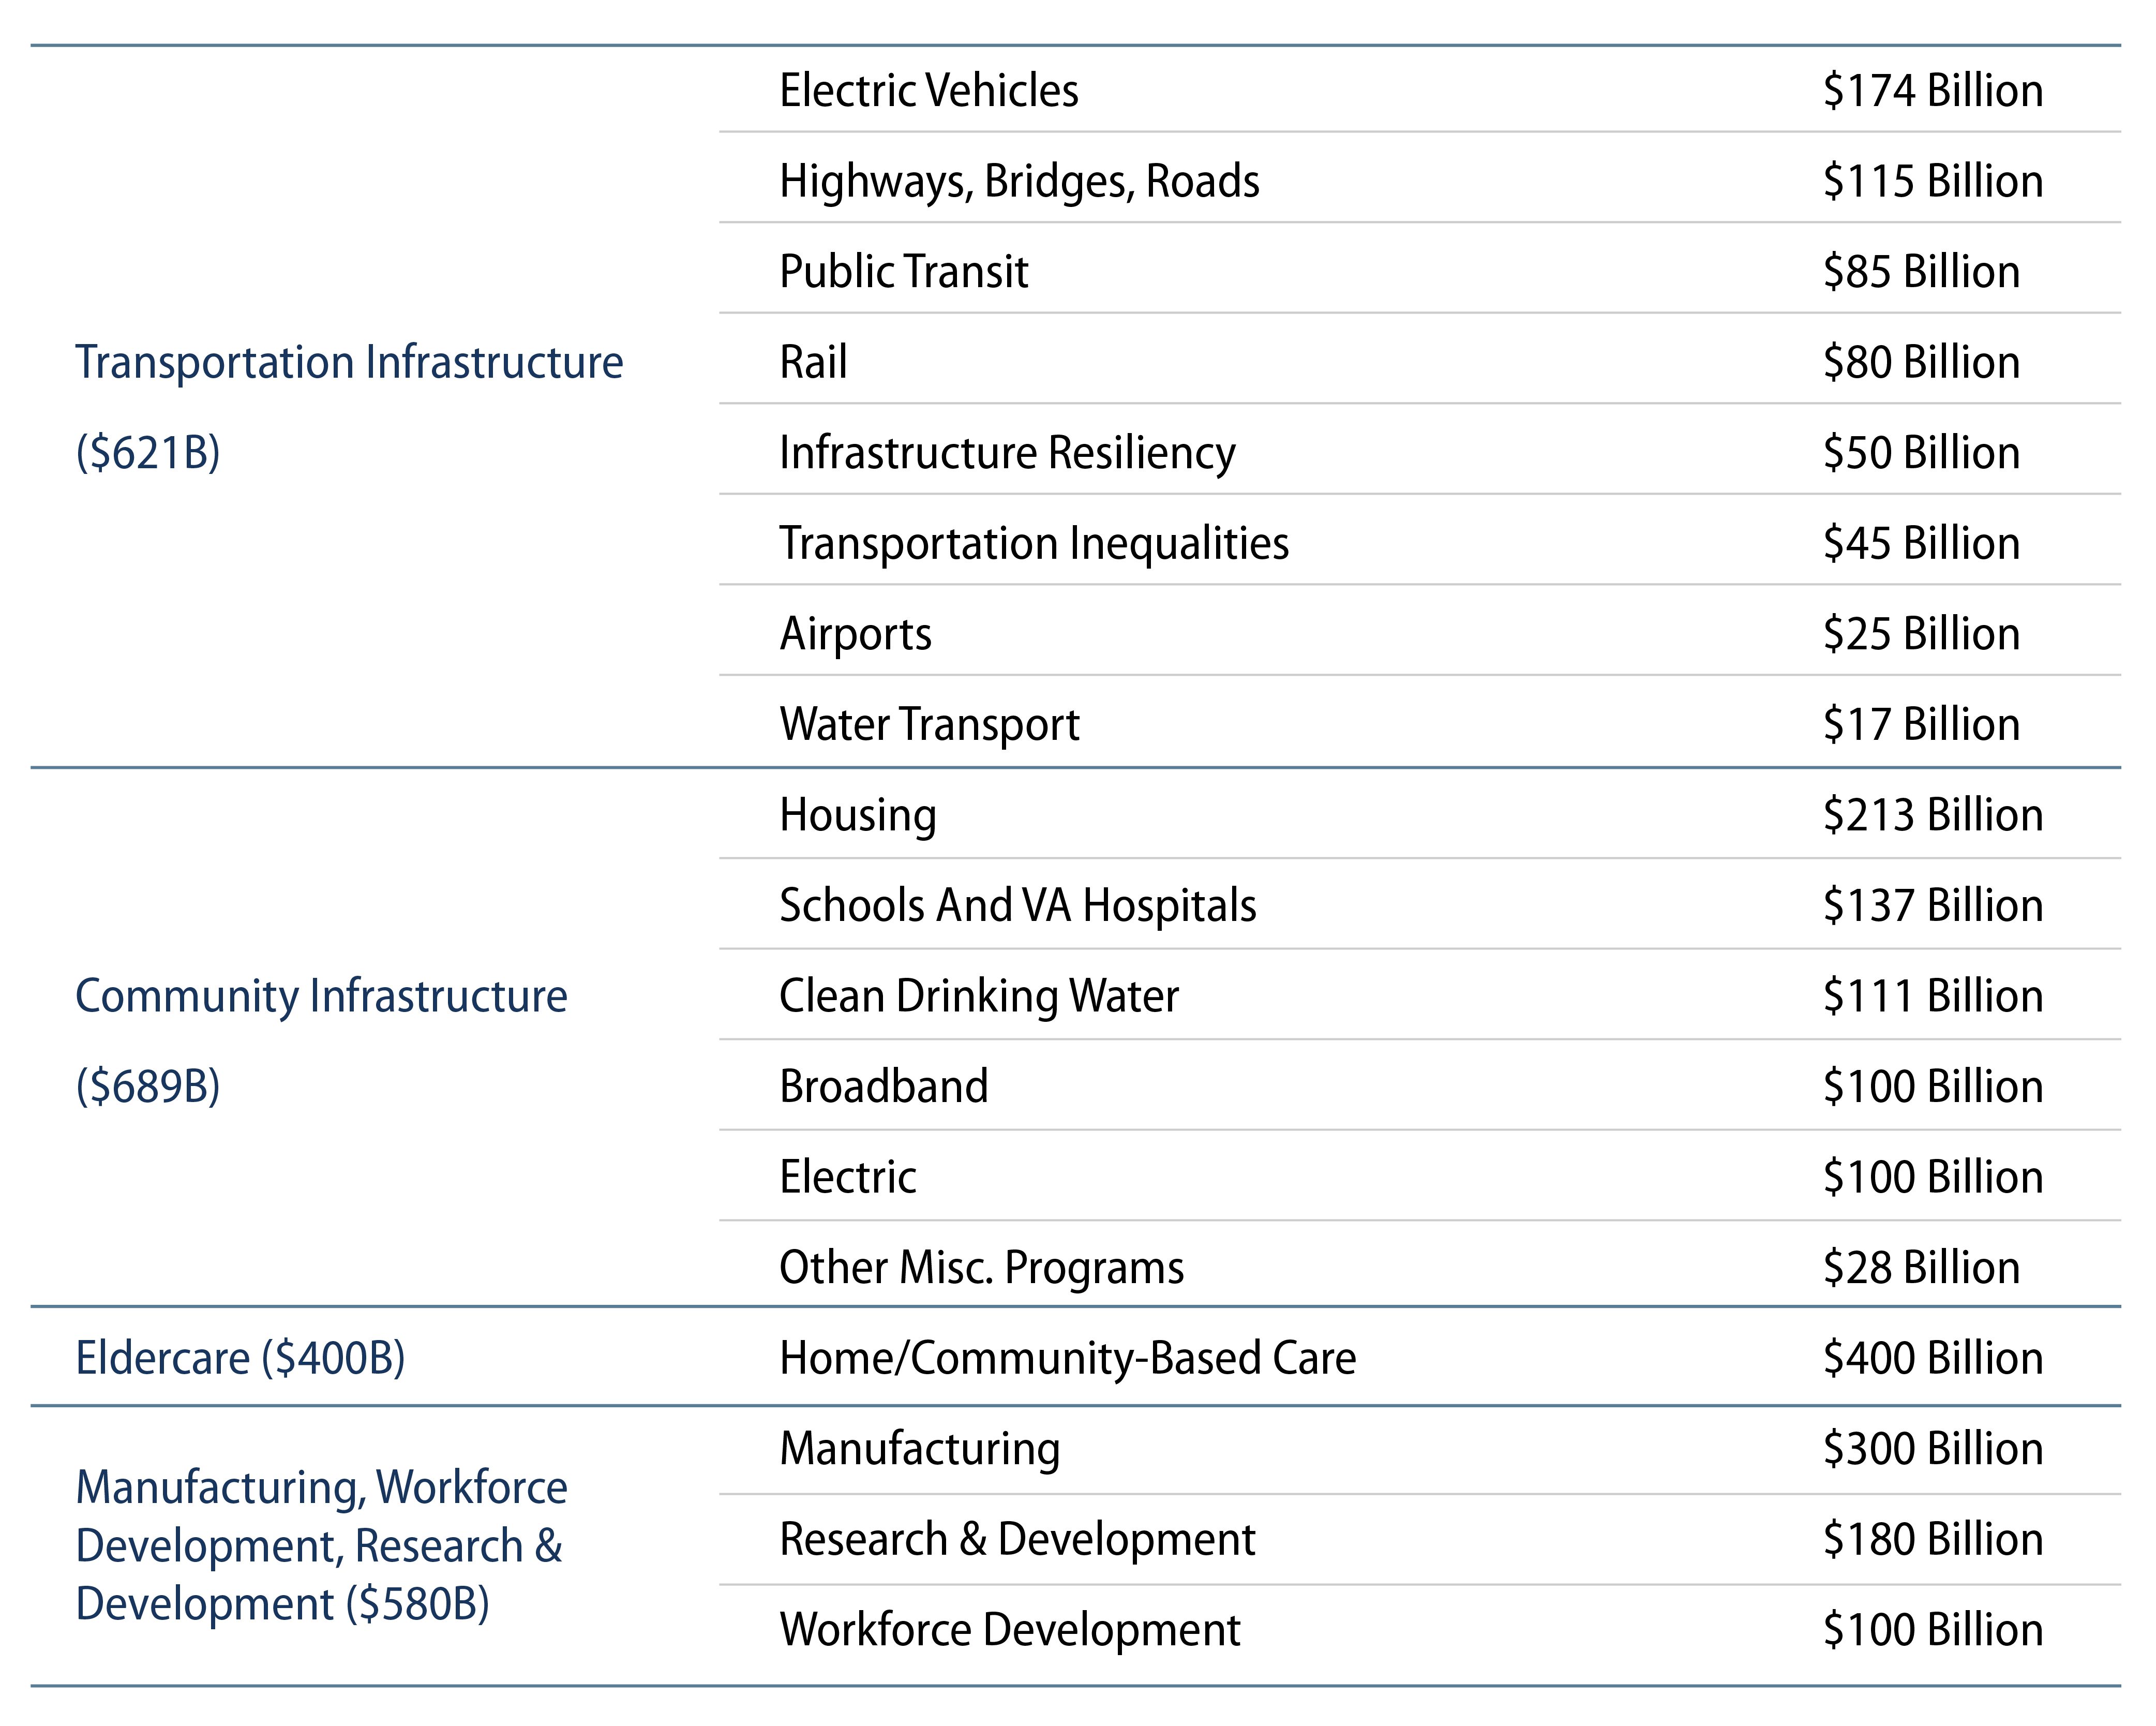
President Biden released his long awaited eight-year, $2.3 trillion American Jobs Plan, which is focused on transportation, water, housing, schools and health care infrastructure—all municipal sectors that would benefit from increased federal funding. The plan specifically dedicates $621 billion to modernizing roads, bridges, railroads, public transit and airports. The plan also pledges $650 billion to affordable housing, water, electric, rural broadband and public school infrastructure.
The infrastructure plan would be positive for domestic economic growth and infrastructure spending that has declined in recent years to below 2.0% of GDP. The plan’s annual infrastructure spending is equivalent to approximately 1.3% of 2020 GDP, and the measure would bring infrastructure spending back near historical average levels at approximately 2.5% of GDP.
While infrastructure support is bipartisan, we anticipate the scope of spending that includes non-traditional infrastructure items to remain an obstacle considering the thin Democratic majority. Robust pandemic-related stimulus, along with recent positive labor market performance may limit congressional willingness to support additional spending measures.

Questions also remain around how the infrastructure proposal would be funded, and additional clarity is expected to be released in May and June. The President has touted increasing the corporate tax rate from 21% to 28% to fund the plan. Funding mechanics are also unclear, as federally subsidized bond solutions (such as the Obama-era BABs program) remain in the conversation as well as more traditional financing sources such as P3, TIFIA, and PABs (for more information see our prior note on the various infrastructure initiatives). We expect the structure of any bonding incentives to have a material impact on the composition of taxable and tax-exempt municipal market supply technicals over any major infrastructure funding period. Considering the biases to clean energy and climate change initiatives outlined within the plan, any bonding solution should contribute to positive impact investment opportunities for ESG investors.


