

The Bureau of Economic Analysis released data on four major indicators today: a revision of its 4Q25 GDP estimate and January data on consumer spending, personal income and Personal Consumption Expenditures (PCE) inflation. We’ll cover all four of these releases here, with an emphasis on the implications for consumer spending. At the end of this post, we will also provide an update on how government data releases stand in the wake of shutdown-induced disruptions.
4Q25 GDP growth was revised down from an already disappointing 1.4% to only 0.7% growth. This markdown was due to significantly lower prints for health care consumption, foreign trade in services and housing construction. We covered housing market conditions data in our February 27 post, and we’ll discuss health care consumption here. All in all, we stick with our conclusion of a month ago (February 20 post) that the real drags on growth in 4Q25 were a sharp drop in motor vehicle output and sharply reduced government spending due to the shutdown. Together, these two items reduced 4Q25 growth by 2.5 percentage points. Both of these drags should revert to or near 3Q25 output levels in 1Q26, which would provide a very large boost to 1Q26 GDP growth.
Beneath this quarterly “chop,” it is the case that consumer spending growth slowed a bit in December and January. The aforementioned large downward revision to consumption of health care services reduced the 4Q25 growth rate for this aggregate, but spending there then rebounded in January, based on today’s data. Other components of consumer spending are summarized in Exhibit 1.
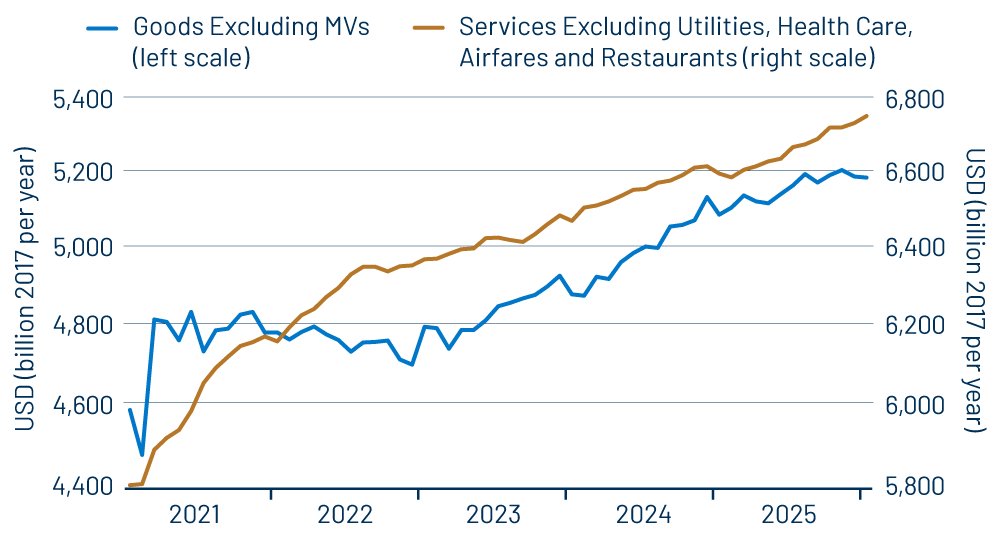
As you can see, services spending growth has proceeded quite steadily outside of health care and, again, health care spending itself is growing nicely, though not quite as rapidly as previous data suggested. Rather, the slowing in consumer spending in December and January was actually due to lower spending on merchandise. There were substantial declines in consumer purchases of home electronics, apparel and cosmetics/pharmaceuticals.
(The blue line in Exhibit 1 excludes motor vehicles, but motor vehicle spending declined only mildly in December/January. If you are wondering, the sharp drop in vehicle production in 4Q25 was mostly due to inventory cutbacks and a decline in business purchases of trucks. These are rebounding in 1Q26.)
Maybe the goods spending declines reflect a soft Christmas season, or maybe they reflect delayed effects of tariffs. We doubt they will persist, as household income growth continues at a decent pace. Despite the paucity of job growth, real growth in private-sector wages and salaries is proceeding at a 2% annual rate. Unlike other analysts, we don’t expect a coming spending boost from 2026 tax cuts, but we do think steady real income growth will lead to steady growth in spending on both goods and services, making the December/January softness a pause rather than a downturn.
In fact, retail sales growth held up reasonably well in the months through January. The flat-to-down real spending on goods in December/January mostly reflects higher goods prices in those months. Exhibit 2 shows the core Consumer Price Index (CPI) and PCE data as currently available, the CPI through February and PCE through January. Much of the upturn in December/January inflation does indeed reflect goods prices, coming off possibly (shutdown-induced?) understated inflation in October/November.
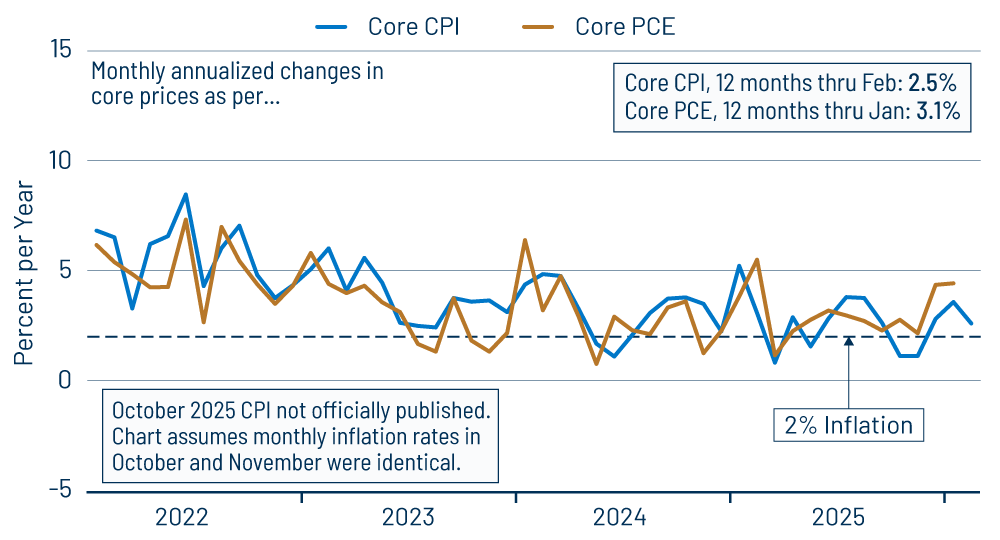
This is not a good thing, and we’ll see whether consumer resistance tempers retailers’ pricing. (Again, higher prices in December/January look to have eaten into real purchases.) Our point is that underlying demand for goods remains reasonably steady and, again, services spending is growing nicely. So while the spending decline is a concern, there are no indications of a weakening in consumer demand.
Most of the economic data we analyze are produced by four government agencies:
- The Bureau of Economic Analysis (BEA) within the Commerce Department (GDP, consumption, PCE)
- The Census Bureau, also within Commerce (retail sales, construction, factory orders)
- The Bureau of Labor Statistics (BLS), within the Labor Department (jobs, CPI), and
- The Federal Reserve (Fed) (industrial production)
These agencies were affected to various degrees by the government shutdown. BLS and the Fed are now fully caught up with their pre-shutdown release schedules. With today’s releases, BEA is two weeks behind schedule and plans to return to its normal schedule by the end of April. Census is a month behind schedule and has not yet released a timetable for getting back on schedule.
As Census catches up further on its releases, various indicators will be published at odd (unscheduled) dates. We’ll cover these “surprise” releases as best we can while attempting to follow a normal schedule for our posts on the other indicators.