skip navigation
Western Asset Management Company
Blog

Stay up to date on timely topics and market events. Subscribe to our Blog now.

ECONOMY
January 26, 2026

Consumer Steady, Manufacturing and Capex Perking Up

By Michael J. Bazdarich, PhD

Stay up to date on timely topics and market events. Subscribe to our Blog now.

The government shutdown ended nearly 11 weeks ago, and the release of government data has now almost caught up from shutdown delays. Federal Reserve releases of industrial production data are fully caught up. Commerce Department data on consumer spending, manufacturing and construction are now just a month behind and will likely be fully back on schedule next month. Of course, another possible shutdown looms, but that is a story for another time.

Today, we will focus on the latest data on consumer spending and manufacturing activity and what it means for the overall economy. Headlines indicate two positive trends: first, consumer spending is growing at a decent rate; second, data releases since the shutdown show an improvement in manufacturing activity and business investment in new equipment, which has boosted overall US growth. Add in the sharp improvement in the US foreign trade balance reported for October, and we could indeed have a very strong GDP report for 4Q late next month. Details on all these points follow.

Exhibit 1 summarizes consumer spending trends. As you can see there, spending on both merchandise and services is proceeding nicely. No, there hasn’t been any acceleration lately, but neither has slower job growth curtailed consumption. (For that matter, personal income growth has remained steady/favorable despite sluggish job growth.) And the early-2025 slowing in services spending that concerned us some months ago has been fully reversed.

Exhibit 1: Real Consumer Spending by Type
Real Consumer Spending by Type
Source: Bureau of Economic Analysis. As of 30 Nov 25. Select the image to expand the view.

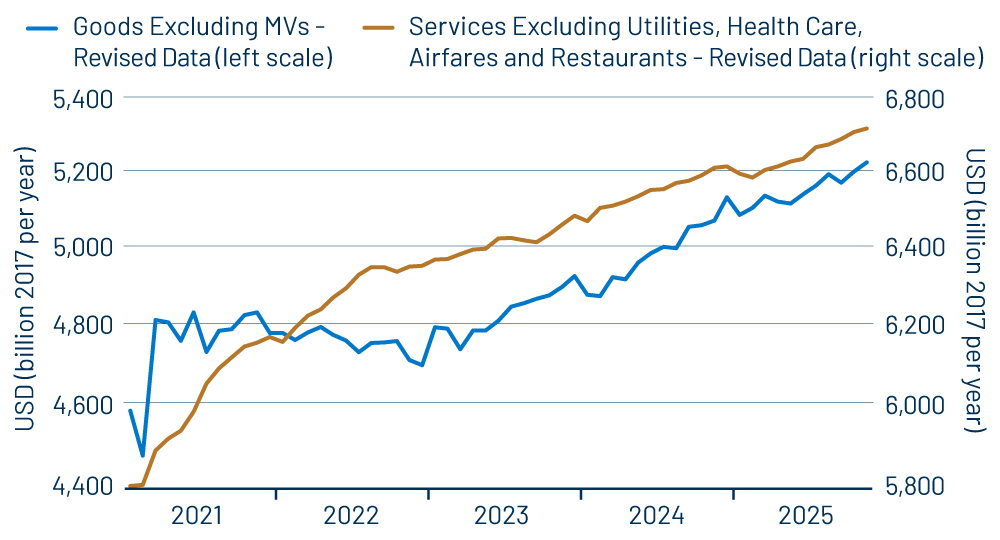
The series shown in Exhibit 1 abstract from four components of consumption: health care, because it is actually paid for largely by insurance companies and the government; motor vehicles and utilities, because of their volatility; and restaurants because of lingering Covid effects. The fact is that all four of these components are behaving right in line with our depiction of consumption in general.

Turning to the manufacturing sector, Exhibit 2 summarizes things succinctly. High-tech manufacturing has been growing steadily throughout this expansion and has seen a further boost in growth this year. The new wrinkle is a rebound in output of lower-tech industries, after three years of decline. Data prior to the shutdown had hinted at some upturn, but the six months of data released since the shutdown document this more reliably. Output has rebounded for industrial metals, petroleum products, business equipment and even textile products.

Exhibit 2: Industrial Production, High- and Low-Tech Manufacturing
Industrial Production, High- and Low-Tech Manufacturing
Source: Federal Reserve Board. As of 31 Dec 25. Select the image to expand the view.

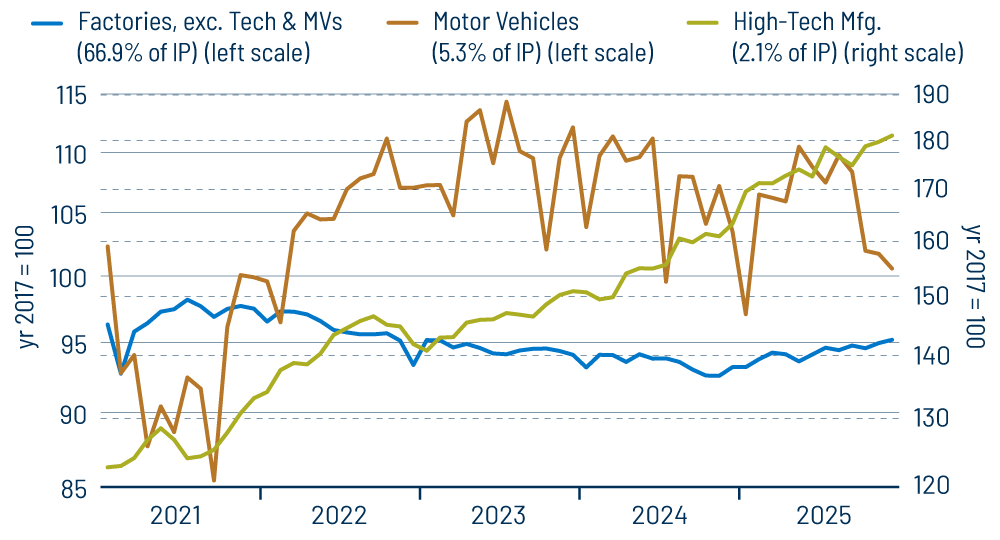
Not shown here is the fact that business investment in “basic” equipment—that is, machinery other than computers and related tech—also started turning up around December of last year. This underlies the 2025 rebound in factory output. Meanwhile, last week’s post discussed the continued mild softness in construction activity, with residential construction trending lower, office and commercial construction still suffering from Covid effects and manufacturing construction elevated, but no longer growing.

Finally, it appears 4Q25 GDP is going to get a big boost from a sharp decline in the foreign trade deficit. This is mostly a reversal of a sharp increase in the trade deficit in 1Q25. Merchants feverishly ramped up imports to try to beat the Trump tariffs, and imports have fallen back more recently with the tariffs in place.

In truth, the early-2025 surge in imports led to increases in merchant inventories and so should not have affected 1Q GDP growth. Similarly, the offsetting decline in imports presently is leading to a decline in inventories and should similarly have no effect on 4Q GDP growth. However, with real world data collection techniques and all their flaws, 1Q GDP was reported as coming in negative, and 4Q is likely to show growth upwards of 4% (as did 3Q GDP).

The most accurate depiction of the US economy will be gained by looking at growth across the four quarters of 2025, that is, growth in 4Q25 GDP over 4Q24. That rate is still likely to show some improvement over 2024, reflecting steady growth in consumption, steady declines in construction and the rebound in manufacturing, but not as sharp an improvement as one might guess from the tone of the 3Q and 4Q releases.

In sum, the economy is not booming, but neither have tariffs had the deleterious effects that many warned of. And as recent trends in business investment and consumption continue, 2026 could show growth at least as good as that of 2025.

© Western Asset Management Company, LLC 2026. The information contained in these materials ("the materials") is intended for the exclusive use of the designated recipient ("the recipient"). This information is proprietary and confidential and may contain commercially sensitive information, and may not be copied, reproduced or republished, in whole or in part, without the prior written consent of Western Asset Management Company ("Western Asset").
Past performance does not predict future returns. These materials should not be deemed to be a prediction or projection of future performance. These materials are intended for investment professionals including professional clients, eligible counterparties, and qualified investors only.
These materials have been produced for illustrative and informational purposes only. These materials contain Western Asset's opinions and beliefs as of the date designated on the materials; these views are subject to change and may not reflect real-time market developments and investment views.
Third party data may be used throughout the materials, and this data is believed to be accurate to the best of Western Asset's knowledge at the time of publication, but cannot be guaranteed. These materials may also contain strategy or product awards or rankings from independent third parties or industry publications which are based on unbiased quantitative and/or qualitative information determined independently by each third party or publication. In some cases, Western Asset may subscribe to these third party's standard industry services or publications. These standard subscriptions and services are available to all asset managers and do not influence rankings or awards in any way.
Investment strategies or products discussed herein may involve a high degree of risk, including the loss of some or all capital. Investments in any products or strategies described in these materials may be volatile, and investors should have the financial ability and willingness to accept such risks.
Unless otherwise noted, investment performance contained in these materials is reflective of a strategy composite. All other strategy data and information included in these materials reflects a representative portfolio which is an account in the composite that Western Asset believes most closely reflects the current portfolio management style of the strategy. Performance is not a consideration in the selection of the representative portfolio. The characteristics of the representative portfolio shown may differ from other accounts in the composite. Information regarding the representative portfolio and the other accounts in the composite are available upon request. Statements in these materials should not be considered investment advice. References, either general or specific, to securities and/or issuers in the materials are for illustrative purposes only and are not intended to be, and should not be interpreted as, recommendation to purchase or sell such securities. Employees and/or clients of Western Asset may have a position in the securities or issuers mentioned.
These materials are not intended to provide, and should not be relied on for, accounting, legal, tax, investment or other advice. The recipient should consult its own counsel, accountant, investment, tax, and any other advisers for this advice, including economic risks and merits, related to making an investment with Western Asset. The recipient is responsible for observing the applicable laws and regulations of their country of residence.
Founded in 1971, Western Asset Management Company is a global fixed-income investment manager with offices in Pasadena, New York, London, Singapore, Tokyo, Melbourne, São Paulo, Hong Kong, and Zürich. Western Asset is a wholly owned subsidiary of Franklin Resources, Inc. but operates autonomously. Western Asset is comprised of six legal entities across the globe, each with distinct regional registrations: Western Asset Management Company, LLC, a registered Investment Adviser with the Securities and Exchange Commission; Western Asset Management Company Ltda. is regulated by Comissão de Valores Mobiliários; Western Asset Management Company Pty Ltd ABN 41 117 767 923 is the holder of the Australian Financial Services License 303160; Western Asset Management Company Pte. Ltd. Co. Reg. No. 200007692R is a holder of a Capital Markets Services License for fund management and regulated by the Monetary Authority of Singapore; Western Asset Management Company Ltd, a registered Financial Instruments Business Operator and regulated by the Financial Services Agency of Japan; and Western Asset Management Company Limited is authorised and regulated by the Financial Conduct Authority ("FCA") (FRN 145930). This communication is intended for distribution to Professional Clients only if deemed to be a financial promotion in the UK as defined by the FCA. This communication may also be intended for certain EEA countries where Western Asset has been granted permission to do so. For the current list of the approved EEA countries please contact Western Asset at +44 (0)20 7422 3000.