

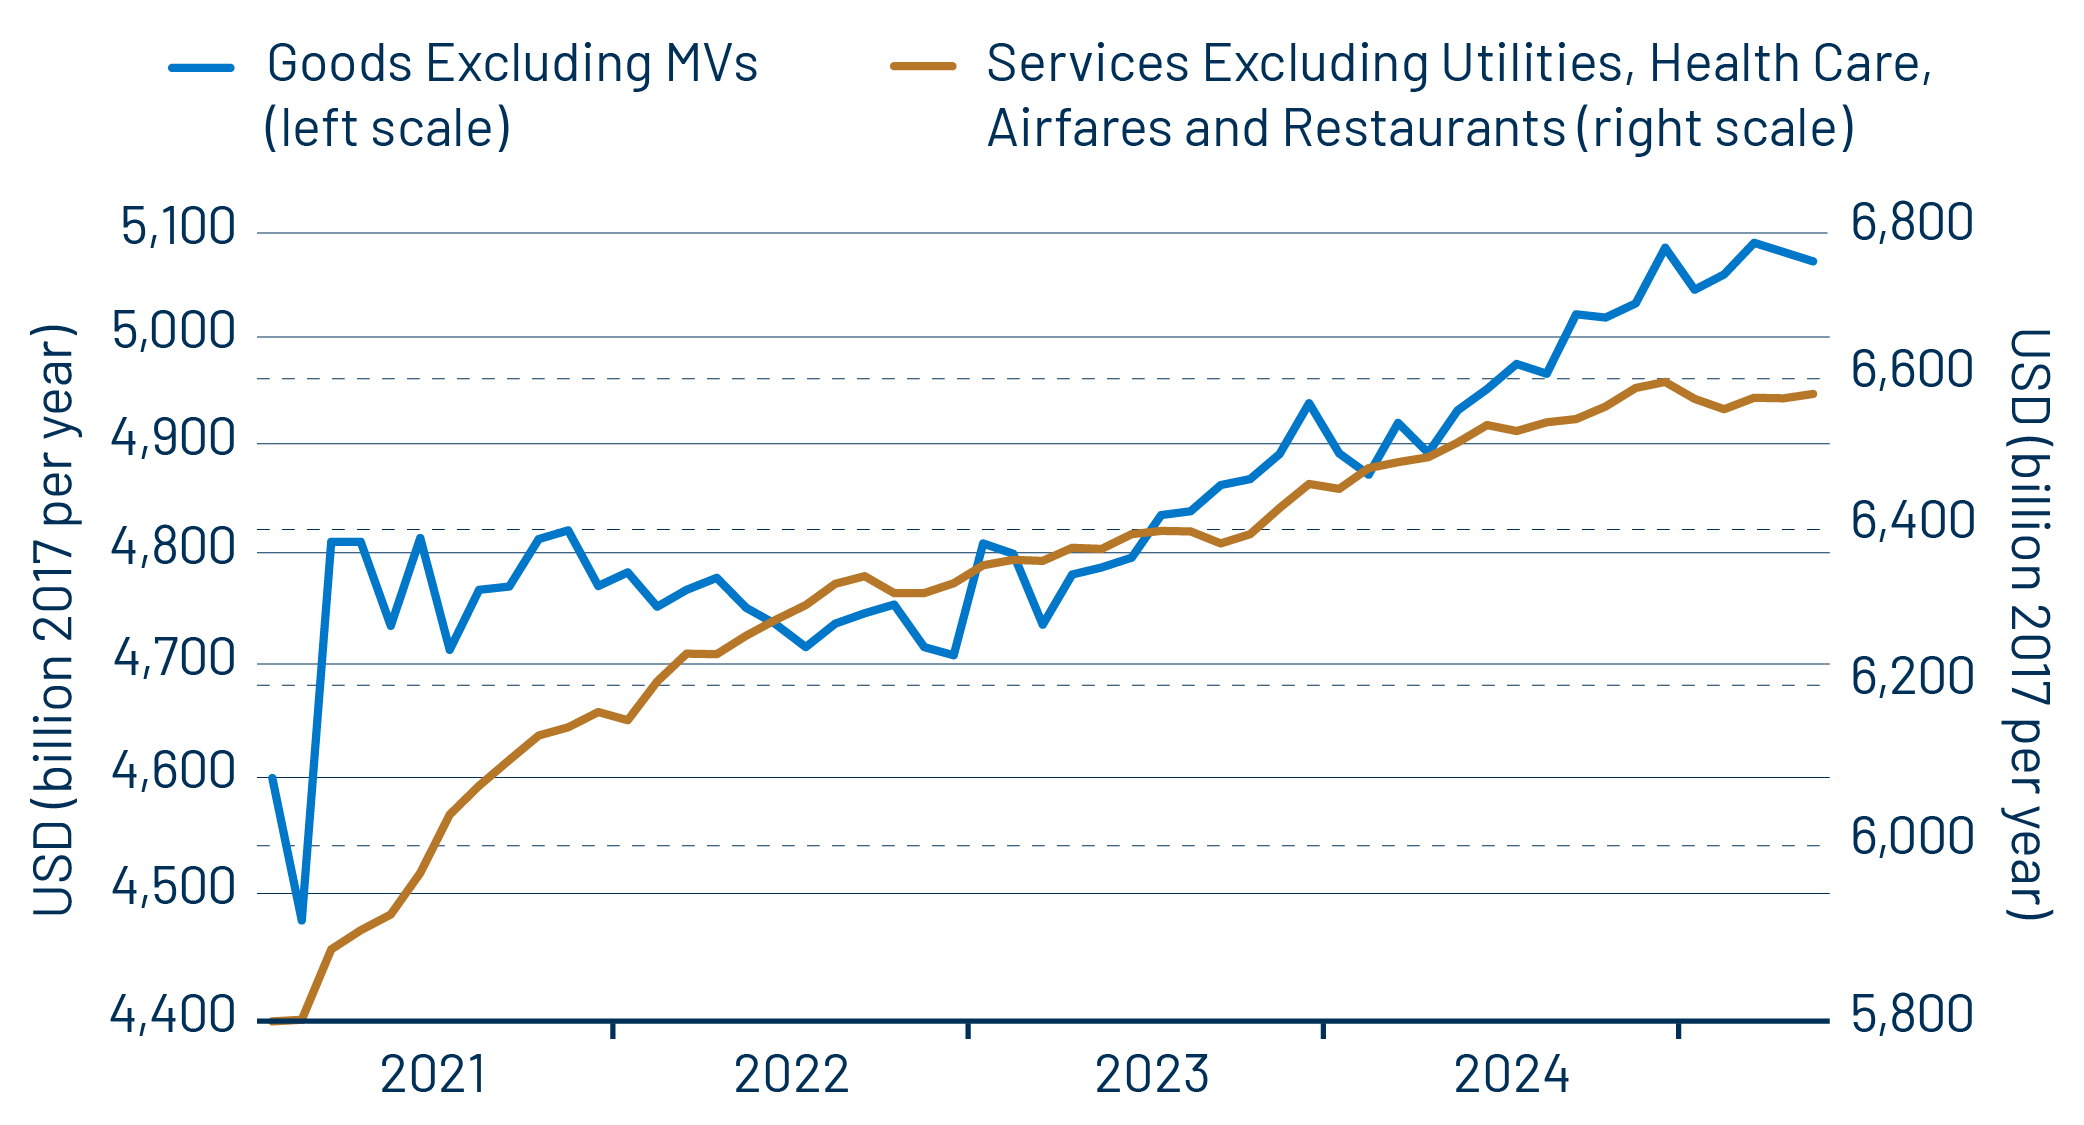
Consumer spending was broadly soft in May, with spending on merchandise registering a slight decline, while spending on services rose hardly at all. Furthermore, services spending for preceding months was revised down substantially, which was the main reason for the downward revision to 1Q GDP announced yesterday.
In related news today, personal income was reported as declining -0.4% in May. This was purely a statistical artifact, related to government payments of Social Security benefits. Those jumped in April, due to one-time payments under the so-called Social Security Fairness Act. SS payments then fell back in May, returning to about their March level. These swings grossly overstated income growth in April and similarly grossly understated it in May. Underneath these swings, workers’ compensation grew a brisk 0.4% in both April and May, well above the rate of inflation.
In our last post, we asserted that May retail sales rose nicely, despite a marked decline in the headline aggregate, as wild month-to-month swings in vehicle sales obscured a decent 0.4% rise in underlying sales (net of vehicles). That increase was reflected in consumer spending on goods other than motor vehicles, which also rose 0.4%. However, goods prices rose more, so that real spending on merchandise other than vehicles declined by -0.2% (Exhibit 1).
The increases in goods prices did seem to reflect tariff effects, as prices rose substantially for consumer durables such as electronics, recreational goods and furniture. At the same time, though, prices did NOT increase for consumer nondurables, including clothing and food, and prices actually declined for some durables items such as jewelry and watches. It does appear to be the case that vendors are raising their prices for merchandise in response to the tariffs, but the incidence is much more varied than one might think would be the case.
As stated earlier, one big piece of news in today’s data was the softness in spending on services, both the sluggish recent gains and the downward revisions to previous months’ data. That softening is most apparent in travel and leisure, with taxi fares, air travel, car rental, amusement parks, financial services and telephone usage all showing declines.
Some of these could be related to tariff fears but others seem to smack of deeper effects on consumer spending. All in all, the consumer spending numbers weren’t horrible, but they mark two straight months of sluggishness, so all eyes will be on the June spending data to determine whether the recent slowdown is a new trend or just a blip.
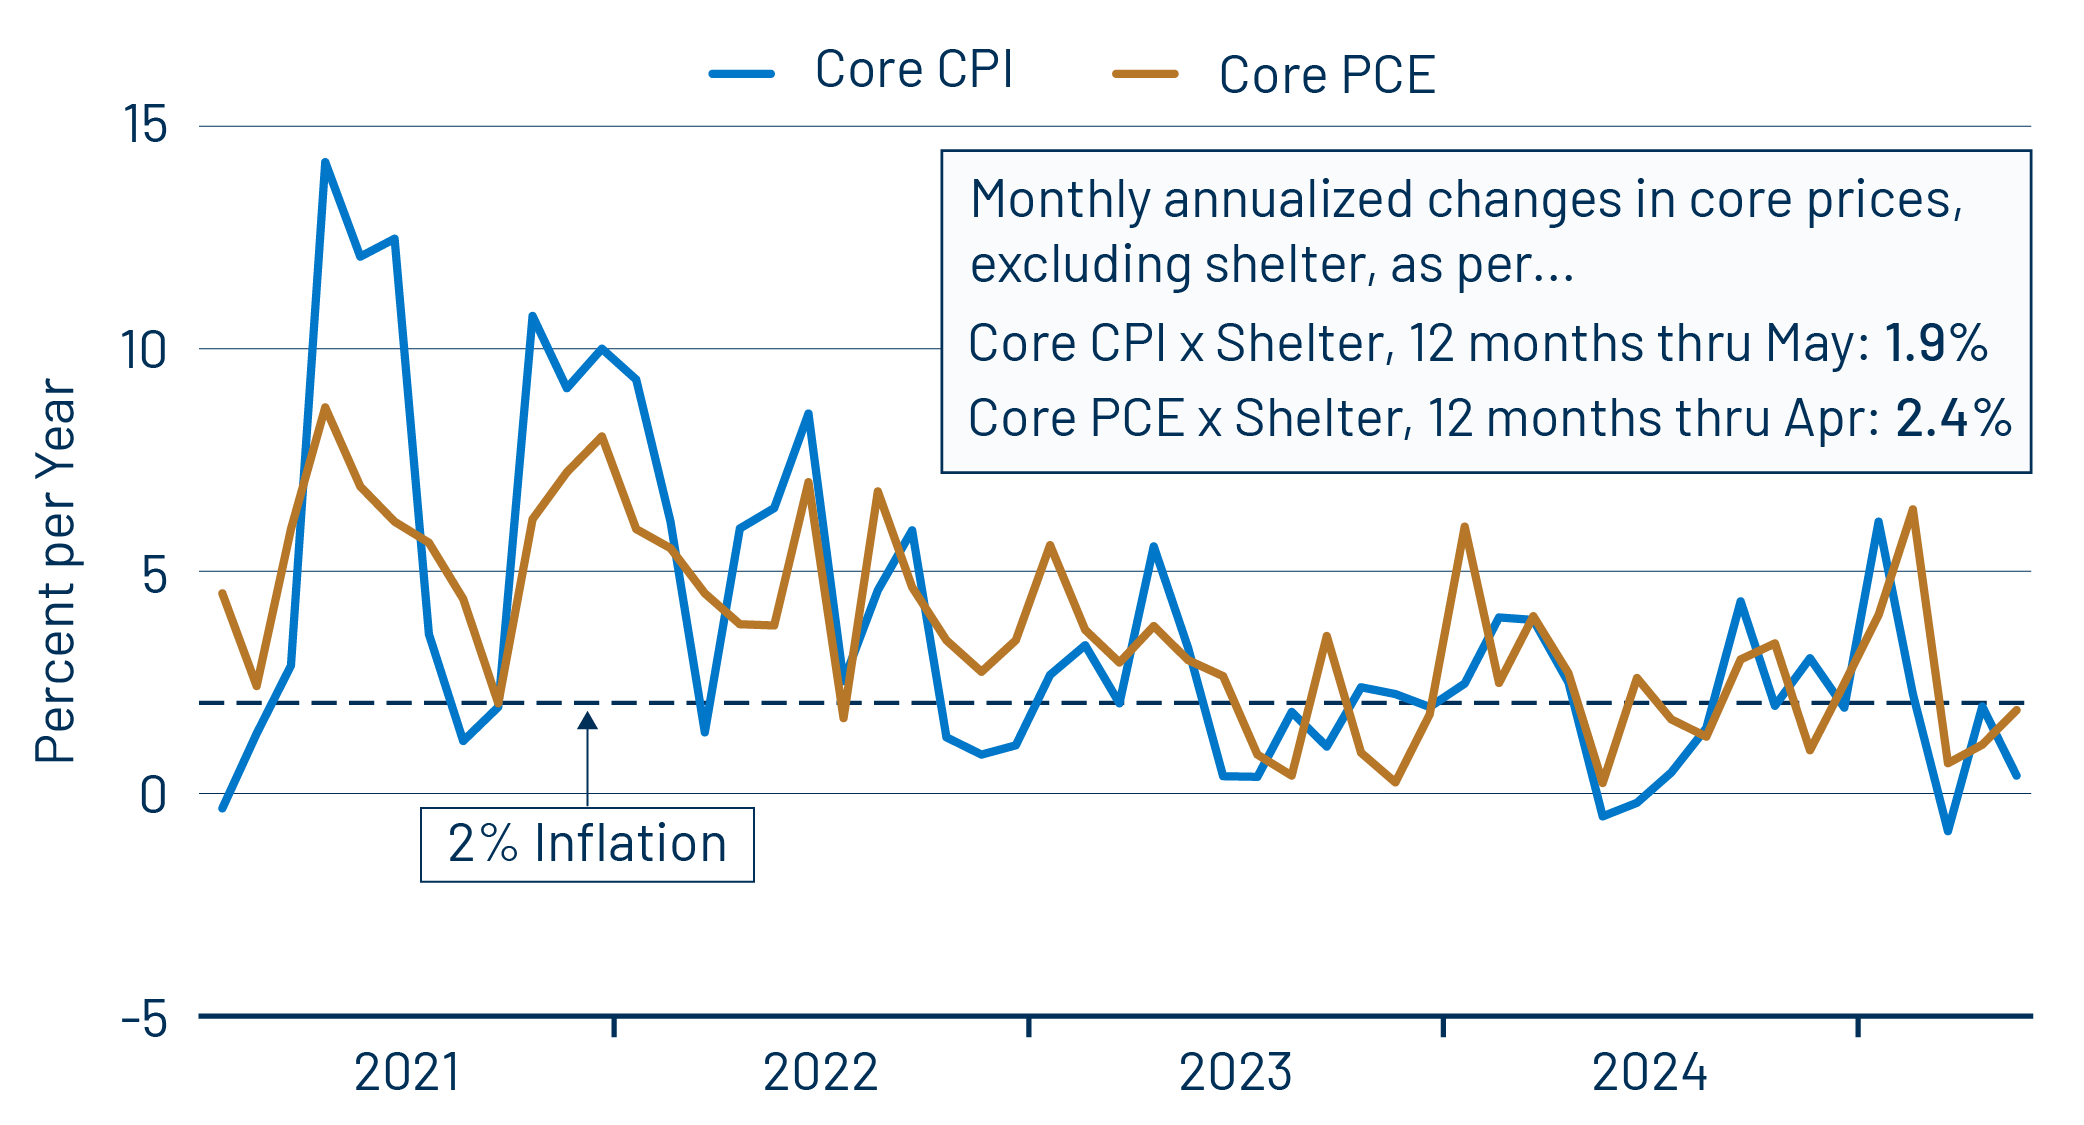
Meanwhile, the May inflation news was generally benign, with the headline Personal Consumption Expenditures (PCE) price index showing a 1.6% annualized rate of increase, the core PCE showing a 2.2% annualized rate and the core measure excluding shelter up at a 1.8% annualized rate. In May of 2024, each of these indices showed declines, and so the 12-month inflation rates for these measures all increased in May. However, the slight monthly gains and the pattern of recent gains shown in Exhibit 2 testify to the fact that inflation has been quiescent recently and remained so in May.
The wrinkle here is that the softness in inflation has been led by services prices, while goods prices have ticked up. This is the exact opposite of historical experience. The goods price gains, again, appear to be tariff-related. It is not obvious just what has caused services prices to be so well-behaved lately.