

Michael J. Bazdarich, PhD
Product Specialist/Economist
KEY TAKEAWAYS
- Because of its need to achieve a specified but variable returns target, a DB pension plan faces different risk than those other investors face.
- Financial research regularly finds that investors are compensated for bearing asset volatility risk, not for bearing the funded-balance volatility risk that DB plans actually face.
- In effect, DB plans are compensated for holding their low-risk asset, long bonds, as if these were high risk.
- The risk pricing that the market attaches to equities, commodities and, presumably, other types of risky assets, might be fine for investors in general but looks much less attractive for DB plans.
By now, liability driven investing (LDI) has become a household name among defined benefit (DB) pension plans worldwide. Major DB global accounting and regulatory reforms occurred some years ago, making DB plans more acutely aware of the short-term volatility in their funded balance, and we have since seen a proliferation of DB efforts to engage in various LDI tactics such as liability matching, dollar-duration matching, swap overlays and more.
With LDI concepts being applied in so many directions, it is a good idea for DB plan managers to step back, take a deep breath and refocus on some basic truths of LDI. These truths are sometimes lost in the shuffle of the latest and trendiest tactics.
Above All, LDI Means That Risks Are Different for a DB Plan
Exhibit 1 displays the basic message of LDI. These diagrams are not new, but it is worth giving them another look. The founding premise of LDI is that the risks facing a DB plan are fundamentally different from those for a standard investor (for whom there is no specified target for investment returns).
For the standard investor concerned only with asset returns, the standard Markowitz efficient frontier holds (left panel of Exhibit 1). The relative riskiness of various assets can be described by the volatility of their returns. The optimal portfolios comprising the efficient frontier can be fully determined from the means, volatilities and correlations of the various assets’ returns.
However, a DB plan’s assets must eventually provide sufficient value/return to fulfill its pension obligations. The valuation of those obligations can be seen to exist and to vary over time independently of the returns on plan assets. Therefore, the risks each asset imposes on a DB plan are materially different from those for a standard investor, as depicted in the differences between the two diagrams.1
For the standard investor, long bonds display more asset volatility than intermediate bonds, which, in turn, display more volatility than cash. However, for a DB plan, long bonds provide less funded balance volatility than intermediate bonds and intermediates less volatility (risk) than cash. This different risk hierarchy holds because the valuation of DB plan obligations behaves much like that of a long bond, rising and falling in value as long-term interest rates fall and rise, respectively.
This risk hierarchy runs exactly counter to financial market pricing. Virtually all investors believe that the longer the maturity of a bond, the higher the risk. Financial markets price bonds according to this belief: the yield curve is typically positively sloped, with long-bond yields higher than shorter-term bond yields. But long bonds are less risky for a DB plan. Because of market pricing, DB plans are compensated for holding the low-risk asset as if it were high-risk. In effect, DB plans are paid to reduce risk by extending the duration of their assets toward that of their liabilities. This is a simple restatement of a fact that most folks familiar with LDI purport to understand. However, this simple fact has important implications that are worth revisiting.
It’s Always a Good Time to Extend Duration
The aforementioned fact provides an immediate answer to the question of when is a good time to extend duration on DB plan fixed-income portfolios, say from core (intermediate) to long duration. As long as the yield curve is positively sloped, it is virtually always right to move DB plan fixed-income assets to long duration. In doing so, a plan will raise the expected return on assets while reducing funded-balance volatility, because long duration is a better match of plan liabilities.2 The only time it would be wrong to extend duration would be when the DB plan managers are so sure yields are going to rise that they want to actively bet on—and profit from—a prospective rise in yields.
Are DB Plans Adequately Compensated for Other Risks?
Just as the market pays DB plans to reduce risk by buying so-called risky long bonds, it is probably not paying the plans so well to take other kinds of risk. For a DB plan, asset volatilities do not matter. It is assets’ tracking errors against plan liabilities that matter. However, finance researchers from Sharpe-Lintner on down have found that financial markets compensate investors for bearing asset volatility risk.3 So there is reason to believe that DB investors are not correctly compensated for the risks they incur when investing in risky assets.
Exhibit 1 suggests that DB investors are not adequately compensated. In terms of asset volatility (left diagram in Exhibit 1), equities feature somewhat more volatility than long bonds, and somewhat more expected return. The risk/return ratios of long bonds and large-cap stocks are similar from this perspective. For DB plans, the relevant risk/return metric is return relative to tracking error against DB liabilities. By this metric (right diagram in Exhibit 1), the risk/return profile for large-cap stocks versus bonds is dramatically different, to the detriment of stocks. On average since 1960, when increasing asset/liability mismatch by moving from long bonds to large caps, a DB plan added about 2,000 basis points (bps) per year of incremental risk for every 200 bps per year of incremental expected return, an unattractive 1-to-10 trade-off.
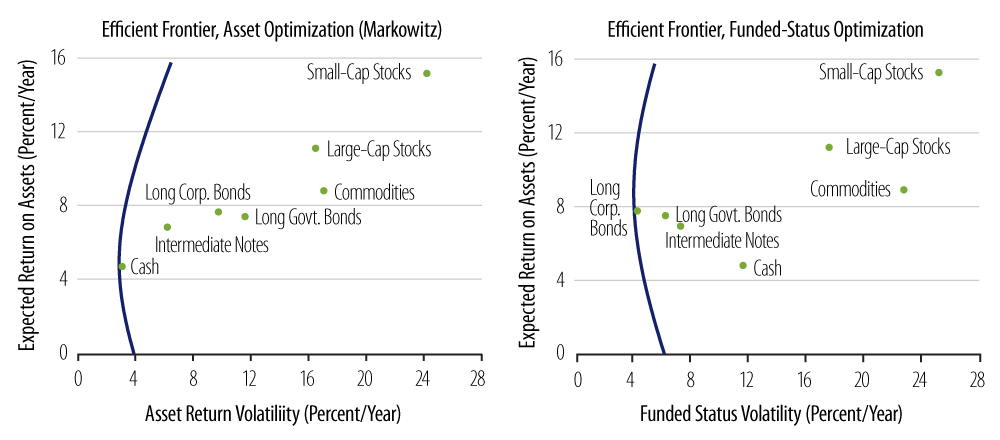
Small-cap stocks offered an additional 550 bps per year of return over long corporates, but at the cost of an additional 2,640 bps per year in tracking error against DB liabilities. While this 1-to-5 trade-off is better than that for equities, it is still not attractive. Notice also in the diagrams that while commodity futures show less asset volatility than do large caps, they show more tracking error against DB liabilities. This is a strong indication that market pricing of commodity futures is not in tune with DB plan risks. Meanwhile, the risk/return trade-off for commodities for DB plans is 2,150 bps per year extra risk for 290 bps per year of return, about 1-to-7.
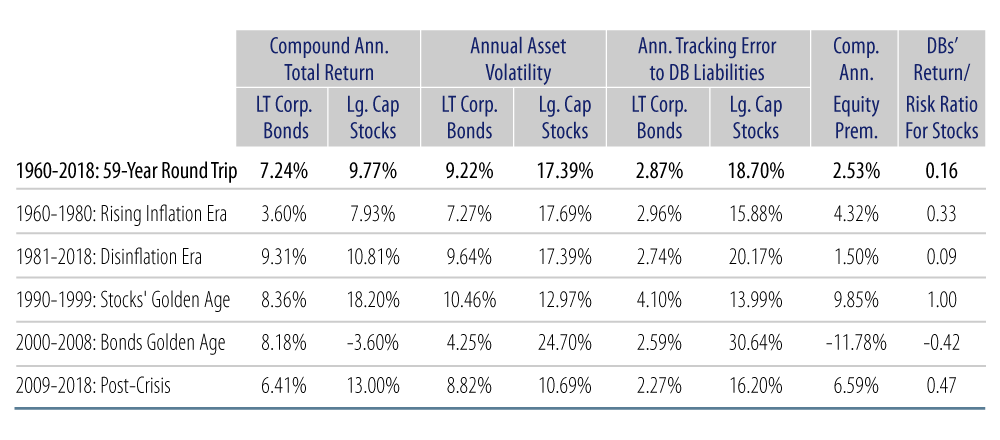
Exhibit 2 shows the statistics of relative riskiness for large-cap stocks and long corporate bonds for asset investors and for DB investors over the last 50 years, as well as over various sub-periods. Naturally, equities have a better risk-return profile in some periods than others, but only in the heady days of the 1990s did they provide a bang for the risky buck such as DB investors might expect. Notice in each episode how the relative riskiness of bonds and stocks varies when moving from the relevant risk metric for asset investors to that for DB plans.
Alternative assets such as hedge funds, private equity, real estate, etc. are also sectors of interest for DB plans. Total return indices are not generally available for these asset classes that feature the same level of reliability and inclusivity as do the Ibbotson data for stocks and bonds. That lack of readily available mark-to-market pricing may be an element of these asset classes’ attraction. Lacking reliable returns data, we cannot comment conclusively about the riskiness of these classes for DB plans. However, if one were willing to assert the relevance of the Capital Asset Pricing Model for these asset classes, the presumption would still be that—as with equities and fixed-income investments—the return/risk trade-off priced in is geared to different characteristics from those relevant for DB plan managers and their sponsors.
Swaps Don’t Remove Mismatch
It is well known that a long-duration swap overlay can improve the duration match to liabilities for a DB plan with heavy asset allocations outside fixed-income. However, in two previous papers, we have pointed out that a swap overlay does not reduce the fundamental mismatch between DB liabilities and plan assets invested in stocks, and so the swap typically cannot materially reduce funded-balance volatility for an equity-heavy DB asset allocation.4
That conclusion in the papers followed from a detailed discussion of LDI analytics and asset returns, but the same point can also be quickly established from Exhibit 1. It is well known that a perfectly positioned swap overlay effectively converts a DB plan’s liabilities from long-duration to cash. (The “receive” side of the swap is a set of cash flows that exactly matches the plan’s pension obligations, leaving the “pay” side of the swap, which is just a LIBOR—cash—liability.) Equities feature just as much incremental risk relative to cash in the left diagram of Exhibit 1 as they do relative to long bonds in the right diagram. This means that over the range of experience of the last half century, a composite of equities and a long-duration swap would have provided much the same funded-balance volatility as equities alone.
Locking Down Not a Feasible Goal
Long bonds are not the slam dunk for a DB plan that one might hope them to be. When a DB plan uses a AA yield to discount its liabilities, it effectively guarantees that the liabilities will grow at a long-term realized return equal to the yield-to-maturity (YTM) on AA bonds. The historical realized return on actual AA corporate bonds is a good bit less than their YTM, thanks to the effects of periodic downgrades and rare defaults of AA bonds.5 In general, the realized return of a portfolio of corporate bonds will be something less than its stated YTM (even if yields are stable), but the realized return on DB liabilities will not be less than the YTM used to discount them.
In effect, DB liabilities accrue as assuredly as if they were Treasuries, so when a plan uses an AA yield to discount them, the liability valuation will grow over time as if it were a credit risk free AA bond. So while a passive portfolio of duration-matched, spread-matched long bonds might provide the minimum risk allocation for a DB plan, that allocation cannot be expected to sustain fully funded status. Some allocation to active management or higher-risk assets will be necessary to achieve the expectation of sustaining fully funded status. That allocation would imply above-minimum risk levels for the plan. (Keep in mind also that the minimum risk allocation itself is not a risk-free one).
DB plan management is not easy, and it can never be locked down even via a passive, full immunization (except through very expensive sales of the liabilities to an insurance company). However, this does not detract from the fact that the risks a DB plan faces are profoundly different from those faced by a typical asset-minded investor, so that the compensations for risk provided by standard financial market pricing will typically be unfavorable for a DB plan investor.
Conclusions
Financial economists such as Jack Treynor, Merton Miller, Fischer Black, Irwin Tepper and others have long argued that corporate DB plans should be fully funded and fully invested in long bonds. Their analyses were based on subtle economic issues concerning whether shareholders’ interests could be served by a corporate DB plan’s investment in risky assets, and their conclusions have never resonated with real-world investors.
However, the statistics of real-world returns drive essentially the same conclusion. Because their focus is on investing to fulfill pension obligations and because the valuations of those liabilities vary independently of asset returns, DB plans face different risks from other investors. Because financial market pricing compensates for the risks faced by investors in general, that compensation is likely to be at odds with the relevant risks faced by DB plans.
A positively sloped yield curve is based on the premise that long bonds are riskier than short bonds. Long bonds therefore provide a very attractive investment for DB plans, as these are actually the low-risk investment for DB plans. Similarly, while historical equity premia might provide adequate compensation for the extra asset volatility large-cap stocks provide over long bonds, this premia is extremely less attractive for a DB plan, because the riskiness of stocks relative to DB plan liabilities is many orders of magnitude larger than that of long bonds. The same result holds for both small-cap stocks and commodity futures. Presumably, this would also be the case for alternative asset classes, if authoritative, inclusive returns data were available.
The special risk characteristics of DB plan liabilities make long bonds the natural investment for these plans, and they also tilt the playing field adversely for other asset classes. DB plans are wholly different animals. This is the real message of LDI. It never hurts to hear it again.
- The Ibbotson database—or any other financial database—provides standardized distributions for asset returns over various sample periods. However, in order to calculate funded-balance volatilities for those assets, we need to posit a distribution for DB plan liabilities. To this end, we took the actual cash flow estimates of a large corporate DB plan. To determine how those cash flows would have changed during the experience of, say, 1984, we evaluated the plan’s liabilities based on AA corporate yields in place on 31 Dec 83. We then rolled all cash flows one year forward and re-evaluated the liabilities based on AA corporate yields as of 31 Dec 84. The difference in these valuations was taken to be the return on plan liabilities during calendar 1984. This process was then repeated using the same set of cash flow (ranging from 1 to 100 years out), but evaluated based on end-of-year yield levels for successive years from 1959 through 2009. This process produced a time series of returns that describes how that particular DB plan’s cash flow valuation would have varied in response to the observed corporate bond yields movements of that period. In order also to make some allowance for actuarial risk within plan liabilities, we also added to these “liability returns” series a computer-generated, normally distributed random variable with an annual volatility of 3% per year. The liability returns series so derived was then compared to the behavior of various asset classes. The process of generating liability returns by evaluating cash flows, rolling them forward, and then re-evaluating with year-later discount rates is the same as is used by brokerage houses such as Merrill Lynch (ML) and others in producing their pension liability return indices. The only differences are that 1) our series extends back to 1960, instead of 1996 for ML and 2) our process uses a single discount rate to evaluate liabilities rather than the yield curves ML and other use. We use a single discount rate rather than a yield curve because that is the practice most common among corporate DB plans currently. Finally, the AA discount rates we used to evaluate cash flows were YTM for Long AA Corporates as published by Barclays Capital (BarCap). While BarCap’s series do not extend prior to 1973, the Federal Reserve does publish series on long Baa and Treasury bond yields extending back to 1920. Over 1973–2009, we regressed the spread of BarCap long AA yields over long Treasury yields on the spread of long Baa yields over long Treasury yields. We then used the resulting regression model to extrapolate long AA spreads over 1960–72 and, thence, to estimate AA yields levels for that period based on actual long Treasury yields and Baa spreads then.
- We don’t distinguish in the text between corporate and public DB plans. It is the case that the risk descriptions in the text hold in terms of pension accounting only for corporate DB plans, for which pension obligations are discounted using high-grade bond yields. For public plans, obligations are presently allowed to be evaluated via a discount rate of expected return on assets, and so the funded-balance volatility for accounting purposes for public plans might not decline when fixed-income asset duration is extended. However, the economics of public DB plans is the same as that for corporate plans, and we would assert that the statements in the text do hold for the “true,” economic volatility/riskiness that both corporate and public plans face. There is substantial agreement on this within financial circles, and, indeed, there is a nascent effort underway to make public-sector pension plan accounting rules more in consonance with those for corporate plans.
- Yes, a standard finding in the finance literature is that investors are compensated NOT for asset volatility per se, but for how much the returns of an asset vary relative to those of the market portfolio. It is upon this sensitivity that asset “beta” is measured. It is still the case, though, that asset beta is based on the asset’s volatility relative to the market portfolio, NOT relative to a DB plan’s liabilities, and so our conclusion is still valid that market pricing of risk probably does not cohere with the risks that DB plans actually face.
- See Effective LDI: When Do Bond Swaps Help?, October 2006 and The Right Way To Use Swaps in LDI, May 2007, both available on our website.
- Clearly, the fixed-income return indices available to us are constantly being augmented by newly-issued bonds. In order to fully prove the statement in the text, we would have to track realized returns to maturity bond by bond. Instead, we base the assertion in the text on the fact that the realized excess returns on corporate credit indices typically fall far below the option-adjusted spreads (OAS) calculated for those indices. But for downgrade and default experience, OAS and realized returns would track identically over time (provided fluctuations in the levels of yields smoothed out). The substantial “underperformance” of realized excess returns relative to OASs is a clear indication of the importance of downgrade and default experience for corporate bond returns.