

Ion Dan
Portfolio Manager

Elliott Neumayer
Product Specialist
KEY TAKEAWAYS
- Agency MBS are pools of securitized residential mortgage loans that are issued and guaranteed by US government agencies.
- The agency MBS investable universe is broad, providing a large opportunity set for security selection.
- Agency MBS typically offer a yield advantage over USTs that have similar duration and credit quality, which can create excess return opportunities due to prepayment risk management.
- Historically, agency MBS have outperformed USTs and the risk-adjusted returns of agency MBS are attractive compared to high-quality corporate credit.
- Agency MBS have been less correlated with equities than have corporate bonds, offering diversification benefits.
- Replicating agency MBS indices is non-trivial. Active investors in the agency MBS market have opportunities to generate alpha from sector rotation, security selection and duration management while targeting tracking error relative to the benchmark.
- Investors should consider including agency MBS as a core allocation in their fixed-income portfolios.
What Is the Agency MBS Asset Class?
Only rivaled by the size of the US Treasury (UST) market, agency mortgage-backed securities (MBS) represent the second largest segment of the US bond market, constituting 27% of the Bloomberg Aggregate Index.
Agency MBS are created when residential mortgage loans that meet agency underwriting guidelines are secu- ritized into a pass-through security. Investors in pass-through securities receive the underlying loans’ principal and interest net of servicing and guarantee fees. Exhibit 1 illustrates the MBS securitization process.

These securities are issued and guaranteed by Fannie Mae, the Federal National Mortgage Association (FNMA), Freddie Mac, the Federal Home Loan Mortgage Corporation (FHLMC) and Ginnie Mae, the Government National Mortgage Association (GNMA). Fannie Mae and Freddie Mac focus on home loans that adhere to government-spon- sored enterprise (GSE) guidelines, whereas Ginnie Mae focuses on home loans originated under programs of the Federal Housing Administration (FHA), US Department of Veterans Affairs (VA) and Department of Agriculture and Rural Housing Service (RHS).
Ginnie Mae MBS are deemed to be without credit risk and backed by the “full faith and credit” of the US govern- ment, like UST bonds. While the GSEs remain under federal conservatorship, it is understood that there is limited credit risk in Fannie Mae and Freddie Mac MBS.
The Agency MBS Investable Universe
The agency MBS sector offers investors more than one million securities, including pass-through pools amounting to a market size of $9.3 trillion with daily trading volumes averaging over $240 billion. Structured agency MBS, also known as collateralized mortgage obligations (CMOs) are comparatively smaller with a market size of $1.4 trillion and average daily trading volumes of only $1.5 billion.1
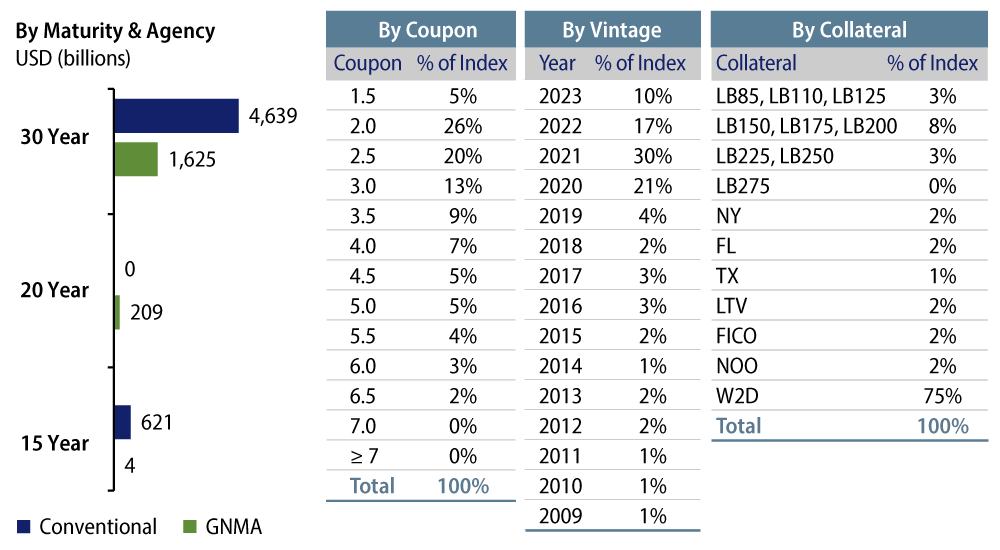
The Bloomberg US MBS Index is widely used as the benchmark for agency MBS. Unlike other benchmarks, MBS indices are not a perfectly replicable basket of tradable securities. The index consists of hundreds of “cohorts” that represent a specific mortgage issuer (Fannie Mae or Freddie Mac represented as conventional MBS and Ginnie Mae represented as GNMA), terms (loan amortization schedules of 30, 20 or 15 years), year of origination (vintage), coupons (by half percentage point) and collateral (specified pools and generic). Importantly, cohorts do not contain securities with actual CUSIPs that investors can source in the marketplace, and the diverse profile of the pools contained in each cohort make passive replication non-trivial, as even the most careful selection of pools will result in some tracking error. Exhibit 2 shows a top-level view of the Bloomberg US MBS benchmark.
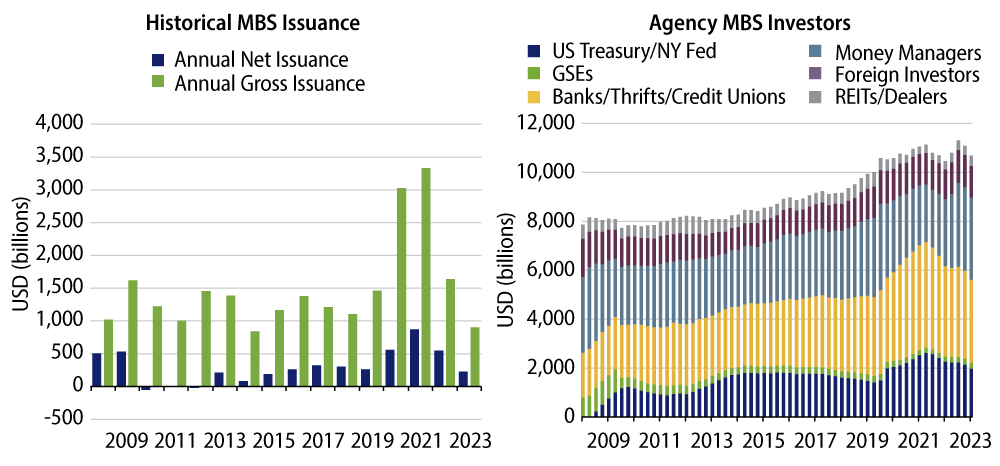
Since 2008, annual gross and net issuance averaged $1.6 trillion and $280 billion, respectively, for agency MBS with 2020 a record year for supply as interest rates declined meaningfully and refinancing was elevated. On the demand side, market participants extend beyond money managers, with US banks and foreign investors representing a significant source of demand, as well as the US Federal Reserve (Fed) involvement since 2009. Exhibit 3 depicts yearly MBS issuance and the trends in the holdings of major investors from 2008 to 2023.
The “To-Be-Announced” (TBA) Market
The vast majority of agency MBS trading occurs through the TBA market. A TBA is effectively a forward settlement transaction—a contract that specifies the price and quantity of MBS to be bought or sold at a specific future date. The seller of the TBA agrees on a sale price, although they do not specify which particular mortgage pools will be delivered to the buyer on settlement day; only a few basic characteristics of the pool are agreed upon, such as the issuer, maturity, coupon rate and the face value. TBA transactions are governed by specific rules set by several professional organizations including both the Securities Industry and Financial Markets Association (SIFMA) and the Treasury Market Practices Group (TMPG).
The TBA market is based on the fundamental assumption that one agency MBS pool can be considered inter- changeable (fungible) with another pool that has similar characteristics. The seller has control over the delivery and will seek to select the “cheapest to deliver” securities. The buyer anticipates “adverse selection” in exchange for the liquidity of the TBA transaction. These trading conventions enable an extremely heterogeneous market of multiple agency MBS pools to be distilled into standardized TBA contracts, which supports the liquidity profile of MBS pools. TBA trading is governed by a Master Securities Forward Transaction Agreement (MSFTA), which requires counterparty onboarding and margin exchange, improving market liquidity for all participants.
Specified Pools
Specified pools are pass-throughs with distinctive attributes that make them more valuable and they typically trade at a premium (known as “pay-up”) to TBAs. Borrowers’ loan size, seasoning (months since issuance), geography, credit score (FICO), equity position (loan-to-value), occupancy, as well as the choice of mortgage originator and servicer all lead to variations in prepayment behavior and total return performance across MBS securities. Investors can focus on call or extension protection features through security selection in specified pools.
Agency Collateralized Mortgage Obligations (CMOs)
Agency CMOs are constructed from agency MBS pools by redistributing the principal and interest cash flows into various customized tranches. Multiple structure types are available, offering a wide range of average life and prepayment risk profiles for out-of-index opportunities. The inherent risks with CMOs, especially mortgage derivatives such as interest only (IO) and principal only (PO) structures, can be a much greater prepayment risk and a substantial give-up in liquidity.
Why Invest in Agency MBS?
Yield advantage over USTs due to prepayment risk
The yield advantage of agency MBS relative to intermediate USTs represents a significant source of alpha for a similar credit quality investment (Exhibit 4). The asset class outperformed intermediate USTs over longer in- vestment horizons, a key consideration for investors looking to include agency MBS as a core allocation in their fixed-income portfolios.

Exchange credit risk for prepayment risk
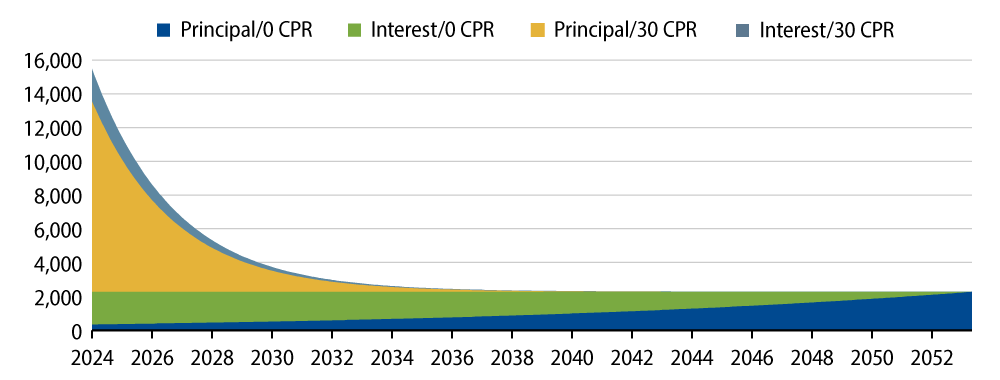
While the issuing agency guarantees limit credit risk for investors, the mortgage contract stipulates the scheduled interest and principal amortization payment over the loan term. However, US mortgage borrowers can repay their loan in full or in part at any time without penalties. This introduces optionality to agency MBS cash flows, as prepayments can create uncertain maturities for investors. The hypothetical repayment schedule of an agency MBS including an illustration of prepayments is shown in Exhibit 5.
Prepayments can occur for a variety of reasons, including housing turnover, as borrowers move for employment opportunities or upsize/downsize their homes. However, refinancing activity is the key driver of prepayments, as borrowers can refinance into a lower mortgage rate to reduce monthly payments when interest rates fall. Be- cause of prepayments, the duration of agency MBS can be much shorter than the term of a typical 30-year loan.
Agency MBS have embedded negative convexity. This means that the duration of agency MBS generally changes in the same direction as the change in interest rates, which makes the price sensitivity of these securities different relative to a fixed-rate bond with the same coupon and fixed duration. As a result of prepayments increasing, the expected maturity (duration) of an agency MBS shortens as principal is returned sooner and the investor will be faced with reinvesting at lower rates. Conversely, when rates increase and prepayments slow, the duration of agency MBS cash flows extends.
The level of refinancing activity is dependent on the direction of interest rates and the refinancing incentives of borrowers. For example, if a mortgage borrower has a loan at a 7% interest rate and prevailing mortgage rates drop to 6.5%, the borrower can refinance the original loan and take out a new loan at the lower rate. Typically, a 0.5% interest rate incentive offers an economically reasonable break-even time to overcome the refinancing costs through the savings of lower monthly mortgage payments. Exhibit 6 shows a history of mortgage rates and refinancing activity, using the Mortgage Bankers Association (MBA) Weekly Survey of Mortgage Refinancing Applications. Exhibit 7 shows the MBA Mortgage Credit Availability Index and an estimate of the refinancing incentive for all US borrowers at various mortgage rates. Post-Covid, prepayment risk is structurally low with most borrowers having already refinanced into sub-4% mortgage rates.


Attractive risk-adjusted return profile
Agency MBS have historically offered a high risk-adjusted return profile compared with similar high-quality fixed-income sectors, as highlighted in Exhibit 8. Key features from the historical comparison include lower volatility, better downside outcomes and a low correlation to equities.

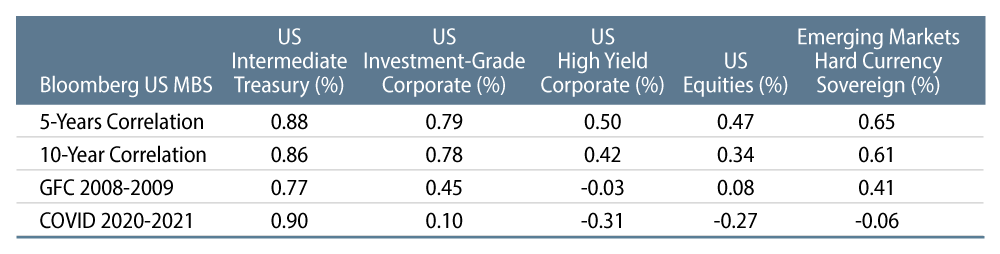
Agency MBS have been less correlated with stocks than have corporate bonds, offering overall portfolio diversification as shown in Exhibit 9, especially during times of market stress. Historically, the correlation of agency MBS returns is highest with USTs.
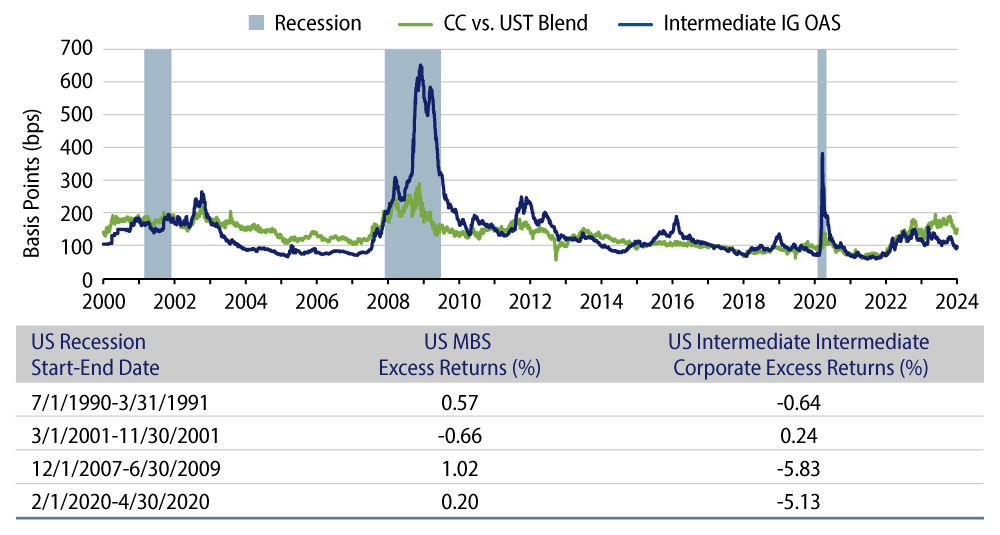
Agency MBS vs. Corporate Bonds During Past Recession Periods
When economic growth contracts, businesses and consumers facing stress results in different outcomes for agency MBS compared to corporate bonds. Under the guarantee framework of the issuing agencies, delinquent mortgage loans are bought out from agency MBS securitizations, in which case the investor in that pool receives back the pro-rata principal value of the underlying loan. An early return of principal represents a prepayment. On the other hand, corporate credit investments can experience defaults and potential loss on principal during periods of recession. Exhibit 10 shows the historical spread volatility of investment-grade corporate bonds versus agency MBS and compares the excess returns of the two sectors, highlighting the diversification benefits of agency MBS during past recessions.
The Federal Reserve and Agency MBS
Agency MBS are a key market for consumer credit intermediation, including in the Fed’s asset purchase programs (known as quantitative easing or QE) during times of economic weakness as a way to provide stimulus via lower mortgage rates for US homeowners. During QE efforts the Fed is adding liquidity to the market distorting normal market functions. When the Fed is tapering its purchases, there can be attractive investment opportunities for active investors as there is more potential volatility in the market.
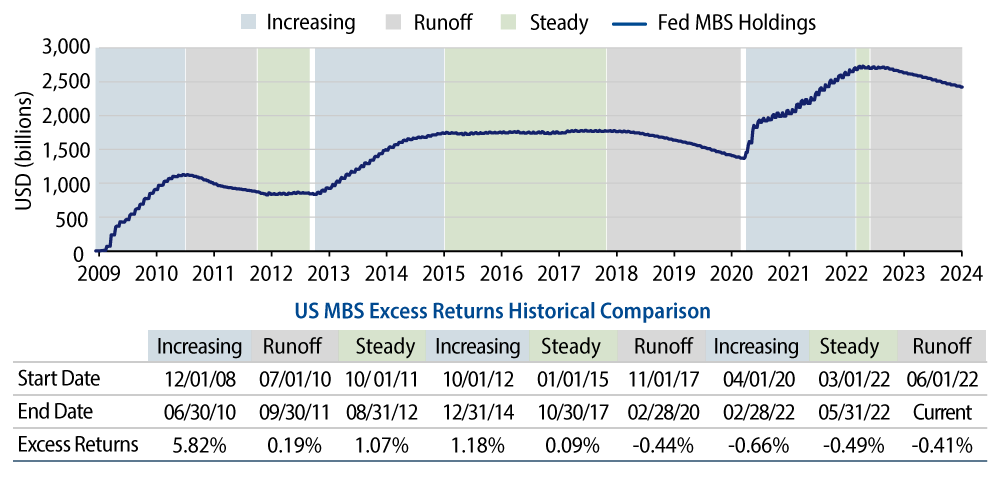
Historically, we identify three distinct phases for the Fed’s agency MBS balance sheet: increasing (active QE purchases and reinvestment of principal prepayments), steady (reinvestment of principal prepayments only) and runoff (no reinvestment happening) as shown in Exhibit 11. Currently, the Fed owns approximately 31% of the agency MBS market, versus 18% in 2013 at the end of QE2 and 23% at the end of QE1. Historically, as QE programs have shifted through various phases, so there is potential for excess returns from active management.
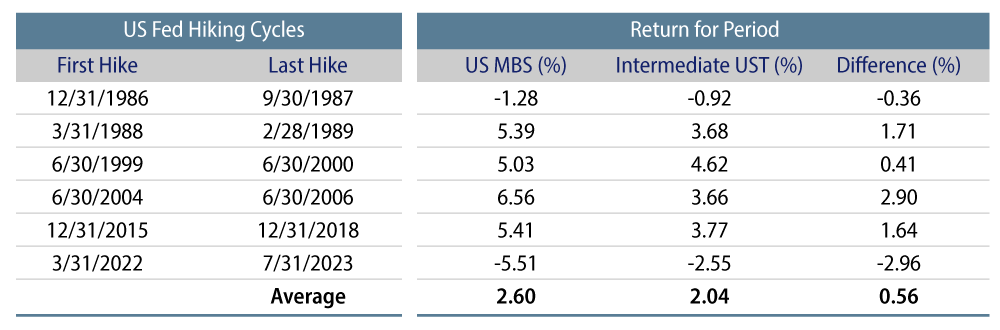
Agency MBS have historically outperformed intermediate USTs during Fed tightening cycles, allowing investors to generate excess returns in rising-rate environments (Exhibit 12) but interest rate volatility, duration extension and the yield (coupon) level remain key drivers of return outcomes.
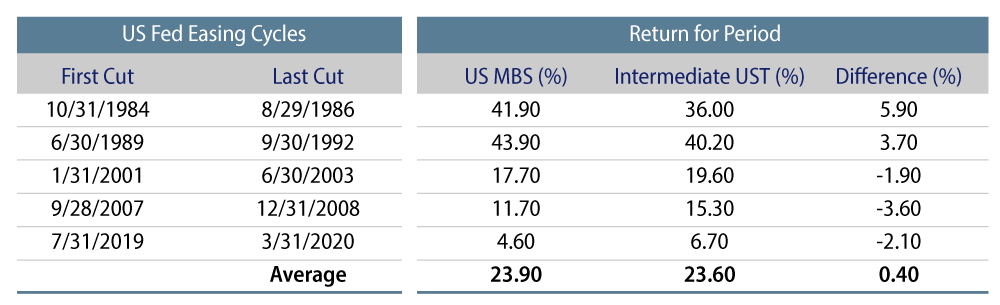
Agency MBS have produced mixed results relative to intermediate USTs during Fed easing cycles, as volatility and refinancing activity picked up especially during recent easing cycles (Exhibit 13).
What Are the Risks?
Changes in the following elements will impact MBS prices:
- Interest Rates: Fixed-income securities will decline in value because of an increase in interest rates; a security or fund with a larger duration will be more sensitive to changes in interest rates.
- Spreads: Similar to any nongovernment fixed-income security, agency MBS valuations are subject to changes in spreads. If spreads widen, the prices of agency MBS will decline, and vice-versa.
- Prepayment: When homeowners pay back more principal than required by the regular amortization schedule, it is considered a prepayment. This may occur for a number of reasons; for example, the homeowner might refinance into a mortgage with a lower rate, experience a life-changing event (relocation for a new job, divorce or death) and move into a new home. Because the principal is being returned to the investor at par, this can detract from returns if the MBS was purchased at a premium price. The idiosyncratic aspect of prepayment risk is reduced by the aggregation of large numbers of loans across specified pools.
- Convexity: MBS’ price/rate relationship is negatively convex due to the likelihood the homeowner will refinance into a lower-rate mortgage when yields fall, and conversely, the homeowner’s tendency to remain in the mortgage when yields rise. As a result of prepayments, the expected maturity (duration) of the security shortens, as principal is returned sooner and the investor will be faced with reinvesting at lower rates. When rates increase and prepayments slow, the duration extends. This can cause MBS prices to decrease during rate selloffs more than they increase when the rate rallies.
- Volatility: Due to the homeowner’s embedded option, MBS are exposed to changes in volatility. An increase in volatility can result in MBS underperformance.
- Credit Risk: While the issuing agencies guarantee the timely payment of principal and interest cash flows to investors and these agencies are backed by the US government, agency MBS prices may fluctuate in response to the market’s perception of the issuers’ creditworthiness. Extensive macro, collateral and structural analysis can further mitigate this risk.
- Liquidity Risk: Reductions in bond counterparty capacity may contribute to decreased market liquidity and increase price volatility. Bond investments may be worth more or less than the original cost when redeemed, depending on market conditions.
These risks can be mostly mitigated by active portfolio management, emphasizing top-down macro themes and bottom-up loan level research in portfolio construction. Exchange-traded funds (ETFs) focused on passive replication have on average historically underperformed the index annually by -16 basis points (bps) over the past three years, -8 bps over the past five years, and by -14 bps over the past 10 years as of December 31, 2023.2 Western Asset takes an active approach, focused on long-term fundamental value and using multiple diversified strategies. Our active investment style is focused on MBS subsector rotation, security selection, portfolio hedges and duration management, all of which provide the flexibility to potentially generate risk-adjusted returns that exceed those of benchmark replication strategies.
Agency MBS Are a Core Holding in Fixed-Income Portfolios
Agency MBS are one of the largest and most liquid US fixed-income markets—with cash flow guarantee features backed by the US government—and have outperformed intermediate UST bonds over longer investment horizons. We believe active investors in the agency MBS market have significant opportunities to generate alpha from sector rotation, security selection and duration management relative to the benchmark. Historically, the risk-adjusted returns of agency MBS are one of the most attractive with lower volatility compared to similar high-quality US fixed-income sectors. The asset class also provides portfolio diversification benefits and low correlation to equities, especially during times of financial market and economic stress. For all of these reasons, we believe investors should consider including agency MBS as a core allocation in their fixed-income portfolios.
- Securities Industry and Financial Markets Association (SIFMA), as of December 2022. Average trading volumes were calculated over the last 7 years.
- Morningstar, Western Asset. As of 31 Dec 23.