

Michael J. Bazdarich, PhD
Product Specialist/Economist
KEY TAKEAWAYS
- Inflation has already declined back near the Fed's 2% target based on recent monthly trends.
- Disinflation without recession highlights the key role supply recoveries and policy reversals have played.
- Shelter inflation should moderate soon as home prices have stabilized after surging earlier.
- Most services components already show inflation at 2% or clearly on downward trends.
- The supercore PCE pop in July appears transitory rather than signaling a resurgence of inflation.
Introduction
After a tumultuous period of accelerating inflation in late-2021 and early-2022, inflation has decelerated steadily and more meaningfully in recent months. We argue here that recent monthly rates of inflation are already essentially back at the Federal Reserve’s (Fed’s) target, so that the task now is merely to sustain recent inflation rates. Inflation need not be reduced further, at least not in order to attain Fed targets.
The path back to declining inflation has been a painful one, but amid this process, the economy has held up better than most expected little more than a year ago, when the Fed first embarked on an aggressive tightening scheme. We think that the confluence of sharply falling inflation opposite a no-recession economy is testament to how important supply-side factors were both in exacerbating price pressures in 2021 and early-2022 and easing price pressures more recently.
Unfortunately for us, we did not appreciate how significant supply-side factors were in driving the inflation run-up. It could also be said that demand-side impetuses for inflation from the Fed and the federal government were more significant than we realized two years ago. As painful as those memories are, the fact remains that both monetary and fiscal policies have swung from stimulus to restriction in the last two years, while supply-side factors have changed from inflationary to deflationary. These swings lead us to believe that inflation will indeed fall further, presumably very soon, enough so to stay the Fed’s hand with respect to further rate hikes.
The rest of the paper walks through the details of this position. We’ll work through the nuts and bolts of current inflation data. We’ll discuss the reversals in supply conditions, as well as monetary and fiscal policy, and, finally, we’ll detail what we got wrong and right in past discussions of US inflation.
Inflation Already Low, Recently
Yes, inflation has—finally—decelerated substantially over recent months. In fact, we would go so far as to assert that recent inflation rates have essentially already pulled back down to the Fed’s target range.
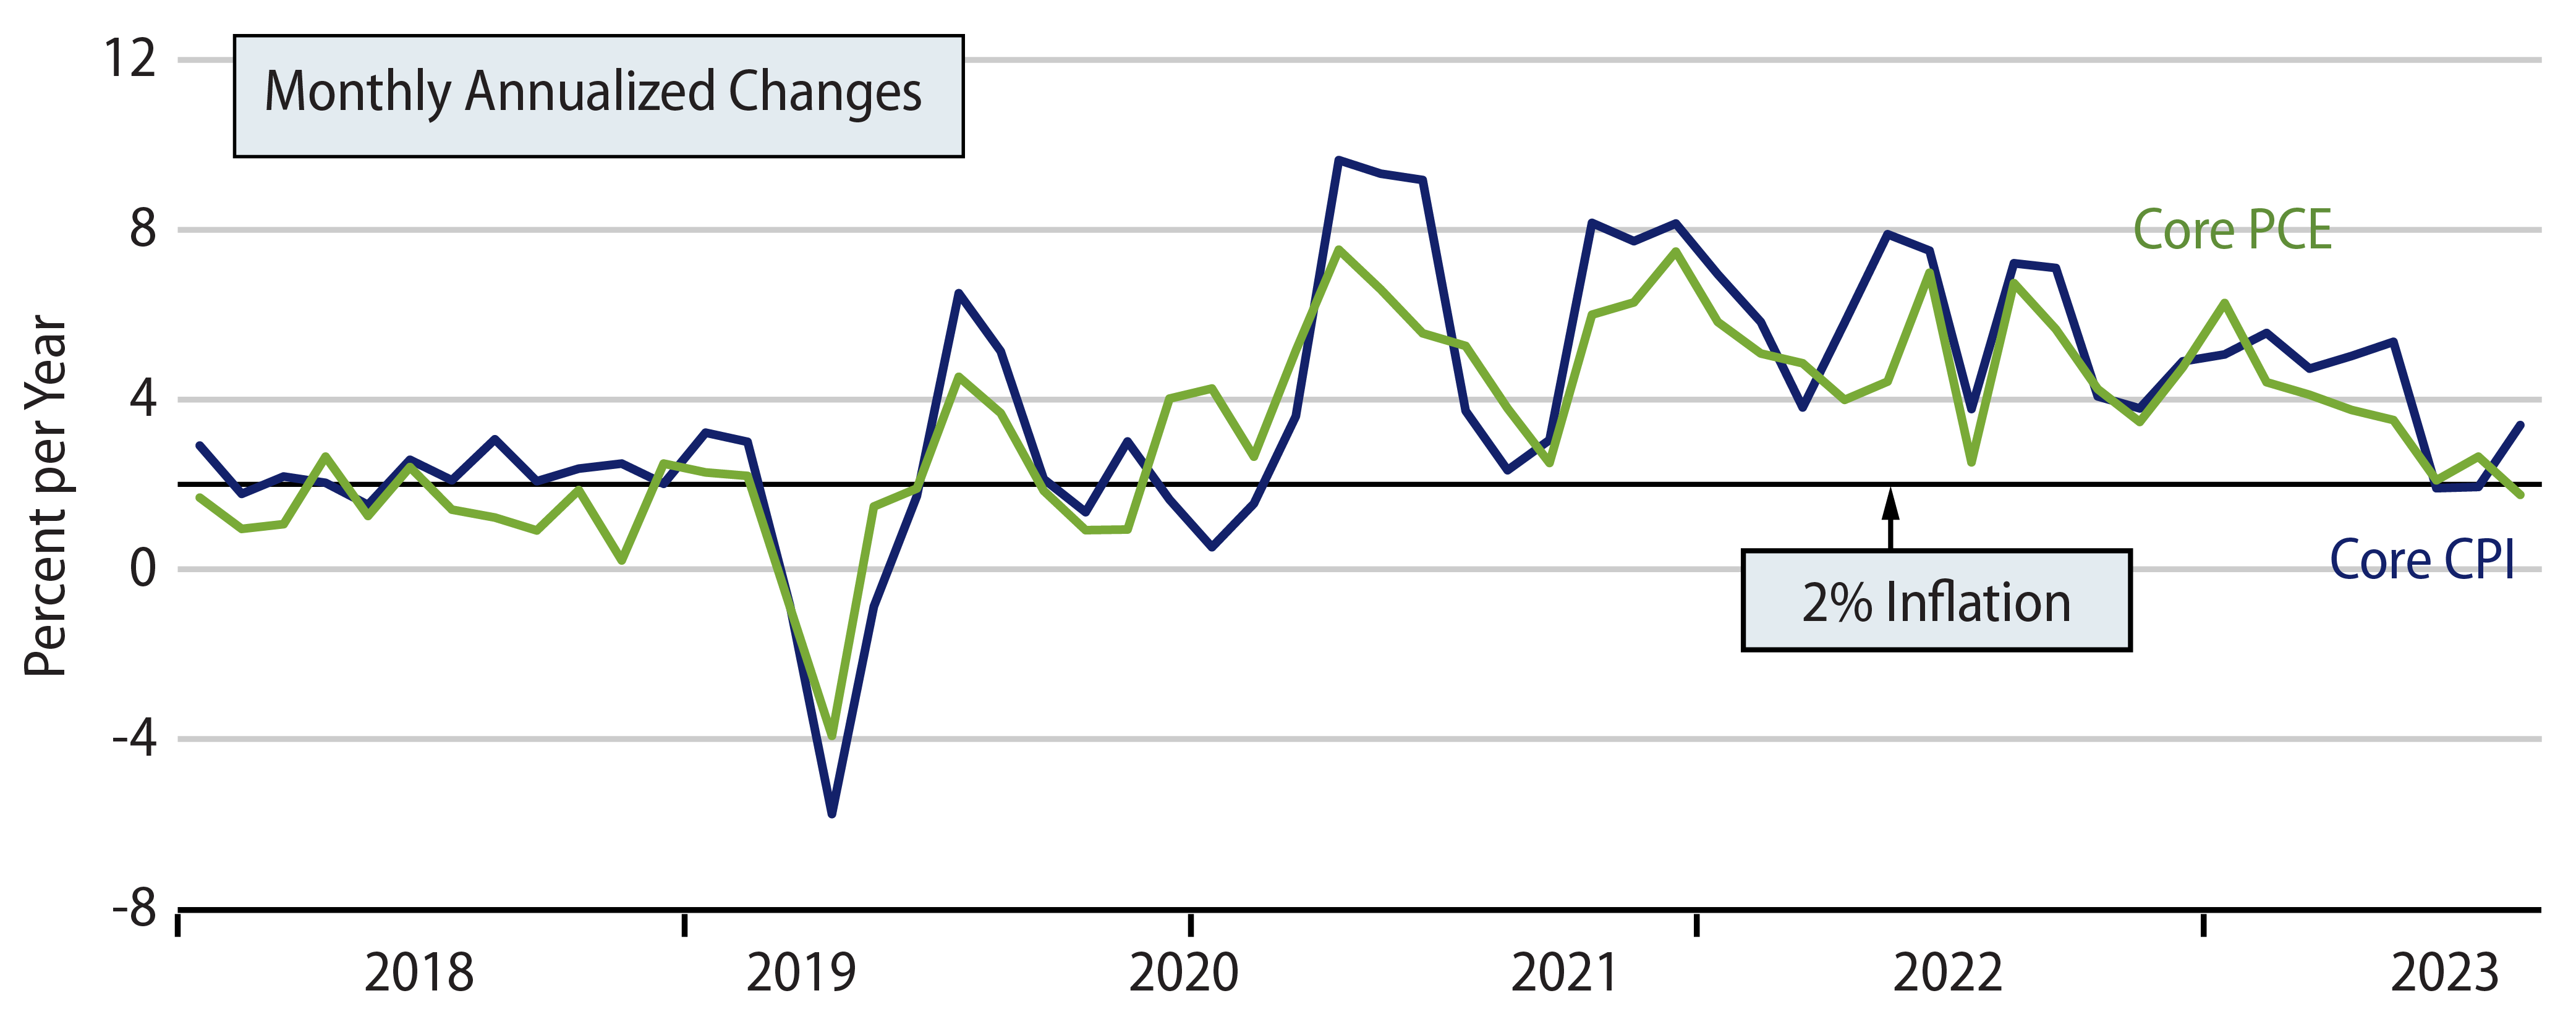
Yes, core Consumer Price Index (CPI) inflation was at an annualized rate of 2.8% over June-August, and core Personal Consumption Expenditures (PCE) averaged 2.2% over that period. However, as Fed Chair Powell has pointed out, that includes shelter prices, which, due to technical lags in the government data collection methods, are still registering increases on the order of 6% per year, even though actual market values of home prices and rents stabilized in mid-2022.
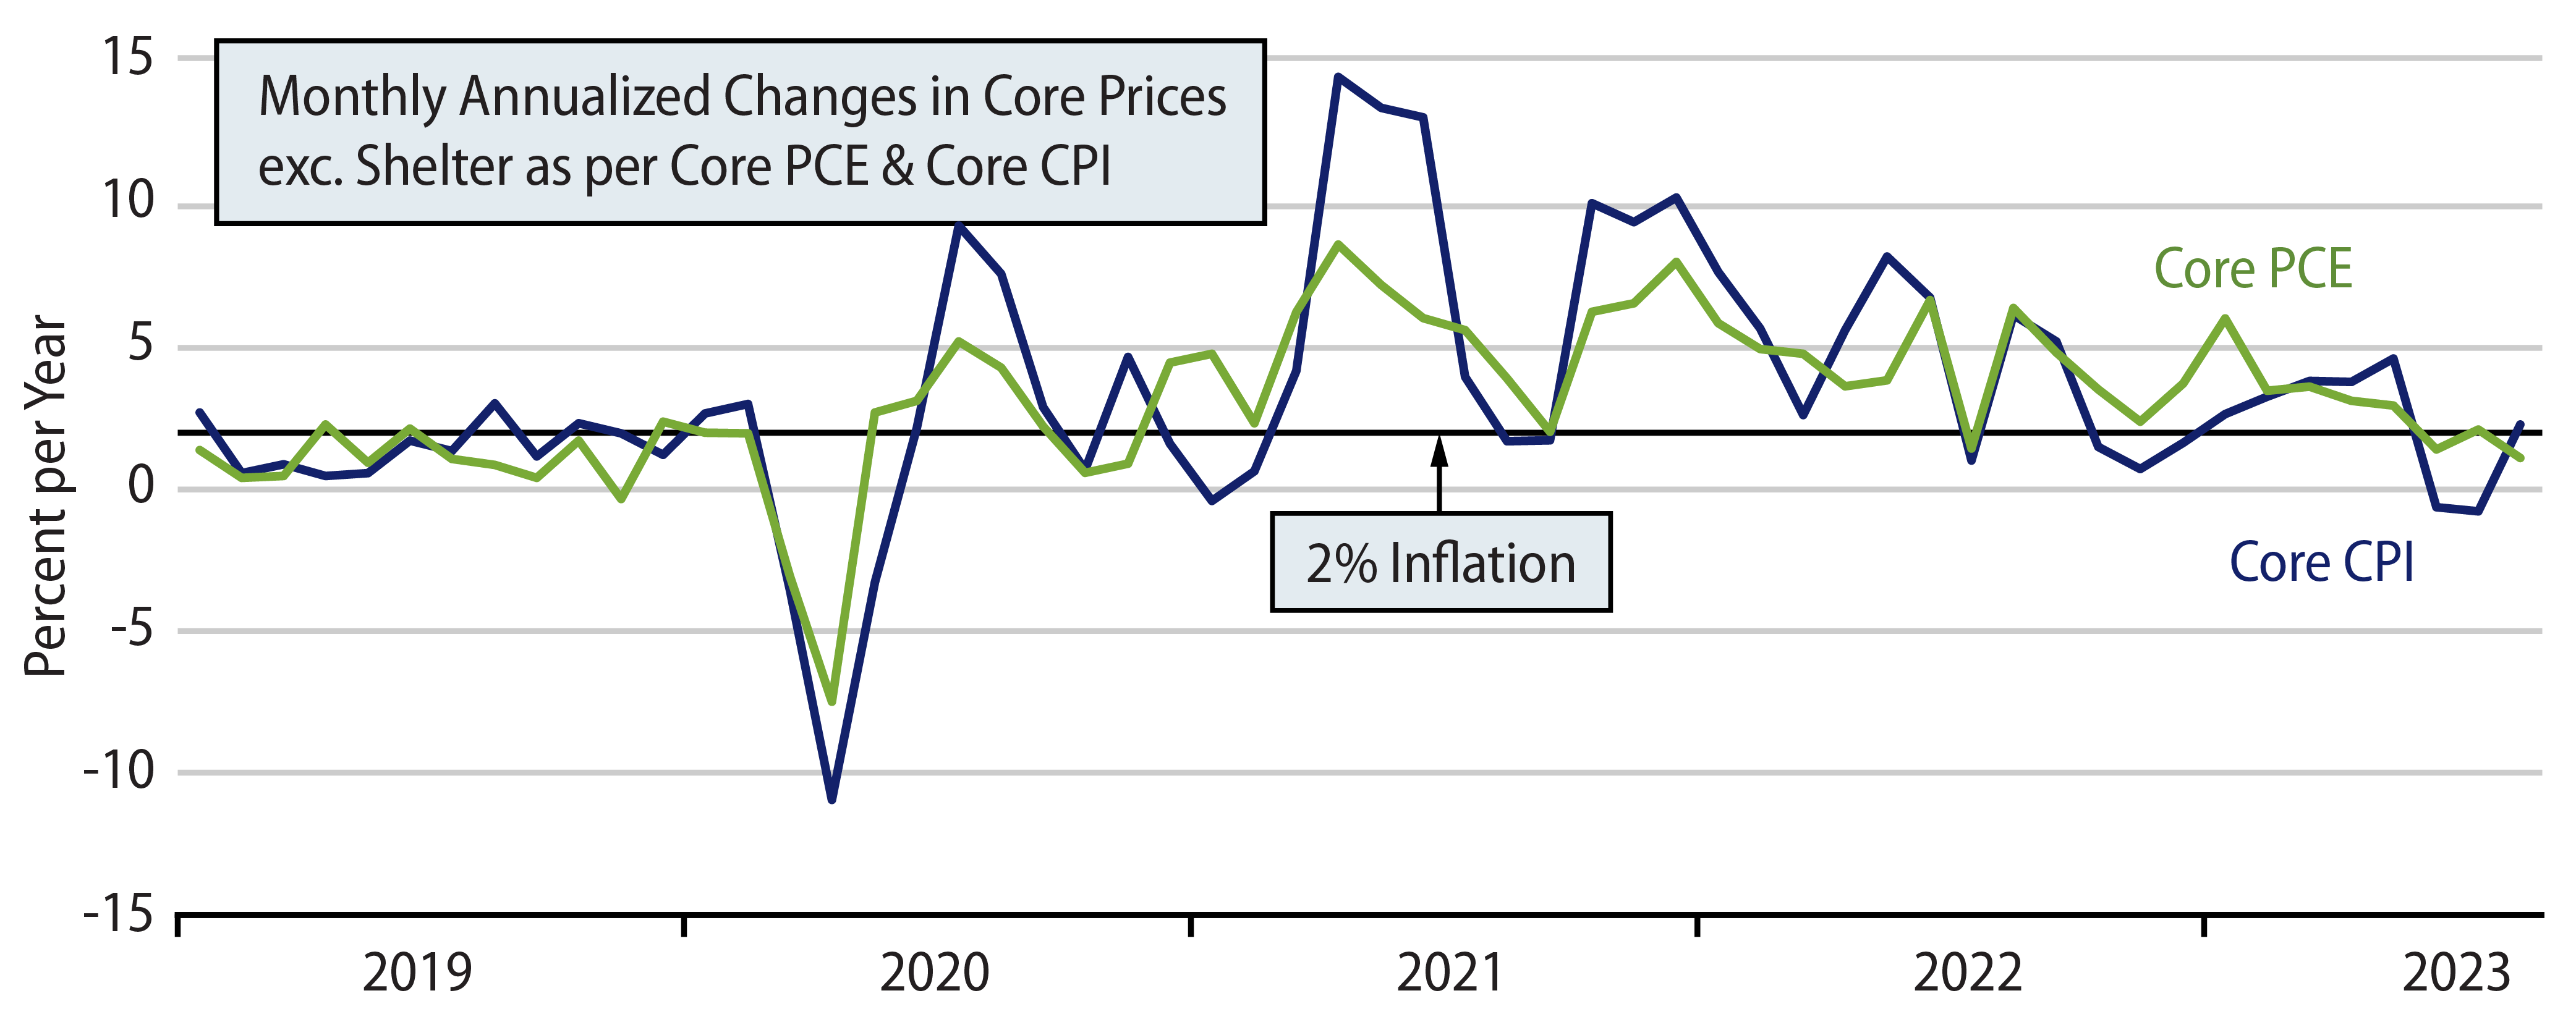
Excluding shelter, core CPI averaged a 0.3% annualized rate over June-August, while core PCE averaged 1.5% (Exhibit 2). So, when we said earlier that inflation was “essentially” at the Fed’s targets, we meant that once one accepts the issues surrounding shelter inflation and looks at inflation data accordingly, recent rates have been consistent with the Fed’s targets. Now, we need to address a few fine points.
First, our analysis and charts deal with one-month annualized inflation rates—both the 12-month average rates more popular in the financial press. Of course 12-month inflation rates are still well above 2%. Anyone versed in statistical analysis knows that a 12-month rate of change tells us what was going on with an indicator six months ago or more.
As you can see in all the inflation charts shown here, inflation rates have been trending lower, dropping for over two years, with ever-lower highs and ever-lower lows within short-term monthly oscillations. So, 12-month inflation rates have necessarily been lagging indicators of “current” inflation throughout that period. Underlying inflation rates were higher six months ago than they are now and the 12-month inflation rates so popular in the financial press merely reflect that.
Second, one month does not make a trend, and neither do two months. Yes, for the Fed to declare victory over inflation, monthly inflation rates are going to have to sustain their recent pace a while longer. That is no mean feat, but it is much less formidable a task than having to push current inflation rates yet lower.
Third, when Mr. Powell acknowledged the technical distortions (lags) in currently reported shelter prices, he also stated that goods prices had already fallen to the negative inflation rates seen prior to Covid, so that victory over inflation required further progress on services prices. Since those remarks, economists have been paying special attention to so-called supercore inflation, services inflation excluding shelter and utilities (utilities being energy services and excluded from core).
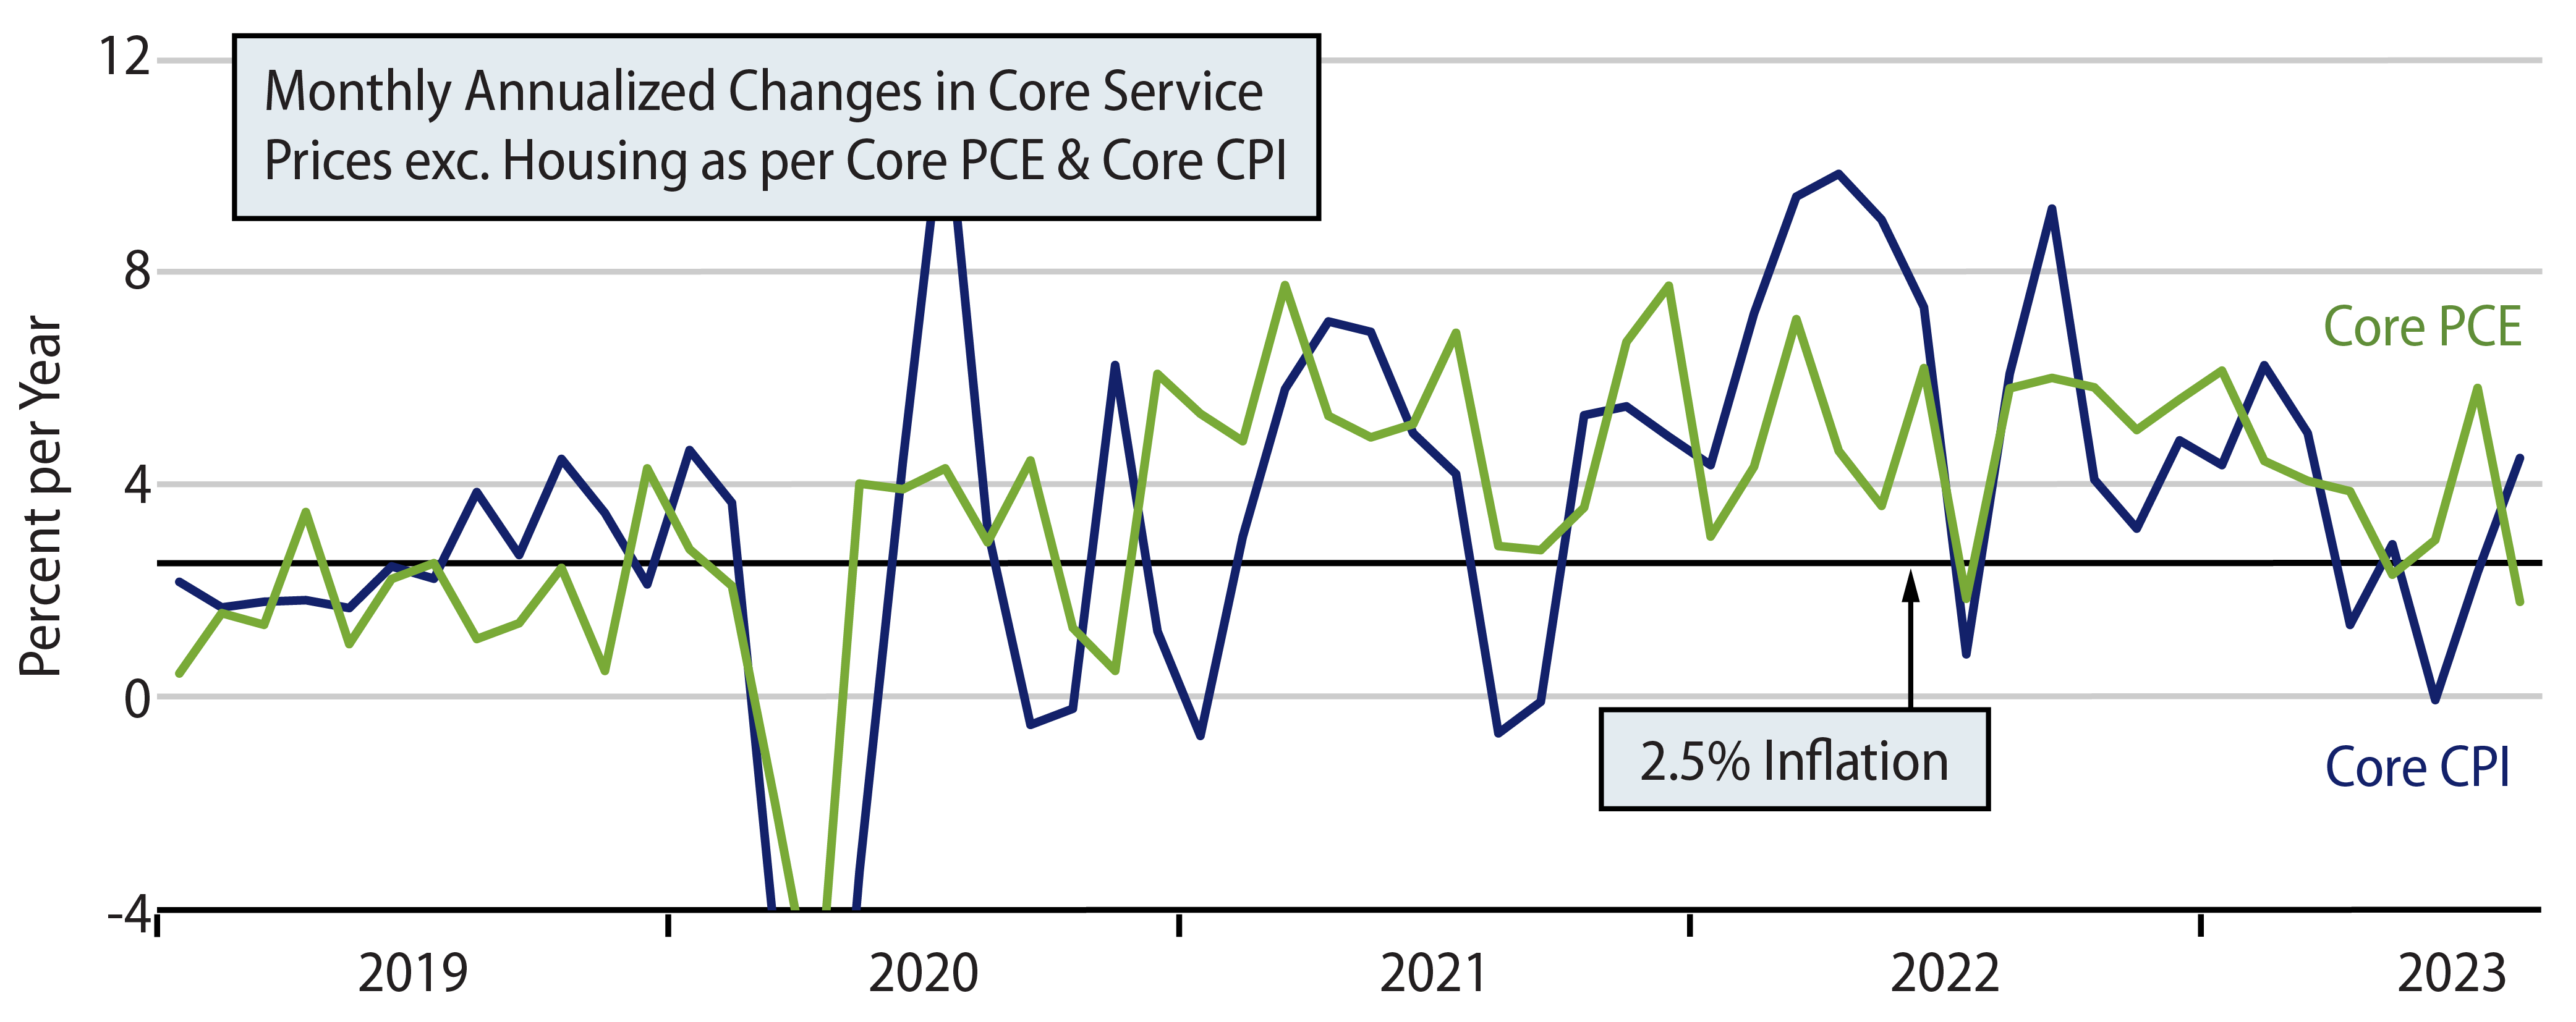
Exhibit 3 shows supercore inflation as per both the CPI and PCE. In the chart, we’ve drawn a line at 2.5% inflation, which would be consistent with the Fed’s 2.0% target for overall core inflation. Since goods prices typically rise more slowly than services prices, a 2.5% rate of increase in services inflation is in fact consistent with 2.0% overall inflation.
As seen in Exhibit 3, supercore CPI has been trending lower since early-2022 and has been at or below 2.5% for four months now. Supercore PCE had also been trending lower and was flirting with the 2.5% level through June, but then popped in July to a 5.7% rate.
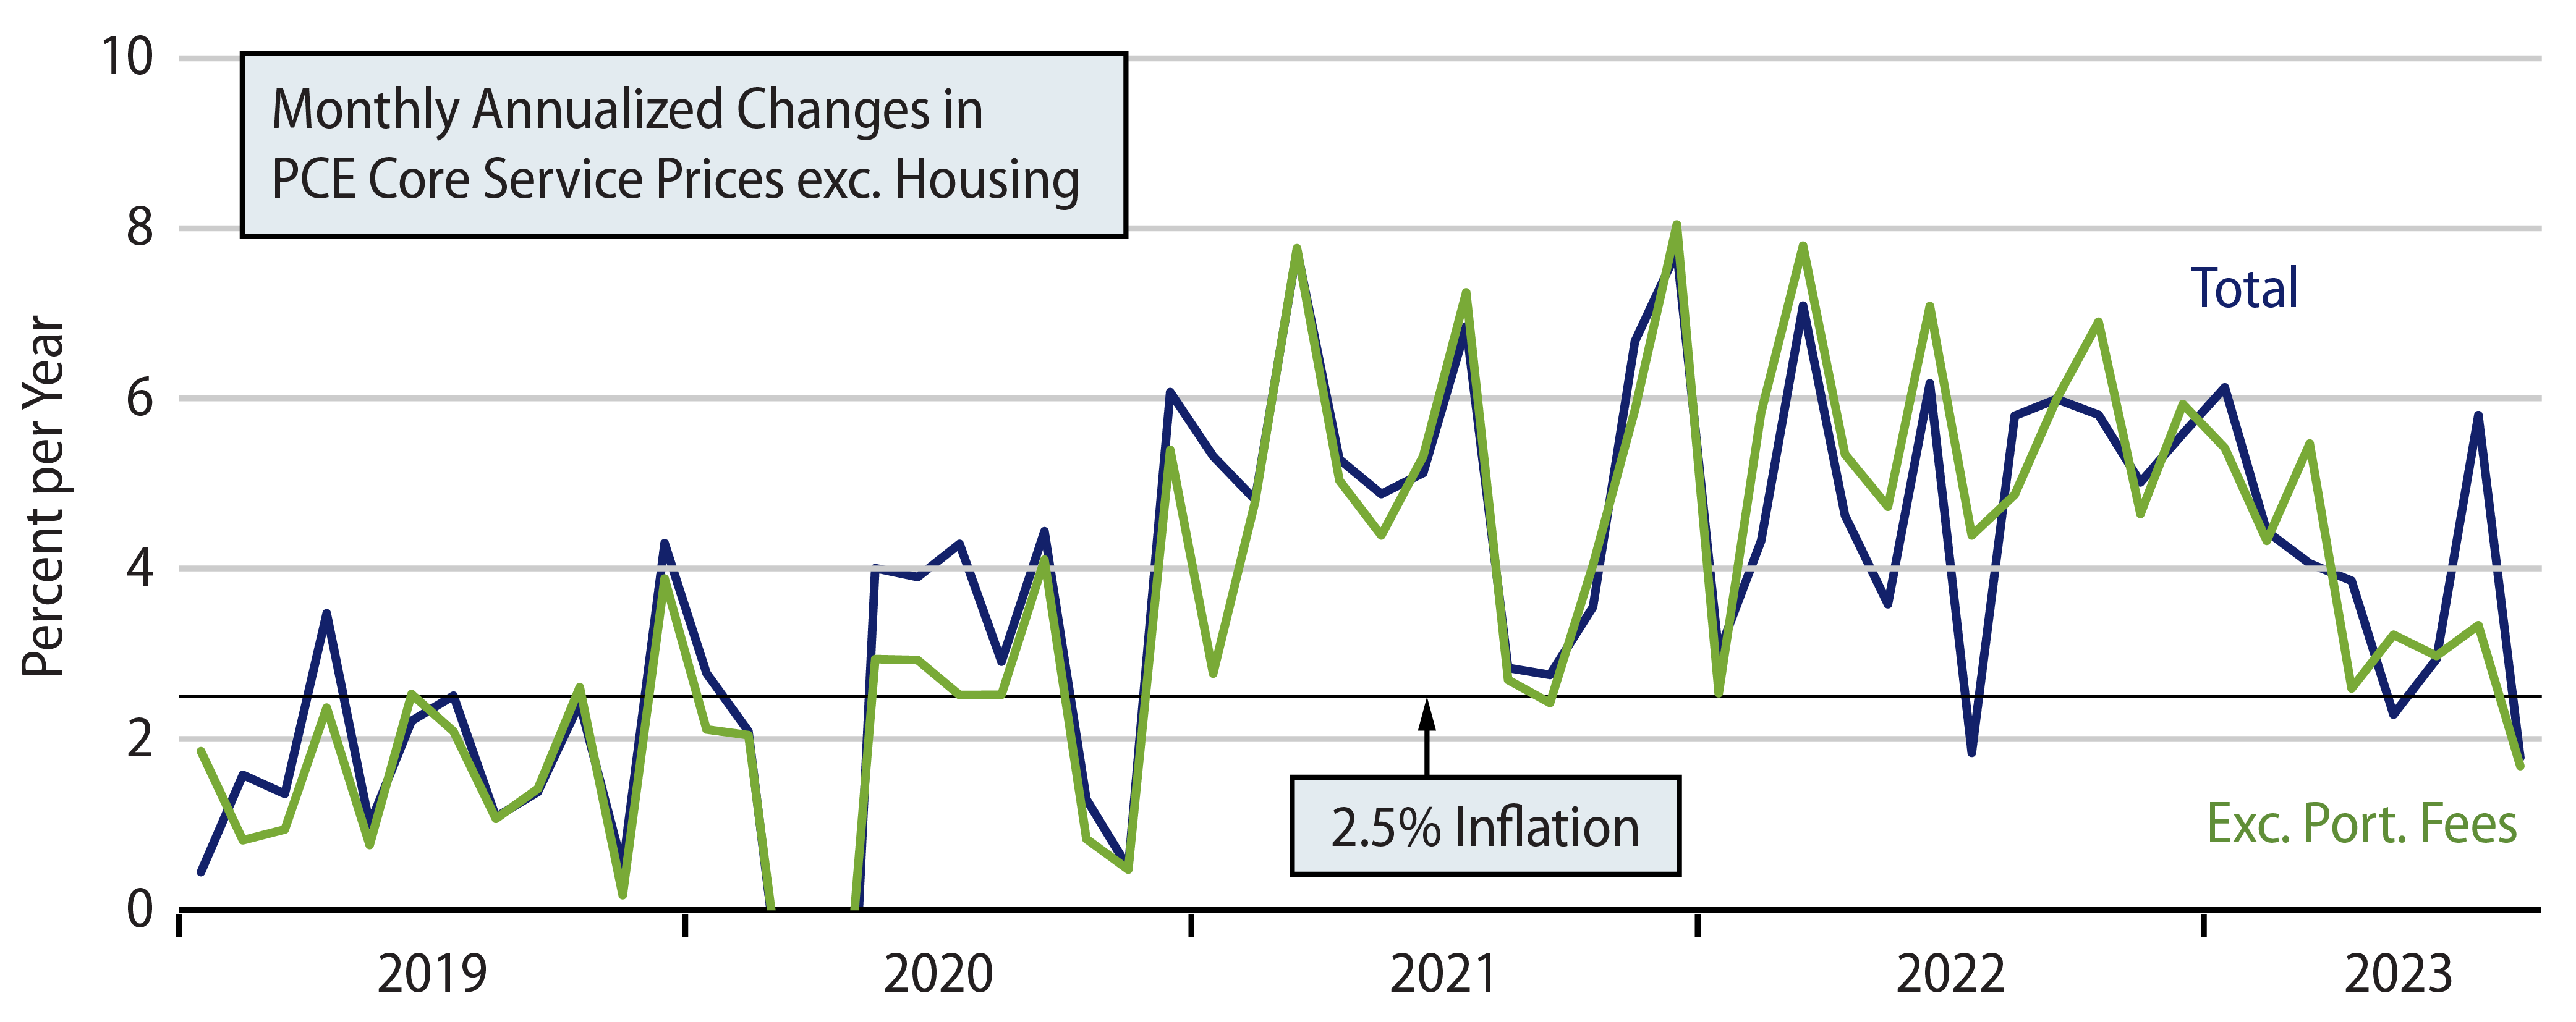
Did supercore PCE suddenly resurge in July? Why was this not reflected in the CPI? The answer to the first question is that all of the apparent July acceleration in supercore was due to a 7.3% non-annualized jump in investment advisory fees, of all things. While that component accounts for only 3.2% of supercore services, a 7.3% bulge is enough to provide a substantial one-month boost. Indeed, upon abstracting from investment management fees, supercore inflation remained on a decelerating trend in July and was within spitting distance of the 2.5% threshold, as is seen in Exhibit 4.
As to why this bulge was not reflected in the CPI, the answer is that investment management fees are not included in the consumer “basket” that comprises the CPI. The PCE, on the other hand, is a component of GDP. Investment management fees have to enter somewhere into GDP, and the Bureau of Economic Analysis—which constructs GDP data—has seen fit to lump these in with consumer expenditures, hence its inclusion in the PCE.
Now, you may be thinking that we are cutting things down too finely, first excluding utilities, then shelter, and now investment management fees from services inflation. Fair enough. Exhibit 10 (see Appendix on page 9) walks through the inflation details for all 20 major components of services inflation. For the five largest components, comprising 79% of services consumption, inflation is either already at the 2.5% threshold or clearly decelerating to that level. Most of the other components also show either clear deceleration or inflation rates already at 2.5%. Only a few components fail to evince a clear decelerating trend, and even these are oscillating around relatively low levels.
The first five components shown in the array constitute 79% of all service inflation (not just core or supercore services). Of these, three are already at 2.5% average inflation, and the others show distinct decelerating trends. Of the remaining 15 components, the only ones well above 2.5% and not showing a clear decelerating trend are out-of-home recreation (Exhibit 10E), possibly automotive services (10H), the aforementioned investment management fees (10I), and household insurance (10P). Even these four components have all recently oscillated around acceptable inflation rates.
Bottom line, it is clear from the details that decelerating inflation is indeed firmly established within the service sector, despite the July bounce in supercore PCE. We expect these decelerating trends to continue and soon bring overall core services inflation to 2.5%.
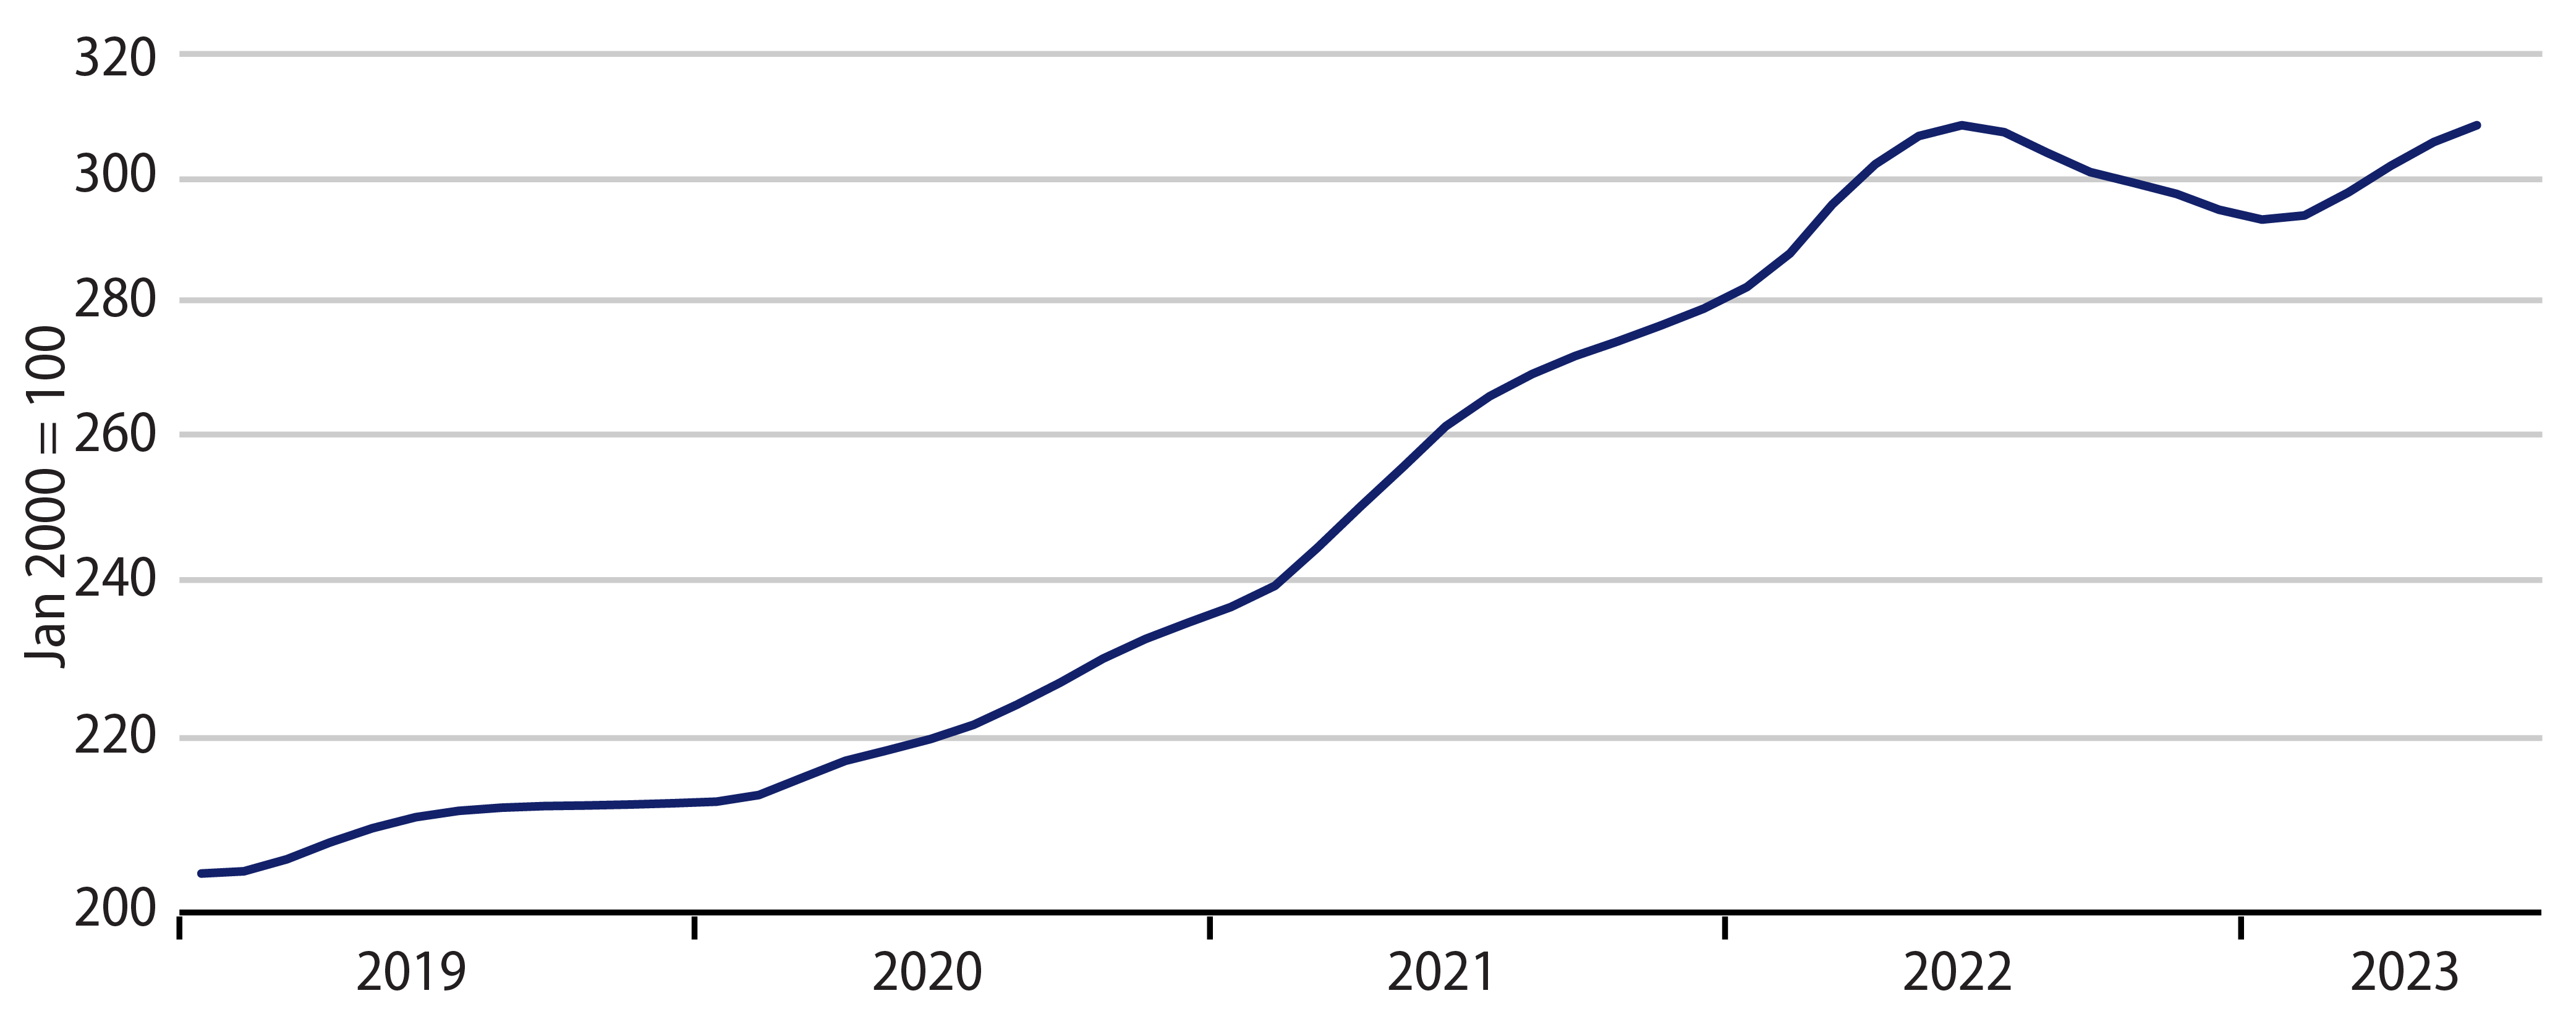
Fourth, we have talked much about shelter inflation. As seen in 10A, this component, while decelerating, is still registering current inflation rates around 6%. Much has been made of the US housing market stabilizing and bouncing a bit this year. Despite this, home prices remain unchanged relative to the levels of mid-2022 (Exhibit 5). There is good reason to expect that this will soon be reflected in reported CPI and PCE shelter prices.
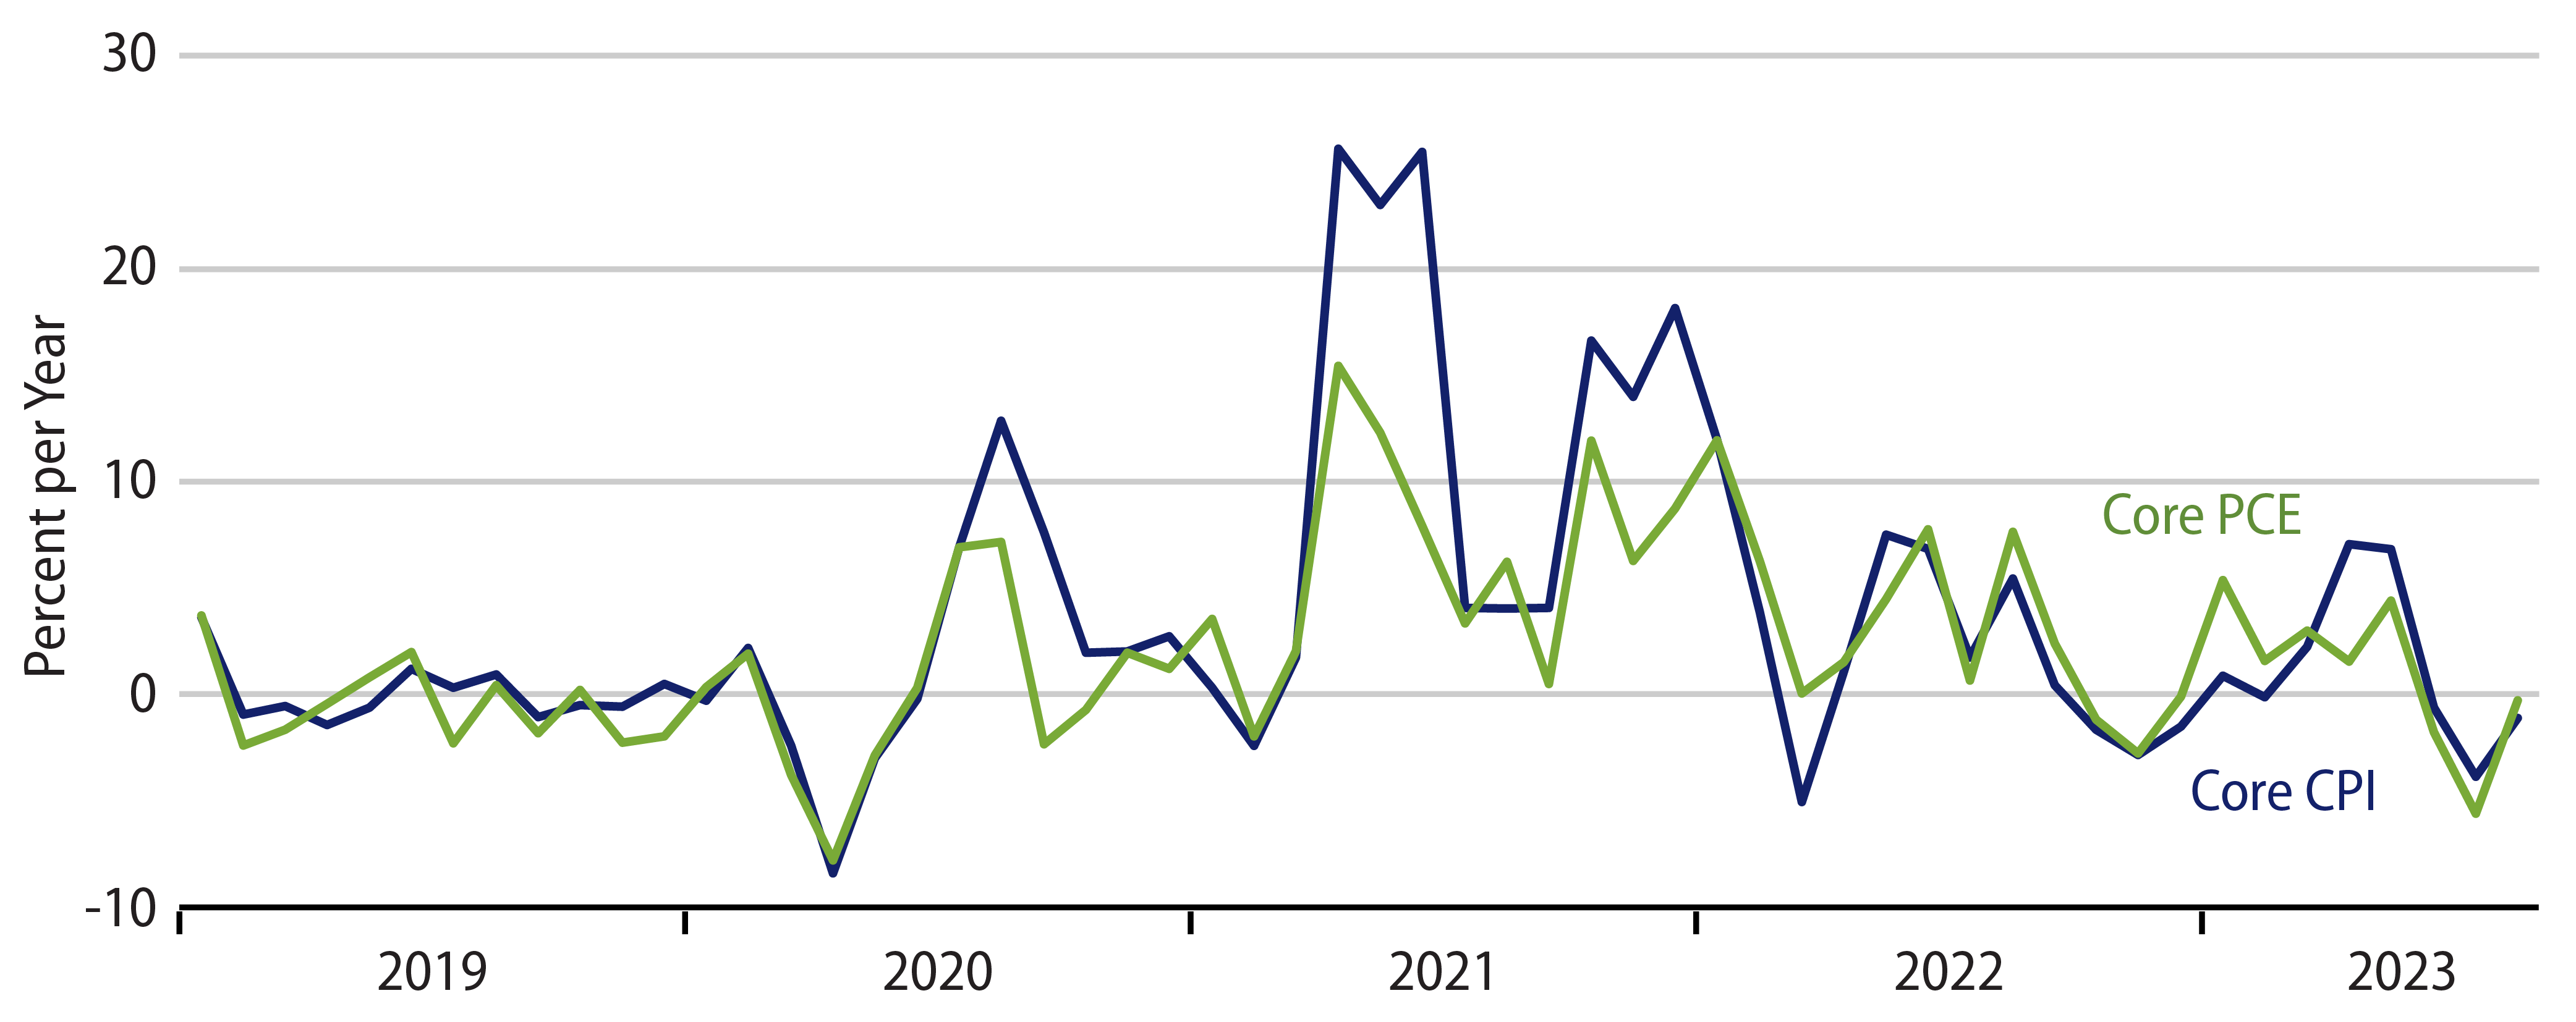
Finally, we haven’t even detailed goods inflation. As seen in Exhibit 6, following a severe run-up in late-2021 and early-2022, goods inflation has come all the way back down to where it has posted rates of decline—for both the PCE and CPI—at or even below the prevailing seen rates prior to Covid. We’ll discuss this further in the next section.
Rising Supply a Big Factor Behind Recent Disinflation
Again, inflation has declined sharply in the last year without the “help” of an economy in recession. We think that is a clear indication of how important supply-side issues have been underneath the inflation slowing. By the same token, the fact that inflation ran up so sharply in 2021-2022 without the coincidence of an economy boom underlines the importance of supply-side factors in that run-up. Rising supply buoys output even as it eases inflation, and the converse is also true. Supply chains and supply infrastructure were literally shut down during the pandemic, and their slow subsequent revival clearly worked to raise prices. Similarly, now-revived supply chains can be seen to be a major factor behind the recent disinflation.
While most industries are reasonably fully recovered from the shutdown, several Covid “epicenter” service sectors remain substantially understaffed relative to pre-Covid trends. Notable among these sectors are health care, restaurants, recreation, lodging and passenger travel. We believe there is further supply-side improvement coming in these and other sectors, and that further improvement there will provide further impetus to decelerating inflation.
Why Inflation Will Stay Low
Of course, supply factors are not the whole story behind falling inflation. Fed policy has performed a complete turnaround, with 2022 seeing the sharpest increase in interest rates in 60 years, with the money stock showing its first annual decline in history in 2022, and with the yield curve showing its sharpest inversion since 1981 (when yields were in high-teens territory). Similarly, the torrent of aid dispensed by the government to offset the Covid shutdown has dried up.
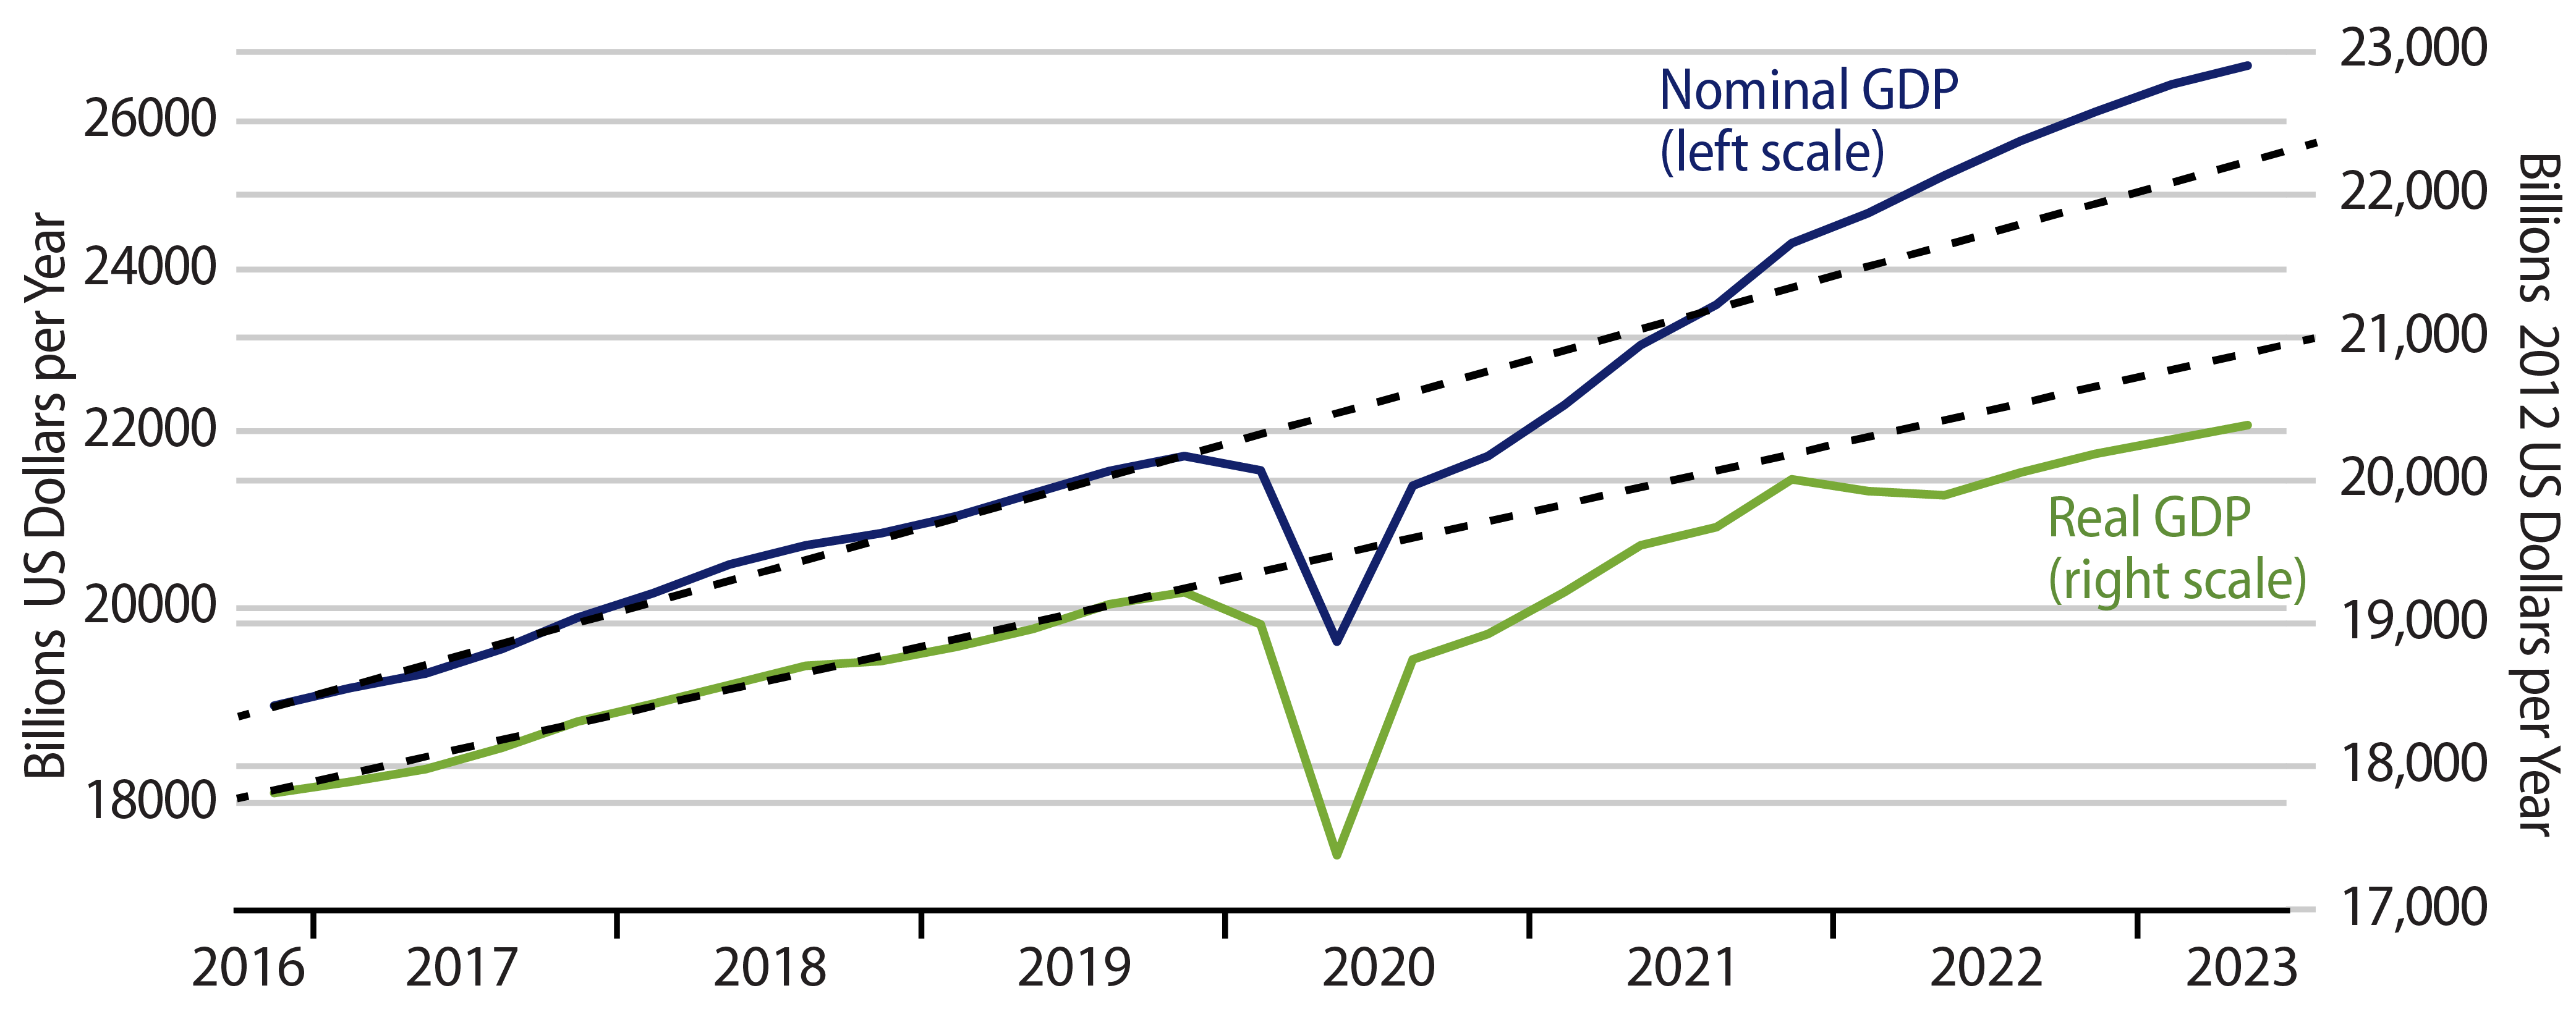
We look at growth in nominal GDP (spending) as the most reliable measure of aggregate demand and of policies’ effects on demand. Growth in both nominal GDP and nominal consumer spending has been decelerating at least since early-2021. Recent growth rates in nominal GDP are right in line with what we saw prior to the Covid shutdown (when inflation was last stable and low).
Granted, the deceleration in nominal spending began well before monetary and fiscal policy tightened, and one could attribute much of it merely to the easing of “rebound” pressures as the economy recovered from its suppression. However, it is hard not to credit at least some of the recent slowing to the effects of monetary and fiscal policy.
Ultimately, inflation cannot resurge without a re-acceleration in nominal GDP. If nominal GDP growth is stable, then inflation can rise only at the expense of faltering real output, in which case, the weakness in real GDP works to dissipate inflation pressures. Notice that the further deceleration in nominal GDP has occurred over the last year despite claims of the economy behaving better recently (after real GDP was reported as declining in the first half of 2022).
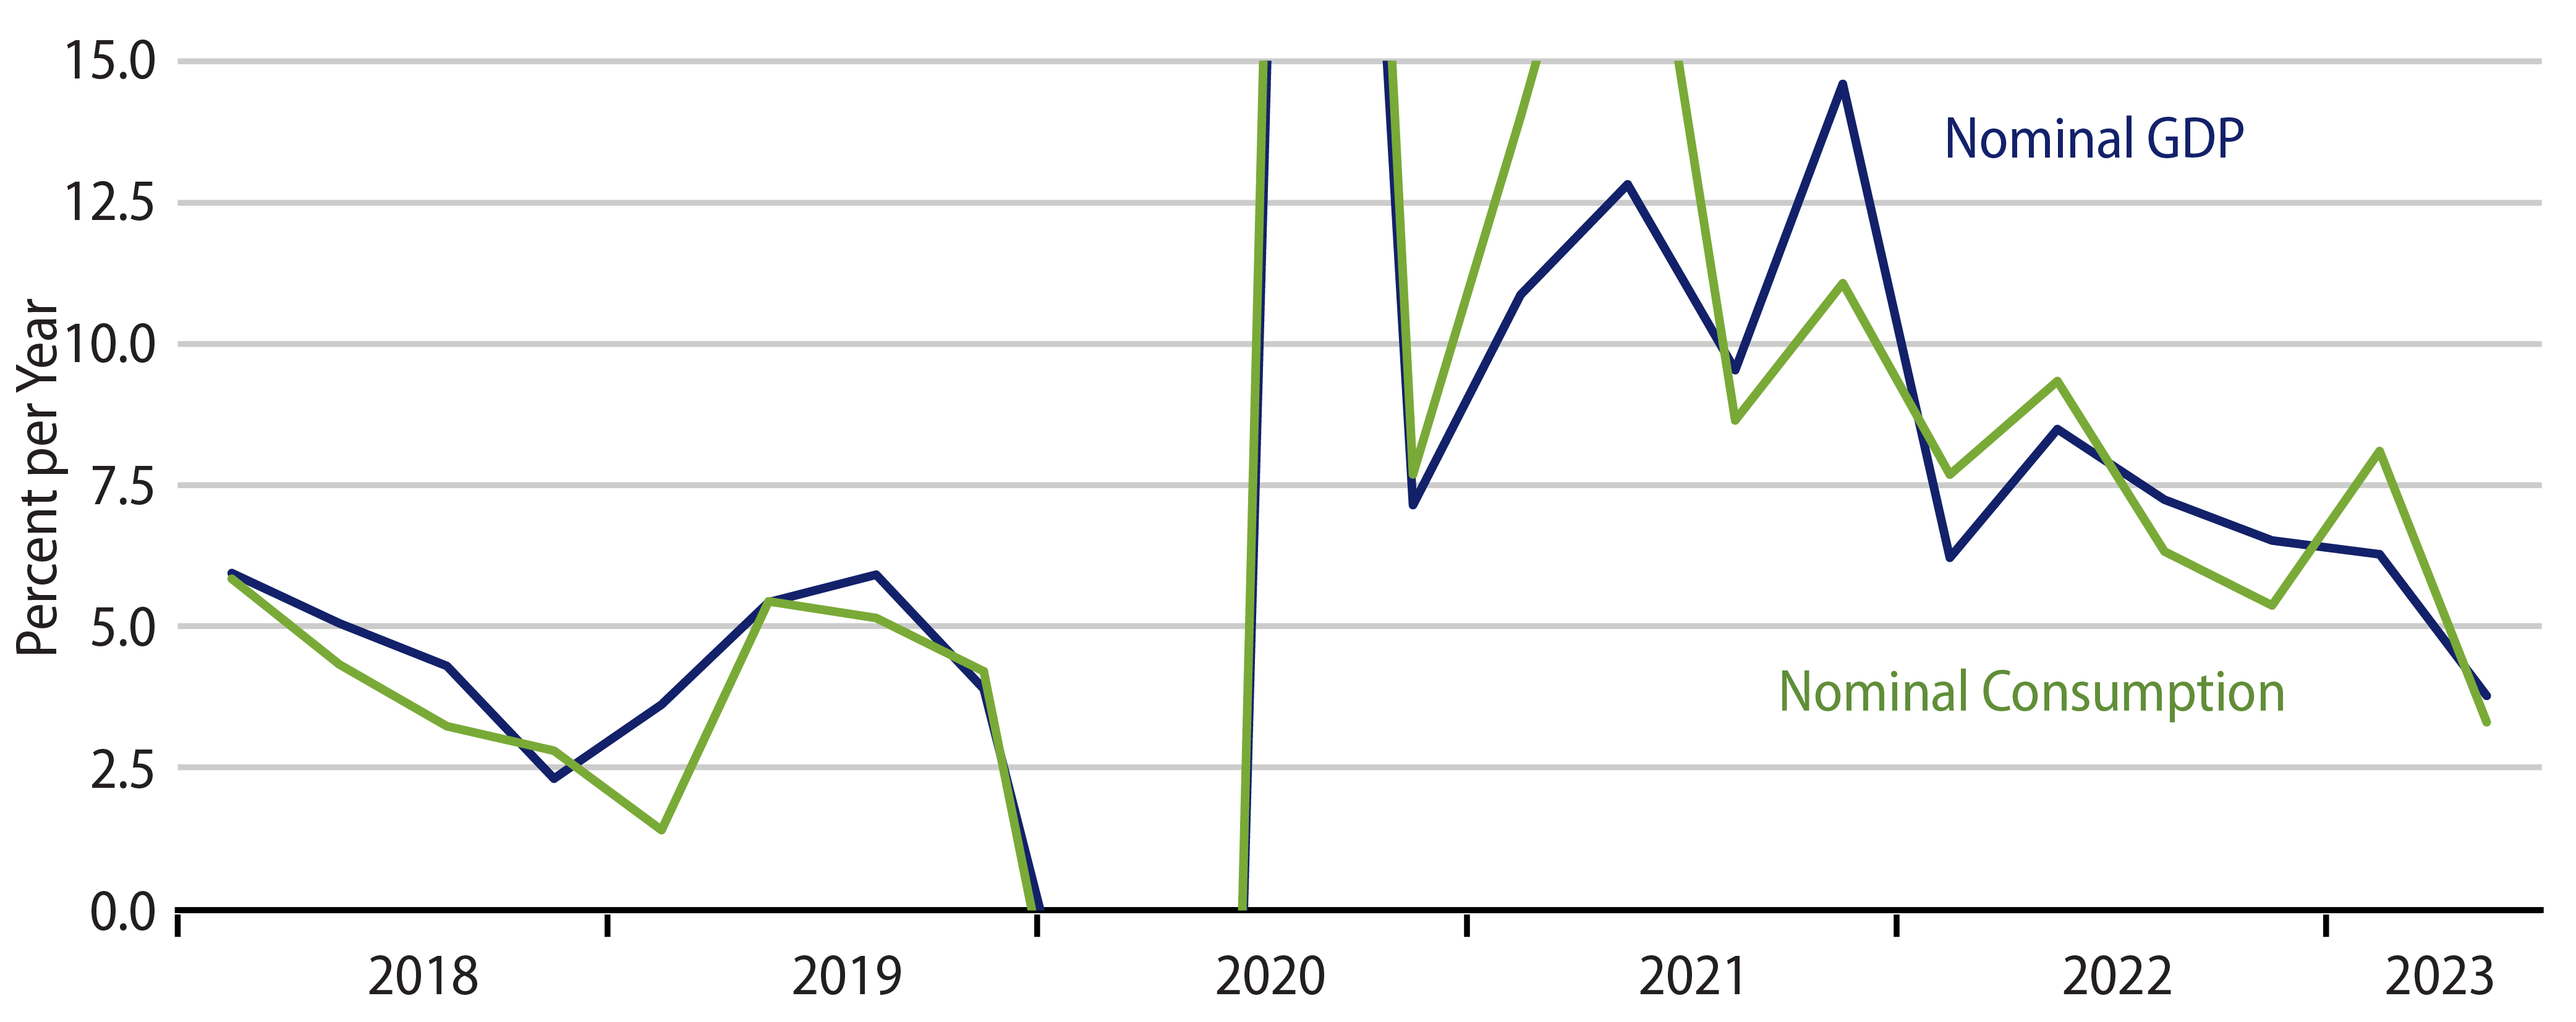
There is nothing in Exhibit 7 to suggest that the decelerating trend in nominal GDP growth is spent. On the contrary, there is reason to expect that the Fed’s hikes of the last 12 months will work to restrain nominal GDP growth further
Meanwhile, some have cited the increase in the federal deficit as a potential source of upward pressure on inflation. We agree that the deficit is an affront to the desire for sound governance. It may also be an issue for financial markets. However, we do not see the deficit as a source of stimulus to the economy nor a source of upward pressure on inflation. This is because the increase in the deficit over the last two years has primarily been driven by the Fed’s policy tightening. Not only are higher interest rates increasing the deficit by forcing higher federal direct outlays on interest, but also the higher interest rates paid by the Fed on bank reserves have erased Fed profits, thus erasing the payments by the Fed to the Treasury. Fed tightening has also scuttled stock and bond prices, slashing capital gains tax revenues.
By law, all operating profits earned by the Fed on its portfolio are remitted to the Treasury as “dividends.” As of early-2022, at the very beginning of the Fed’s hiking process, the Fed was paying “dividends” to the Treasury at an annualized rate of $137 billion per year. As of 2Q23, those dividends had essentially disappeared, amounting to only $0.152 billion. Over the same period, direct payments of interest by the Treasury rose from $603 billion to $970 billion. This $500 billion increase in net interest outlays accounts for the lion’s share of the $750 billion increase in the deficit over the last five quarters.
Over that same period, federal personal tax payments declined by $178 billion, despite a 9.5% increase in personal disposable income. That income increase should have driven an increase in personal taxes of at least $243 billion. The $421 billion in “missing” personal tax payments are likely due to the absence of capital gains tax collections, as Fed tightening has depressed stock and bond valuations. Add this to a $500 billion increase in net interest outlays by the Treasury, and $921 billion per year of lost Treasury financing can be attributed to the direct and indirect effects of Fed tightening1.
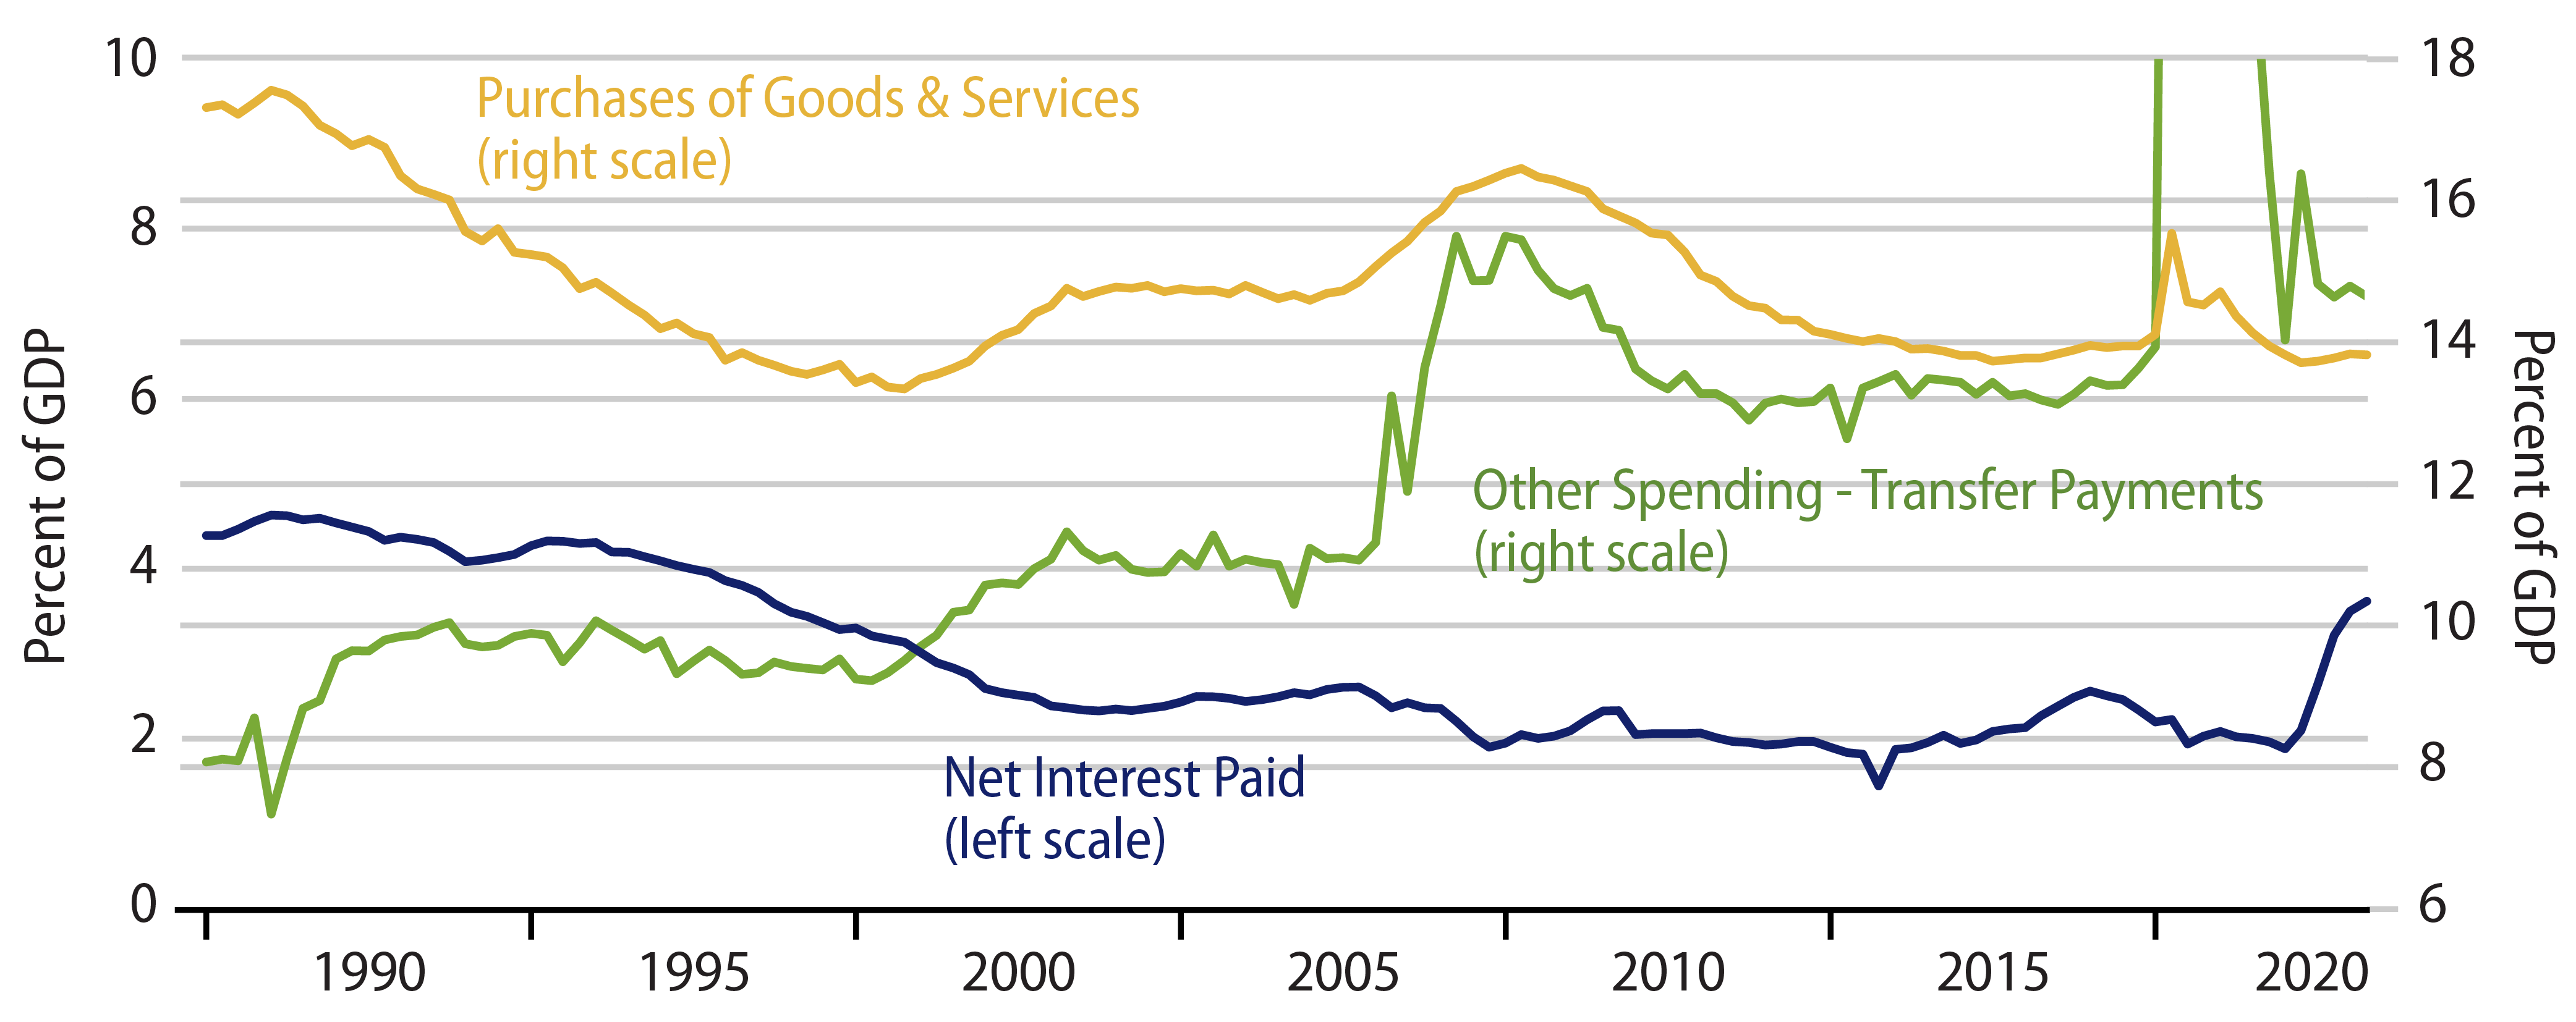
What about other government outlays? When you took Econ 101, you no doubt learned that “government spending” directly entered GDP: GDP = C+I+G. However, the “G” in this formula is NOT government “spending” per se, but actually government purchases of goods and services (including payrolls). As seen in Exhibit 8, such government purchases are essentially flat over the last year and down from pre-Covid levels as a share of GDP, opposite the aforementioned increase in net interest outlays. Remaining expenditures, transfer payments to individuals, companies and state/local/foreign governments, are also essentially unchanged relative to GDP and down from pandemic levels.
In sum, almost all the increase in the federal deficit since early-2022 can be attributed to Fed tightening. This doesn’t mean federal governance has been fiscally responsible. It doesn’t mean the deficit won’t be a problem elsewhere. However, it does contradict the contention that this increase in the deficit is either stimulating the economy or creating upward pressure on inflation. The deficit increase is a side effect of Fed tightening, and Fed tightening does not increase inflationary pressure. Yet, those pointing to the deficit as a reason for stubbornly high inflation are inferring otherwise.
What We Missed in 2021
Truth to tell, a similarly titled white paper we published in March 2021 argued that inflation would not surge in 2021 and 2022. Our arguments then were that neither the Fed nor the federal government had done anything differently in 2020 to counter Covid from what they had done in 2008-2010 to counter the global financial crisis (GFC). Those GFC-era policies failed to spark inflation then, even though they sparked much the same inflation fears. The anti-Covid policies were quantitatively larger but not qualitatively different from the anti-GFC policies, and we did not think they would be any more stimulative nor any more inflationary than the anti-GFC policies. Despite our contentions, inflation has reared its ugly head anyway, and there are indeed some indications of policy stimulating demand even though it failed to do so 15 years ago.
Exhibit 7 shows a surge in growth in nominal GDP (spending) over 2020-2022. We argued in the paper two years ago that most of this rebound in spending—and most of the price increases seen in 2020 and early-2021—was merely a reversal of declines seen during the shutdown. While that was true through mid-2021, the net increases in nominal GDP since then brought that measure well above pre-Covid trends.
Current levels of nominal GDP are about 5.5% higher than if pre-Covid growth trends had sustained. Real GDP is about 3.0% lower than pre-Covid trends would imply (Exhibit 9). It is hard not to conclude that the 5.5% extra growth in nominal GDP/spending was driven by the actions of the Fed and Treasury, and our 2021 analysis did not envision such an increase.
But that is not the whole story. As mentioned in the preceding section, the recent slowing in inflation opposite minimal economic pain cannot be understood without some consideration of supply-side factors, and those supply-side factors are an obvious factor to explain 2021-2022 inflation. We made no mention of this in the 2021 paper. There was no US historical precedent for domestic supply to be shut down the way it was in 2020, and we were slow to envision the related pricing pressures that would emerge in late-2021 and after, when the early, easy aspects of economic recovery were completed, and the economy faced the more daunting task of continuing to grow despite global supply chain disruptions and labor shortages. (Recall the massive queue of container ships docked outside US harbors in Fall of 2021.)
We will regret these miscues for a long time. However, the facts remain that: 1) those global and domestic supply issues have been successfully remedied, so that supply factors are exerting downward pressure on prices now, and 2) the stimulative measures of the Fed have been reversed, while those of the federal government have ceased2. And looking ahead, as detailed here, we think there is every reason to believe that inflation will trend yet lower. Meanwhile, there is also reason to believe that current inflation rates have already descended to rates that are consistent with the Fed’s targets, provided, of course, that recent inflation rates are sustained.
Conclusion
The fixation in the financial press and elsewhere with 12-month growth rates has led to an underappreciation of how much inflation has already declined. Monthly inflation rates are now at or near the Fed’s targets. So, to achieve Fed goals, we need merely to sustain recent inflation rates, not reduce them further. There are also technical factors holding up currently reported inflation rates, and these will be resolved favorably in the months to come. Finally, the world of constrained supply and stimulative policies that drove inflation around 2021 has transformed into one of bulging inventories, easing labor markets, restrictive monetary policy and an end to fiscal stimulus. We believe these will work to further lower inflation, presumably below Fed targets. The process has been painful, but the results are emerging.
APPENDIX
A Detailed Look at PCE Services Inflation
Exhibit 10 shows inflation in all 20 major components of consumer spending. These are shown in order of magnitude, largest to smallest, with each component’s share of services spending listed in its chart title.
The question we are trying to address with this array of charts are: 1) where is services inflation already at rates consistent with Fed’s target?, and 2) where is services inflation clearly decelerating? To address these questions, we drew a 2.5% level bar in each chart and, as much as possible, tried to use the same -5% to +20% scale in each chart, so one could more easily visually compare inflation rates across components. The charts with different vertical scales are shaded.
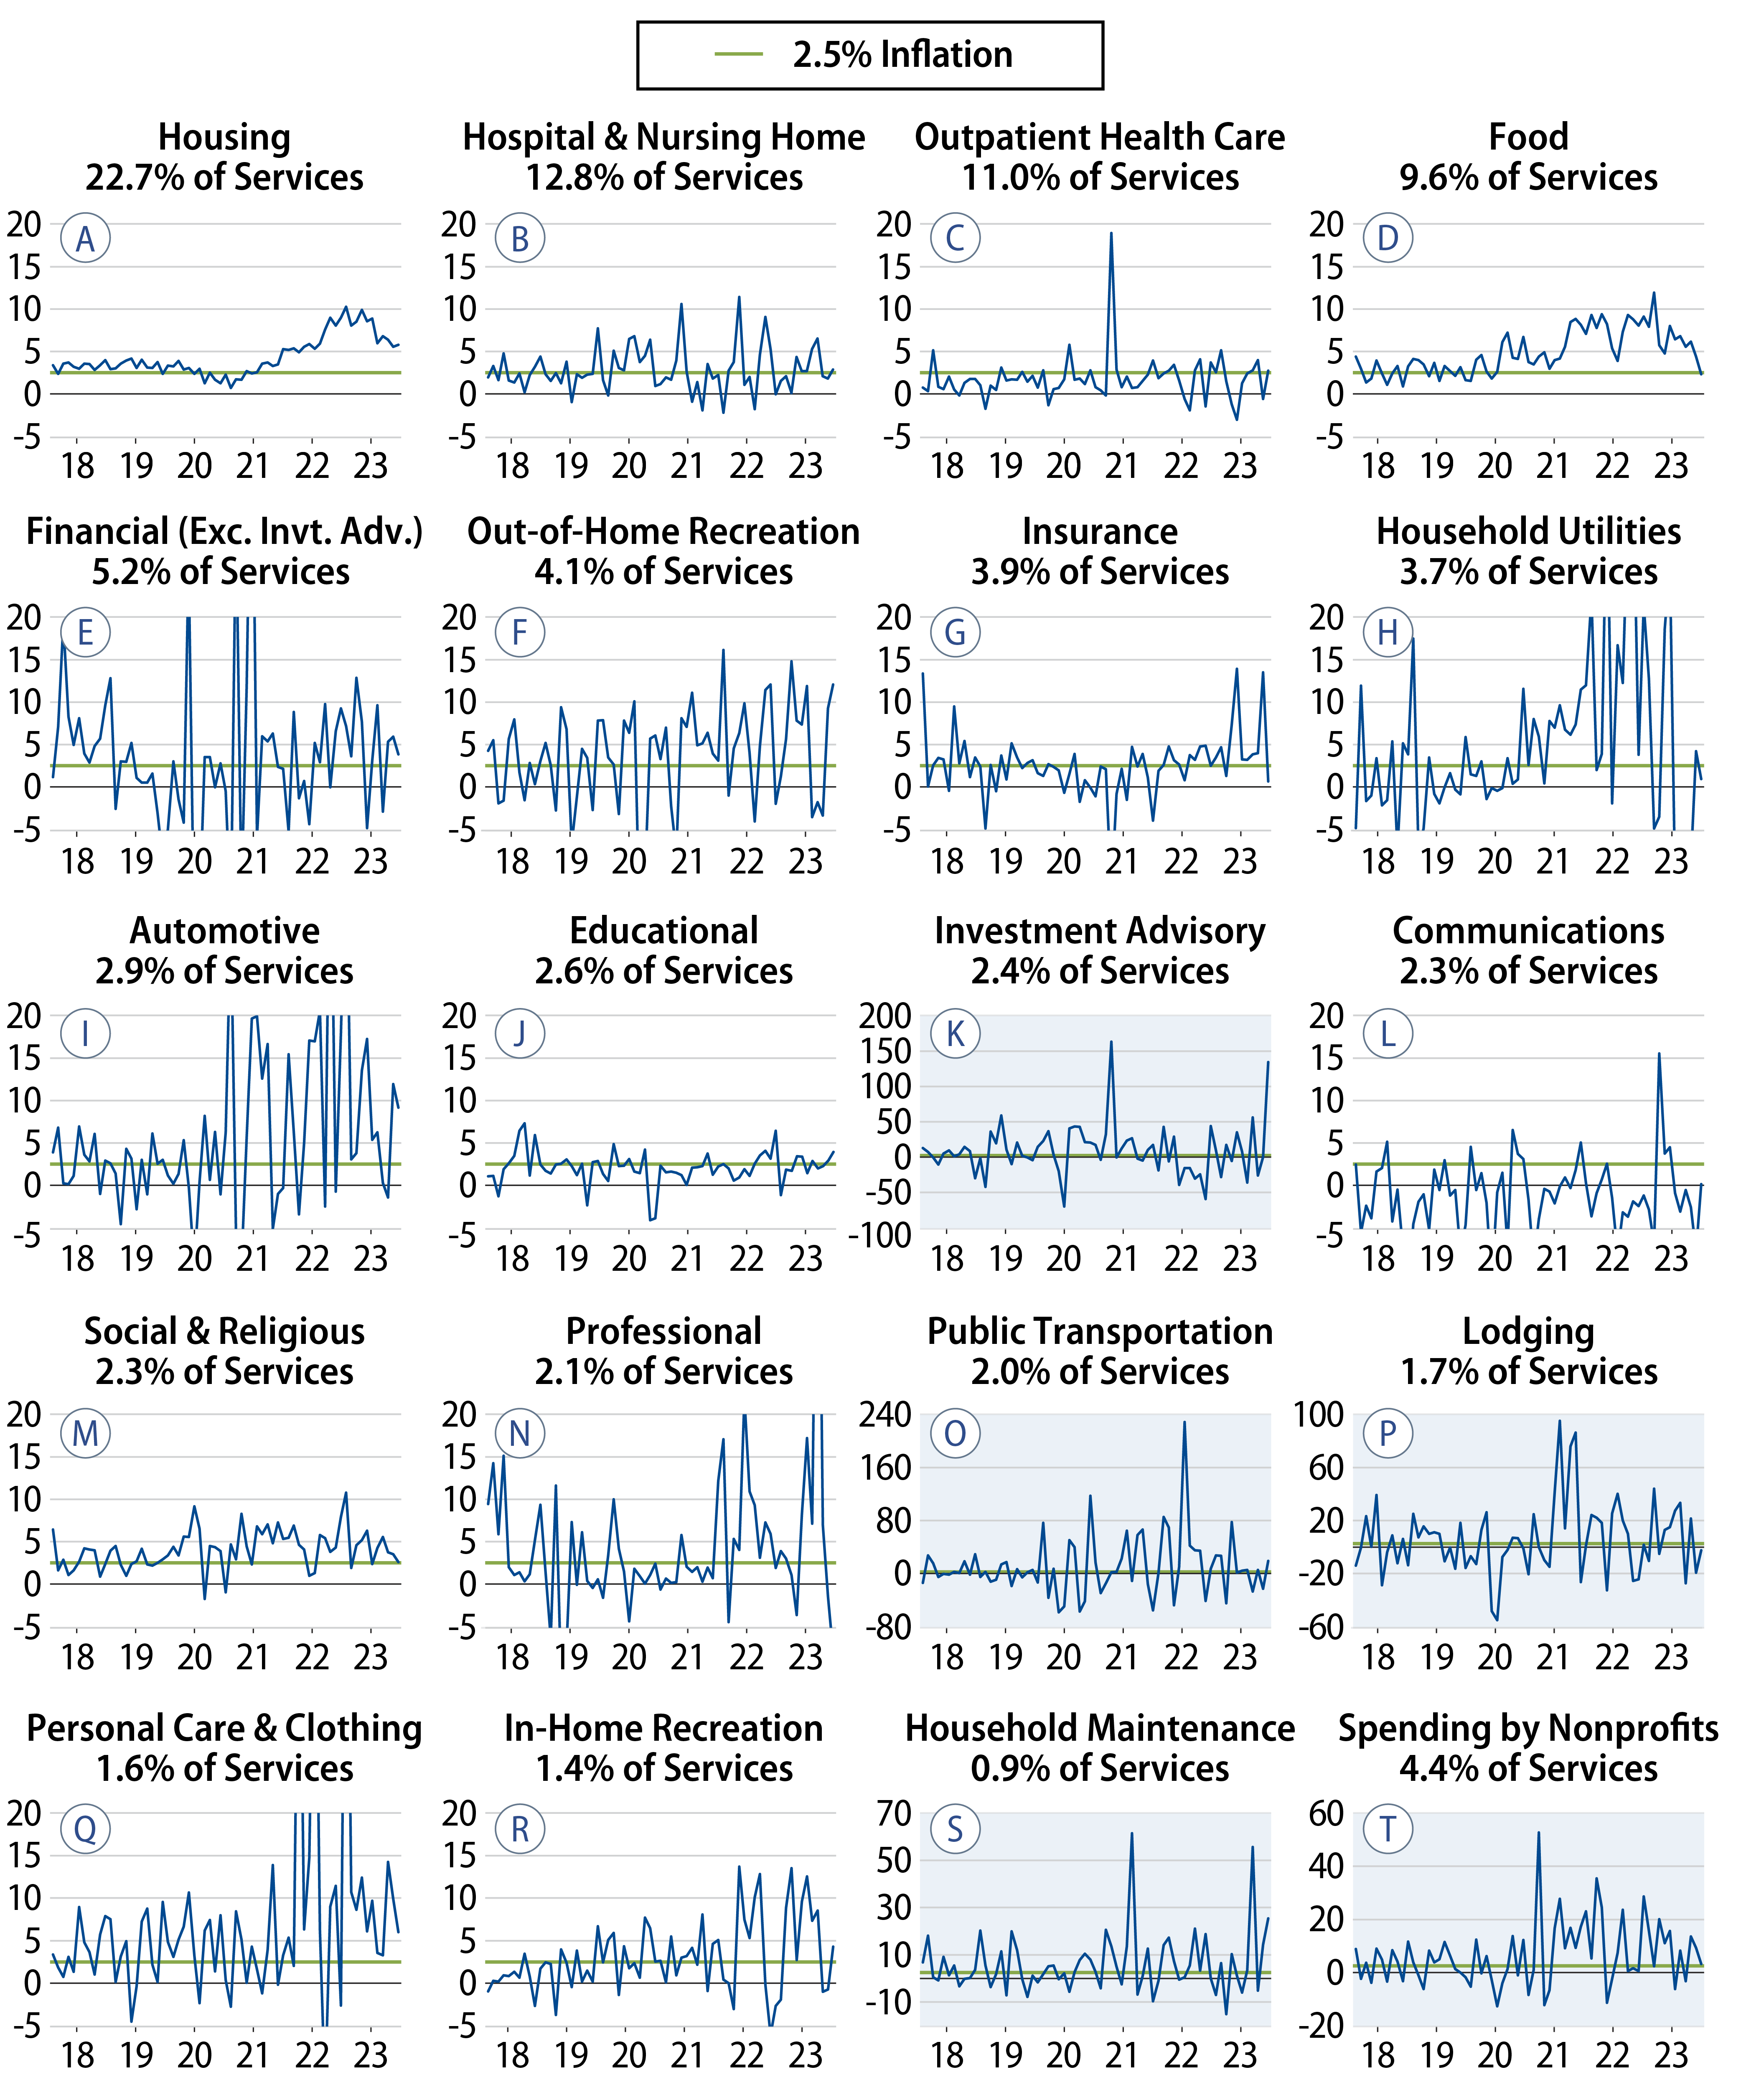
Among the five largest components, shelter and food services are clearly trending lower, with food services falling back to 2.5% in July. Various analysts are expecting reported shelter inflation to be between 0% and 3% by year-end, which would single-handedly reduce core PCE inflation by 0.6-1.2 percentage points. Inflation rates for the other three large services components have been oscillating around 2.5% for quite some time.
Among other sectors, the only ones not showing clear deceleration or already 2.5% average inflation are out-of-home recreation (5F), automotive services (5I), the aforementioned investment advisory services (5K), personal care/clothing services (5Q), and household maintenance (5S). Even these sectors show oscillation, with some months coming under 2.5% annualized. It is no stretch to think that inflation even in these sectors will subside, and it is worth noting that these sectors combined comprise just 11.4% of services spending and services inflation. Even if inflation in these sectors doesn’t subside in coming months, their effects would be swamped by any further deceleration in shelter prices, which is twice as large a sector as these five combined.
Finally, we described earlier the conceptual differences between the CPI and PCE. One other difference is the inclusion of spending by nonprofits within consumer spending in the GDP accounts and thus in the PCE inflation measure. It is shown not by magnitude as the last chart in the set (Exhibit 10T) because it is so incongruous with the rest of the sectors. Having said that, this sector also shows a pretty clear decelerating inflation trend, with recent monthly rates hovering around 2.5% annualized.
In summary, it was disconcerting to see the bounce in supercore PCE in July. However, we think it is clear from these charts that said bump was not indicative of a general rebound in service prices, but rather reflected a one-time bounce in reported investment management fees that is unlikely to be repeated or even sustained in months to come.
- These federal budget statistics are taken from the federal government finances data within BEA’s National Income and Product Accounts, Table 3.2. These data are tabulated by BEA on a quarterly basis and are seasonally adjusted and annualized.
- We could also throw in the fact that even the observed 5.5% extra growth in nominal GDP is far smaller than the 26% bulge in the money stock over 2020-2021, not to mention trillions in Covid aid. So, policy’s “bite” was a lot milder than its “bark,” but there was some bite, and we failed to see that coming.