KEY TAKEAWAYS
- We maintain our long-standing view that the underpinnings of the current credit cycle are more nuanced than those of prior cycles.
- Today’s cycle is benefiting from a slow recovery in risk-taking behavior and an unprecedented level of central bank activism.
- Portfolio positioning largely rests on one’s view of where we are in the global credit cycle, assessments of “fair value” for each credit sector and portfolio risk tolerance.
- Contrary to conventional wisdom, we believe portfolios should maintain a healthy allocation to corporate credit at this stage of the cycle.
- Barring a full-blown trade war or tail-risk event, the combined weight of resilient global growth, low rates and stable credit fundamentals suggests credit market performance could improve beyond current market expectations.
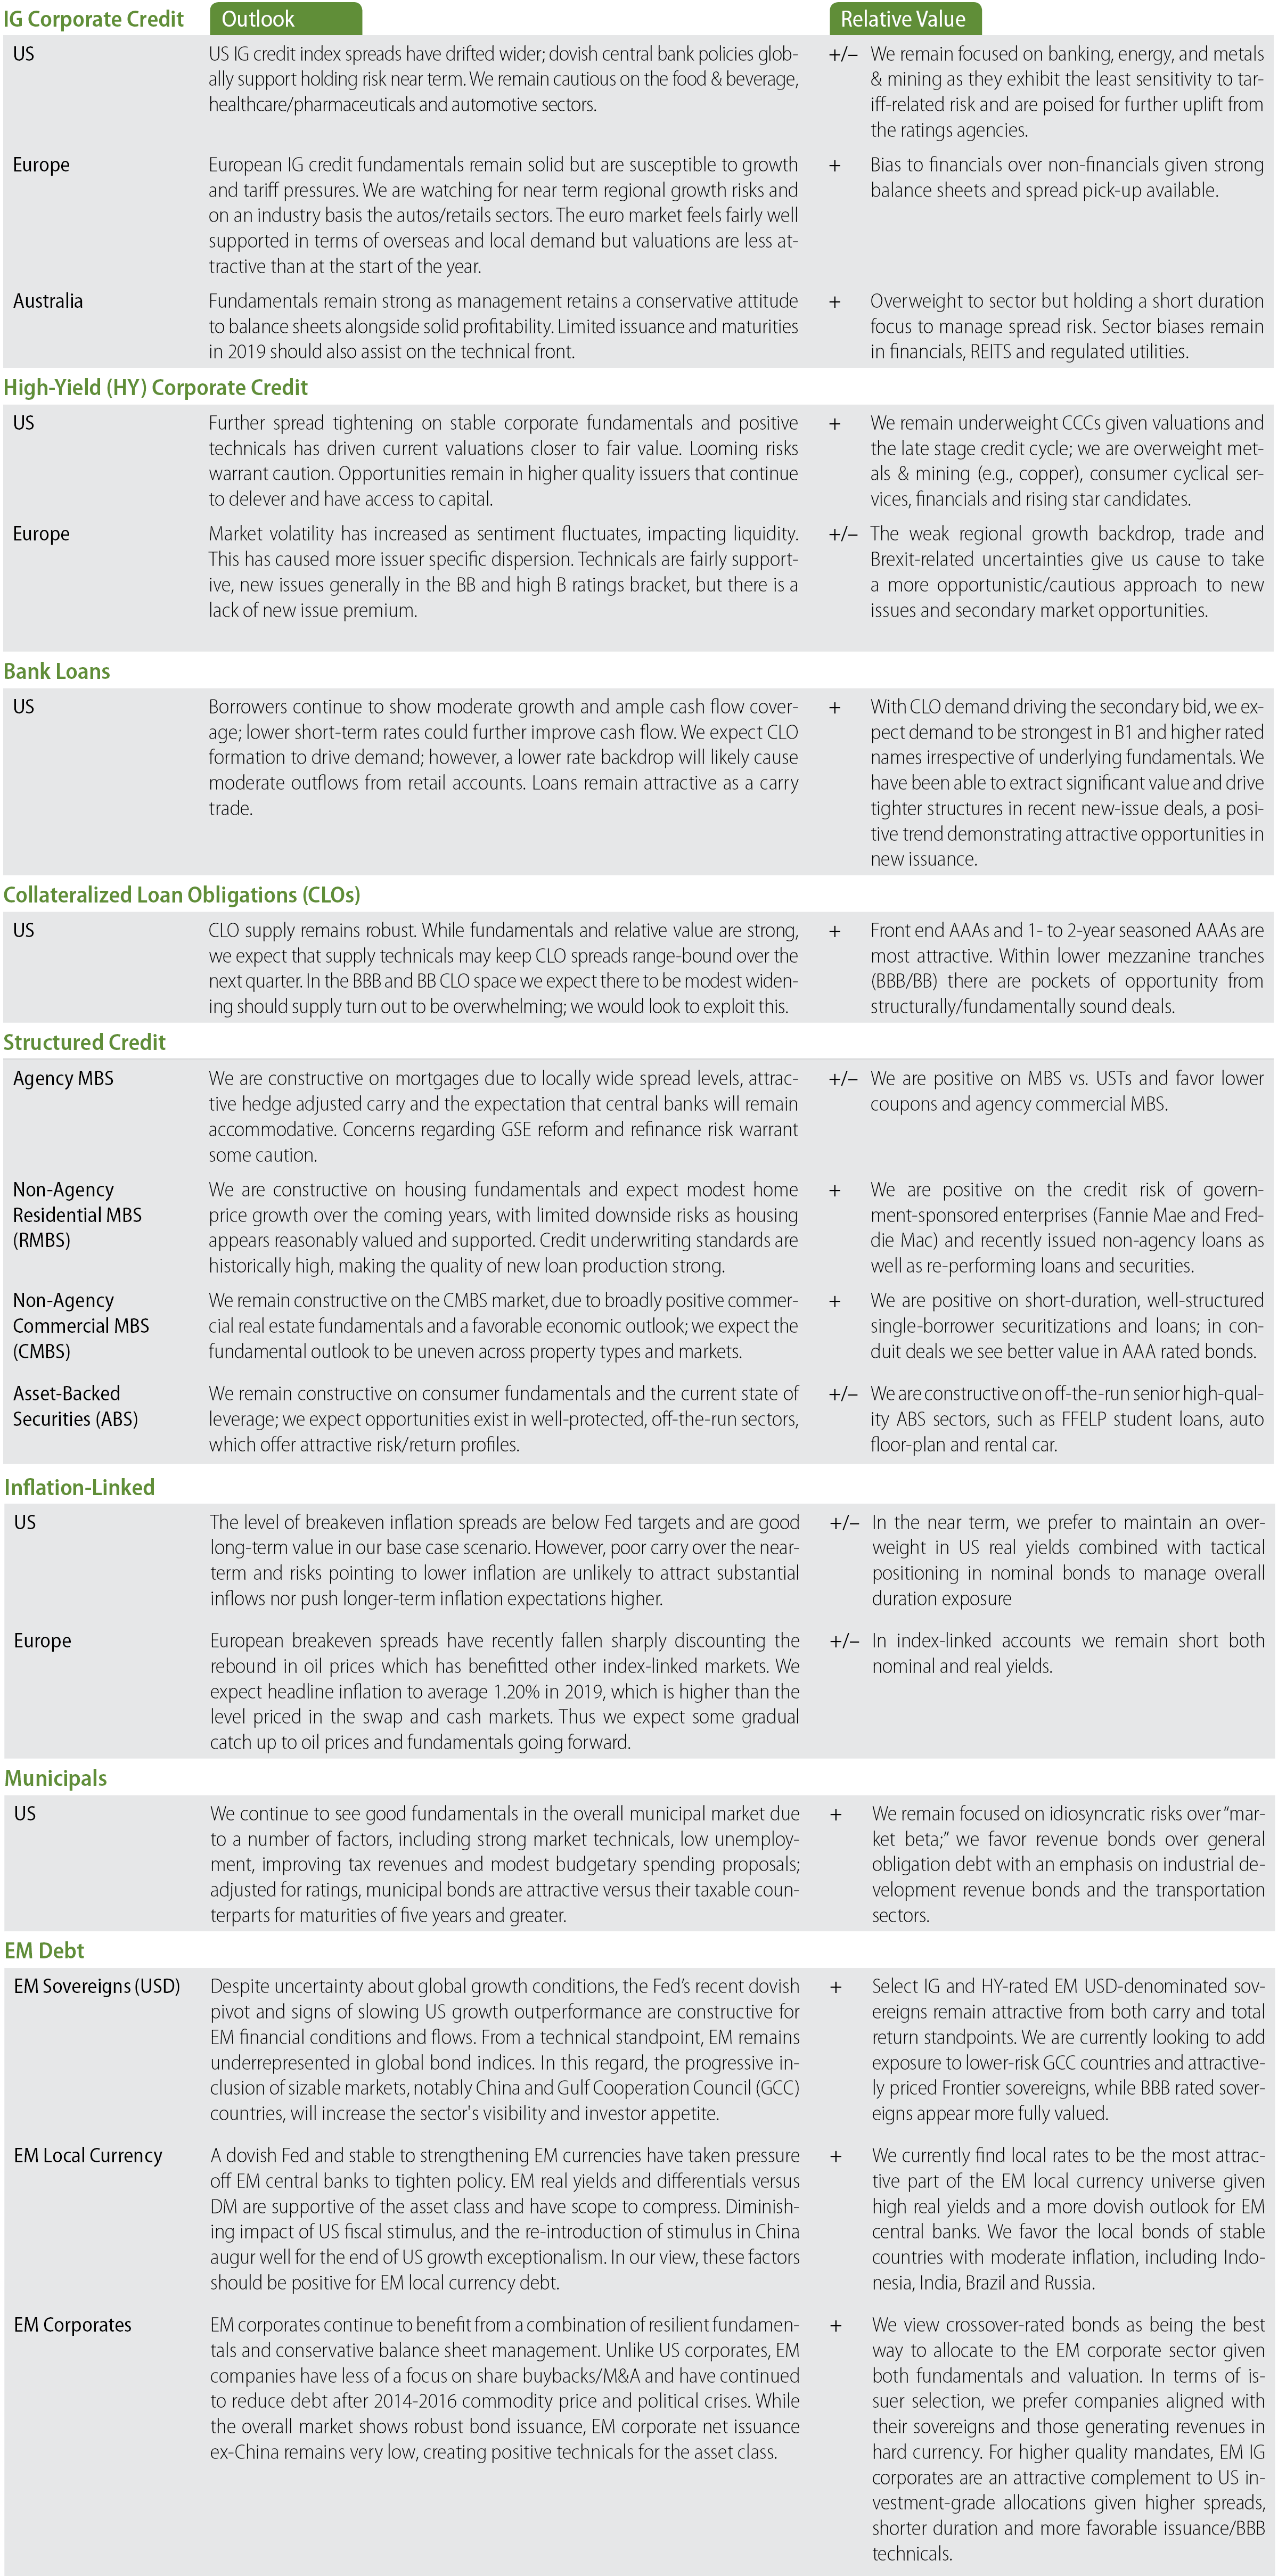
- Note that a copy of our Relative Value By Sector analysis, as published in our recent Third Quarter Global Outlook, is included at the end of this paper.
Investors continue to debate where we are in the global credit cycle and wonder if the party is about to end. After all, credit spreads have ground tighter over the past few years even as corporate sector leverage has crept higher and as global growth has softened on the back of trade-related uncertainty. This is a potentially worrisome mix, many would argue. We recognize that there are a number of signs in credit markets that warrant caution. Still, we maintain our long-standing view that the underpinnings of this cycle are more nuanced than those of prior cycles, and that credit market performance could improve beyond current market expectations. This paper delves a bit deeper into our views, market concerns and implications for portfolio positioning.
Drivers of the Latest Credit Cycle
Credit cycles are typically characterized as having four distinct phases: early (recovery), mid (expansion), late (downturn) and recession (repair). In fact, sometimes the credit cycle is depicted as a “clock” with sectors moving across all four quadrants simultaneously or with each phase having the same duration. While this framework helps simplify a complex subject, reality is much messier. The length and strength of any credit cycle is driven by a variety of factors, both top-down and bottom-up. For example, differences in various countries’ economic cycles, fiscal policies and central bank policies lead to very different cycle phases across global credit markets and their subsectors.
In the aftermath of the 2008 global financial crisis, three themes helped shape our view that the ensuing credit cycle would likely exceed the duration of all previous cycles:
- The global financial crisis (GFC) disproportionately impacted developed markets. The crisis had severely dented global wealth and critically damaged market psychology, specifically risk-taking behavior, among individuals, corporations and governments. We expected certain areas of the global economy to rebound sharply, most notably emerging markets (EM), which were not a focal point of the crisis. However, we felt it would take much longer for the developed world to recover.
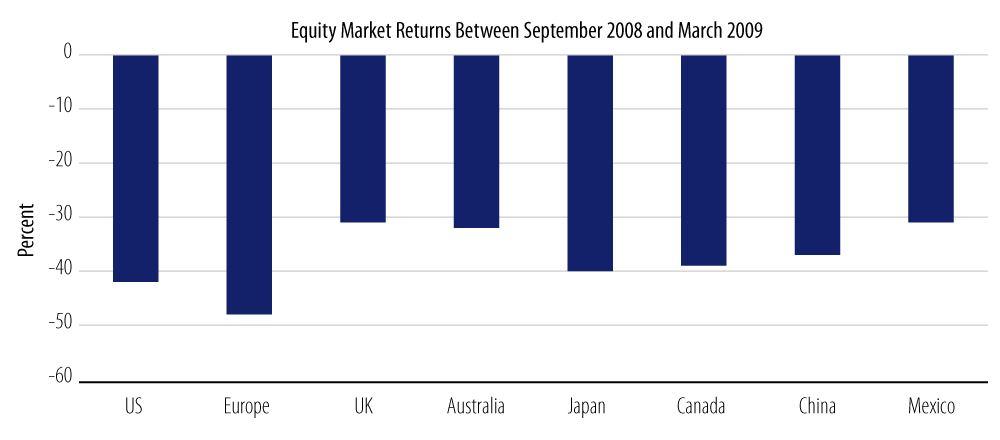
- Central banks initiated extraordinary measures. During the depth of the crisis, the major central banks united in an unprecedented way to enact extraordinary policy measures. This "whatever it takes" posture signaled that central banks understood the urgency of preserving the integrity of the financial system and repairing market sentiment.
- Financial regulators made beneficial changes. Across different countries, financial regulators were advocating significant legislative and regulatory changes with the aim of capping leverage (especially for financials), repairing balance sheets and improving liquidity. These new regulations would have the effect of adding ballast to the ensuing economic expansion and function as a strong tailwind for risk assets.
The Role of “Mini-Cycles”
As we alluded to earlier, not all credit markets or their respective subsectors are the same, and it follows that a crisis in one market may not necessarily be a harbinger of a broader crisis. Markets that are mature, deep and well trafficked by all investor types globally enjoy extra resilience when hiccups occur. Consider the US corporate credit versus European or EM credit markets, which are still broadening and deepening.
As an example, investors grew quite concerned a few years ago with the entire US high-yield (HY) market. In 2014, the success of technological innovation (i.e., fracking) greatly enhanced the ability of exploration and production companies in the US to extract a greater amount of crude oil; this upset the supply/demand dynamic throughout the global energy sector and contributed to a severe downturn a year later. On top of that, the retail sector in 2015 experienced turbulence as investors realized the scale of the disruptive impact that online retailers were having on the business model of brick-and-mortar retailers.
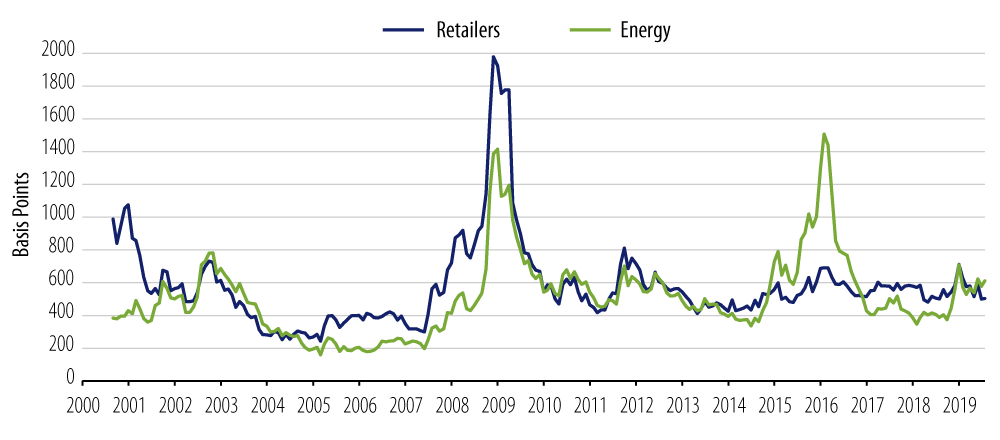
These specific sector dislocations engendered many alarmist headlines, not just about the state of the US HY market, but also about the potential end of the credit cycle. Ultimately, none of these episodes had a lasting impact; if anything, these “mini-cycles” reduced market excesses, restored corporate discipline and boosted investor confidence, all of which added more fuel to the broader credit cycle.
Areas of Concern
All that stated, our research analysts have seen some signs of late-stage cycle behavior. These include weaker covenant packages in underlying securities that expose investors to increased risk, questionable use of lines of credit (revolvers) and a growing preoccupation with shareholder returns. Most equity-sponsored deals, for example, allow generous use of the restricted payment basket and an increase in allowable “add-backs” to arrive at adjusted EBITDA.
Other areas of concern include increasing debt-financed M&A activity and leverage creep, which are closely tied to the rapid growth of the BBB rated segment of the credit market. We acknowledge the risk that an unforeseen catalyst could precipitate a wave of downgrades (fallen angels), which would ultimately overwhelm the HY market. However, when looking more closely at the drivers, we see no reason for panic. The growth of BBBs as a proportion of the investment-grade (IG) market over the past decade—from 32% to 46%—has largely been observed within three subsectors: banking, healthcare & pharmaceuticals and autos, all of which have very different trajectories.¹
For instance, the US banking industry was downgraded en masse in the aftermath of the financial crisis but record earnings, higher capital ratios and improving asset quality over the past decade have this sector on an improving ratings trend. While European banks are behind their US counterparts in terms of balance sheet repair, they are also heading in the right direction and in a much stronger position than they were pre-crisis.
The healthcare & pharmaceuticals industry, on the other hand, has gone through a secular fundamental decline. What used to be an AA/A industry has settled in at A/BBB as a result of deteriorating margins, weak product pipelines and generic competition. To combat these forces, industry consolidation was necessary, but management teams have generally been committed to IG ratings. A somewhat reassuring factor is that the industry is non-cyclical; therefore, it is less vulnerable to a dramatic revenue downturn in recessionary environments.
Meanwhile, original equipment manufacturers in the auto industry have been on a ratings roller coaster over the past couple of decades, but the most recent turn has been upward. This area of the market has drawn increased concern as companies have been subject to forces beyond their control (e.g., peak sales, China slowdown and tariffs). However, we credit management teams with addressing legacy issues (debt load, underfunded pensions and labor contracts) and understand they have no intention of giving up their hard-fought IG ratings.
Regarding BBB issuer risk more broadly, it’s important to bear in mind that corporate managements have been wrestling with the trade-off between meeting the “higher standards” required for a single A rating, improving their weighted-average cost of capital, especially in the current low-rate environment, and maintaining flexibility in order to execute the corporate strategy. As a result, some have settled into the mindset that the optimal capital structure should include more leverage.
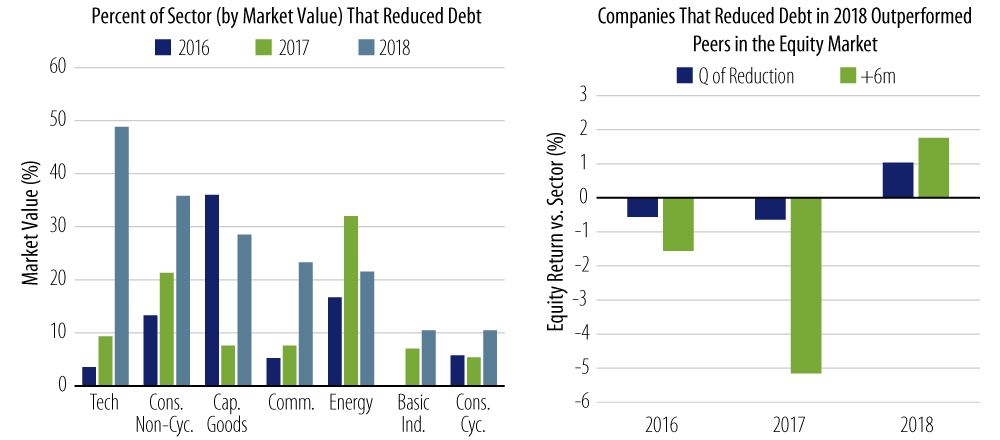
That stated, some of the largest issuers (of the IG credit index) have been actively reducing leverage. In Exhibit 3, the chart on the left shows the deleveraging trend gaining momentum in key sectors such as technology, consumer non-cyclicals and communications. The chart on the right shows the equity performance of companies that reduced debt relative to their sector peers during the quarter they deleveraged and six months later (when this activity was disclosed to the public). In the 2016-2017 period, equity investors penalized corporations that paid down debt. This shifted in 2018 with equity investors rewarding those companies that made tangible progress with deleveraging.
Thoughts About Credit Sector Positioning
Given the heightened level of uncertainty in today’s market, investors are right to question what type of credit exposure is currently appropriate in their portfolios. The answer largely rests on one’s view of where we are in the global credit cycle, assessments of “fair value” for each credit sector and portfolio risk tolerance.
Exhibit 4 provides our summary view of what high-level asset allocations might generally look like during each phase of the cycle, taking into consideration differing portfolio styles (e.g., benchmarked, unconstrained and multi-asset credit). Green represents having a constructive view (more aggressive exposure), yellow represents exercising some degree of caution (more conservative exposure) and red represents having a less constructive view (minimal or zero exposure).

Note that these asset allocations relate more to macro conditions and timing. From a bottom-up valuation perspective, we would argue that the best time to own higher beta credit such as HY and EM is during the depths of a down cycle (i.e., the recession period) when valuations become extreme. For example, in late 2008, credit fundamentals were under duress and defaults spiked a year later, but that was the time to put money to work. This speaks, once again, to the need for active management in fixed-income to identify and exploit value opportunities as they present themselves.
In the recovery phase of a cycle, it makes sense to have diversified exposure across corporate and structured credit in a broad market portfolio (e.g., a Core Plus type mandate). These sectors typically perform strongly in an environment of loose monetary conditions and earnings expansion. In an environment of improving global macro prospects and healthier market sentiment (what we observed in the years following the 2008 crisis), EM debt also offers attractive total return potential.
Conversely, as external macro and/or domestic conditions begin to deteriorate for a particular credit market (or subsector), it would be prudent—especially for investors in benchmarked portfolios—to exercise caution. This entails recalibrating credit risk exposure by either moving up in credit quality (i.e., going underweight lower-rated issuers and overweight higher-rated issuers) or shifting proceeds to more defensive sectors (e.g., global government bonds) to mitigate potential spikes in tracking error volatility. Note that portfolios that are unconstrained or not managed versus a benchmark, such as multi-asset credit strategies, have much greater investment and risk management latitude than their benchmarked counterparts. A manager is not tethered to an index and can tactically rotate from one sector to another to find value in down cycles.
At present, there is a growing market consensus that we are in the late stage of the credit cycle. Conventional wisdom says that, in such an environment, a broad market portfolio should have a minimal amount of exposure to higher beta sectors. We believe this assessment misses the mark due to unique top-down and bottom-up dynamics.
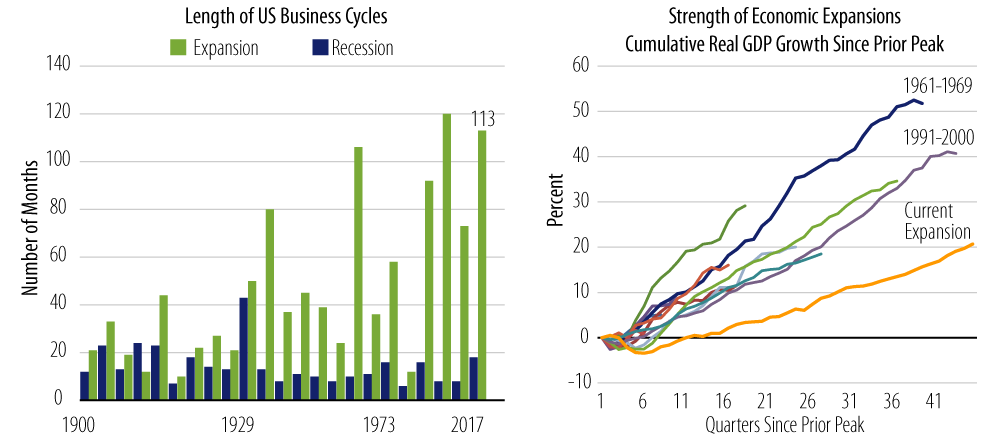
Consider the growing activism of central banks over the past decade. Unconventional monetary policy, which was used during the crisis to rescue economies from a downward spiral, has in fact become conventional policy with central bankers. This is true in both developed markets and EM as policymakers seek to sustain their recoveries. For example, the current US expansion has clearly lagged past expansions in terms of magnitude, despite extraordinary policy accommodation by the Federal Reserve (Fed). A similar dynamic is occurring in Europe, Japan and elsewhere. Weaker global growth expectations—exacerbated by protracted uncertainty around Brexit and US-China trade tensions—have had the effect of pushing both inflation expectations and global government bond yields lower as investors price in the probability of additional stimulus.
The net result is a period of low borrowing costs for the foreseeable future, which should allow issuers both in the US and abroad to continue to refinance and extend their obligations at cheaper levels and longer maturities. This, combined with stable credit fundamental indicators that do not suggest imminent decay, allays our concern of an IG credit-driven liquidity crisis or a scenario of widespread default risk in the HY market. Indeed, when looking at HY credit spreads through the lens of historical and expected default rates, we believe concerns around “tight” valuations may be overdone with more room to run.
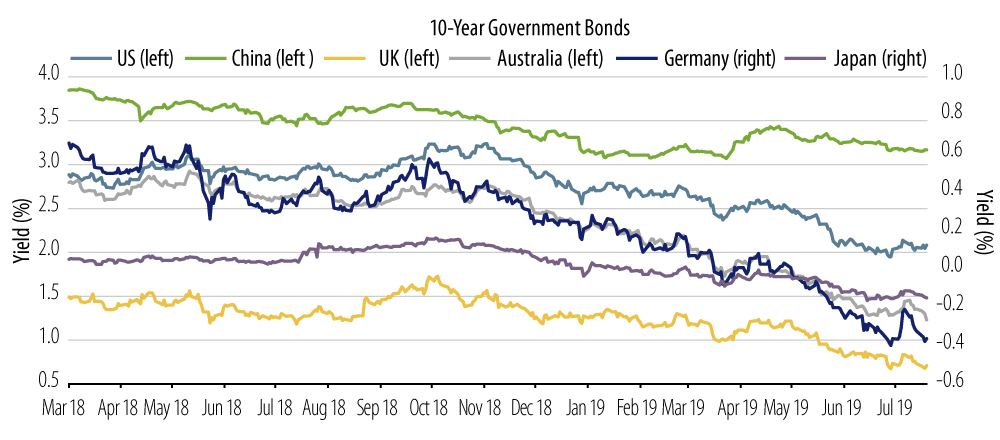
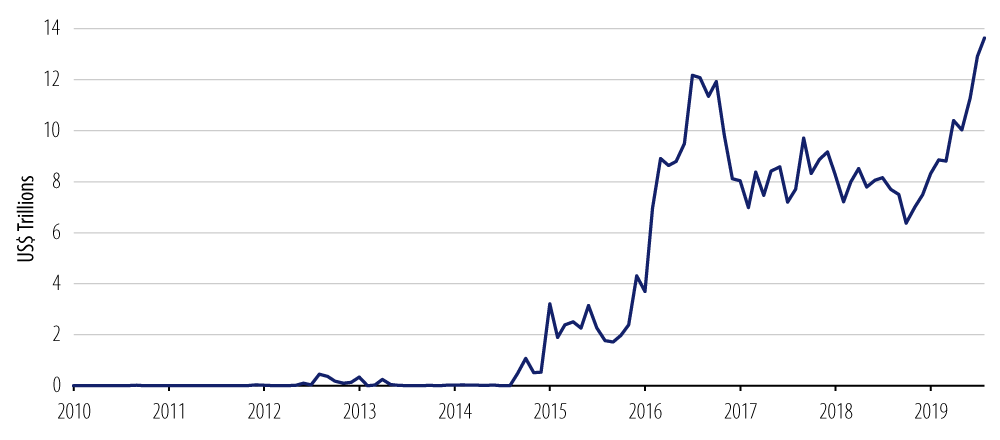
With this in mind, we believe investors should have a healthy allocation to both US and European IG and HY corporate credit. Spreads across these markets have widened as of late due to a number of market concerns, but the world of “yield starvation” is back in play. Indeed, the amount of negative-yielding debt globally now stands at a record high of $13+ trillion.² Interest rates of 2%+ in the US are high by comparison and yield spreads across credit markets are also the most generous. We believe these data points along with the Fed and the European Central Bank’s aggressive accommodative posture position corporate credit as a compelling “carry” trade for both benchmarked and unconstrained portfolios.

The subsectors we see as currently offering attractive relative value and, more importantly, that exhibit a lower sensitivity to tariffs are financials (with an emphasis on the strongest US and European banks across the capital structure), energy (mainly higher-rated, US oil-directed E&P as well as pipeline and midstream credits) and basic industries, specifically metals & mining (e.g., copper-related credits). Our emphasis is also on higher quality issuers such as “rising stars,” which are BB rated credits that have the potential to move up to IG over the next 12-18 months.
We also believe a tactical allocation to EM (with an eye on idiosyncratic risk across countries) can make sense as USD-denominated sovereign and corporate issuers continue to recover from the commodity price collapse and marked slowdown in Chinese economic activity during 2014-2016. Looking ahead, a more dovish Fed and signs of slowing US growth outperformance are constructive for EM financial conditions and flows. More importantly, these factors take the pressure off EM central banks to tighten policy, which bodes well for the fundamental outlook of the asset class.
Structured credit—both mortgage and consumer credit—should also be considered at this time given the investment team’s view that the sector is sitting between the early and middle phase of the credit cycle. Since the financial crisis, increased transparency and improved risk measures have resulted in better underwriting standards (e.g., mandatory income verification and more equity in the property) and improved loan quality, resulting in a higher quality asset class. From a macro standpoint, structured credit is well supported by the continuation of the deleveraging trend observed in consumer and household debt. From a relative value standpoint, structured credit offers attractive yield potential and, perhaps more importantly, diversification benefits given the low correlation that non-agency residential and commercial MBS have to corporate credit.
On the margin—and keeping in mind that markets may become more volatile in the coming months—we favor an allocation to bank loans. Despite concerns over the state of the leveraged loan market, we continue to see attractive underlying fundamentals and expect moderate growth in the coming quarters for corporates. We also favor an allocation to CLOs with an emphasis on the highest quality (AAA rated) tranches given their history of resilience during periods of severe market dislocation and compelling carry profile relative to other credit markets, such as similarly rated IG corporate credit and CMBS.
Last, but not least—and given prevailing market concerns over trade tensions and Brexit—we feel it is prudent to hold an allocation to US Treasuries as they remain the best diversifying hedge against broader market risks.
Looking Ahead
There have been three credit cycle downturns in the past 30 years, and each was associated with either a sharp tightening in global financial conditions (precipitated by the bursting of a market bubble) or a protracted economic downturn during which time corporate default rates rose sharply. We do not see any near-term catalysts that could trigger such scenarios. Barring a full-blown trade war or a tail-risk event, we remain optimistic that the combined weight of resilient global growth, low inflation, central bank activism (resulting in interest rates remaining “low for longer”) and stable credit fundamentals should continue to extend the life of the global credit cycle for the foreseeable future.
Relative Value By Sector
- Source: Bloomberg Barclays, June 2019
- Ibid.


