

Roberto Apelfeld, PhD
Manager of Pacific Rim Portfolio Risk & Head of Client Solutions

Paulo Caricati, CFA
Head of EMEA & LATAM Risk Management

Tania Labastida Garcia
Sustainability Risk Manager

Marjan Zahedi, PhD
Credit and ESG Risk Manager

Brishni Mukhopadhyay, CFA
ESG Product Specialist
KEY TAKEAWAYS
- Discussions on how to connect growing climate transition risks to the financial health of corporate bond issuers are just starting among financial practitioners.
- The move toward a low-carbon economy will unavoidably generate a risk for the whole financial system, as issuers are expected to be impacted.
- Our analysis takes a bottom-up approach to assess the impact from higher carbon taxes on estimated probabilities of default of issuers.
- We are proposing a framework to assess how corporate defaults evolve as carbon prices increase, and we offer a toolkit to compare pledged emission reductions against issuer creditworthiness over time.
- Our view is that ultimately the profitability of companies that do not adapt to reduce carbon emissions will be harmed by effective taxes on their emissions through a variety of carbon pricing mechanisms.
Introduction
The transition risks associated with climate change and the impact on corporates from a credit perspective can be acute if not correctly assessed and priced in. Companies that fail to reduce their emissions might be subject to financial, regulatory and reputational risks. Increasingly, policy goals such as the Net Zero Paris Agreement, various central bank consultations and policies on climate scenario analysis and changing consumer preferences have necessitated the requirement to incorporate climate transition risks into corporate risk assessment. While various mechanisms such as carbon taxes, or taxes on emissions, emissions trading systems, credit mechanisms, incentives and subsidies have been suggested, practitioners are still at a nascent stage in their discussions to assess and measure these risks.
Discussions on how to connect these growing transition risks to the financial health of corporate bond issuers are just starting among financial practitioners. In a world where discussions and policies center around taxing emissions, the future might be dim for companies that have higher Weighted Average Carbon Intensity (WACI)—or that emit too much carbon relative to their revenues, and do not act toward change—and estimates of their default probabilities should reflect that. If we want to assess the creditworthiness of issuers in the future, we must contemplate the potential of increasingly rigid actions from the international community against emission offenders.
The move toward a low-carbon economy will unavoidably generate a risk for the whole financial system, as corporate issuers are expected to be impacted, some more than others. Our analysis takes a bottom-up approach to assess the impact from higher carbon taxes on estimated probabilities of default of corporate issuers. We use the United Nations’ Intergovernmental Panel on Climate Change1 (IPCC) scenarios, which is the respective United Nations body for assessing the science related to climate change. The IPCC compiles several research pieces that estimate future carbon prices required to limit earth temperature anomalies by the end of the century to different targets. The more ambitious the objective of containing temperature increases against pre-industrial levels is, the higher carbon prices will have to be in the future, and the more likely it will be that companies that do not adapt their business models will struggle. The IPCC scenarios offer a glidepath for carbon price increases until the end of the century. Several points related to these scenarios were already discussed in one of our recent publications, “Portfolio Risk and Climate Change, Transition Risks in Credit Portfolios” and our objective in this paper is to extend that analysis by focusing on the evolution of corporate default probabilities over time under different future carbon price scenarios.
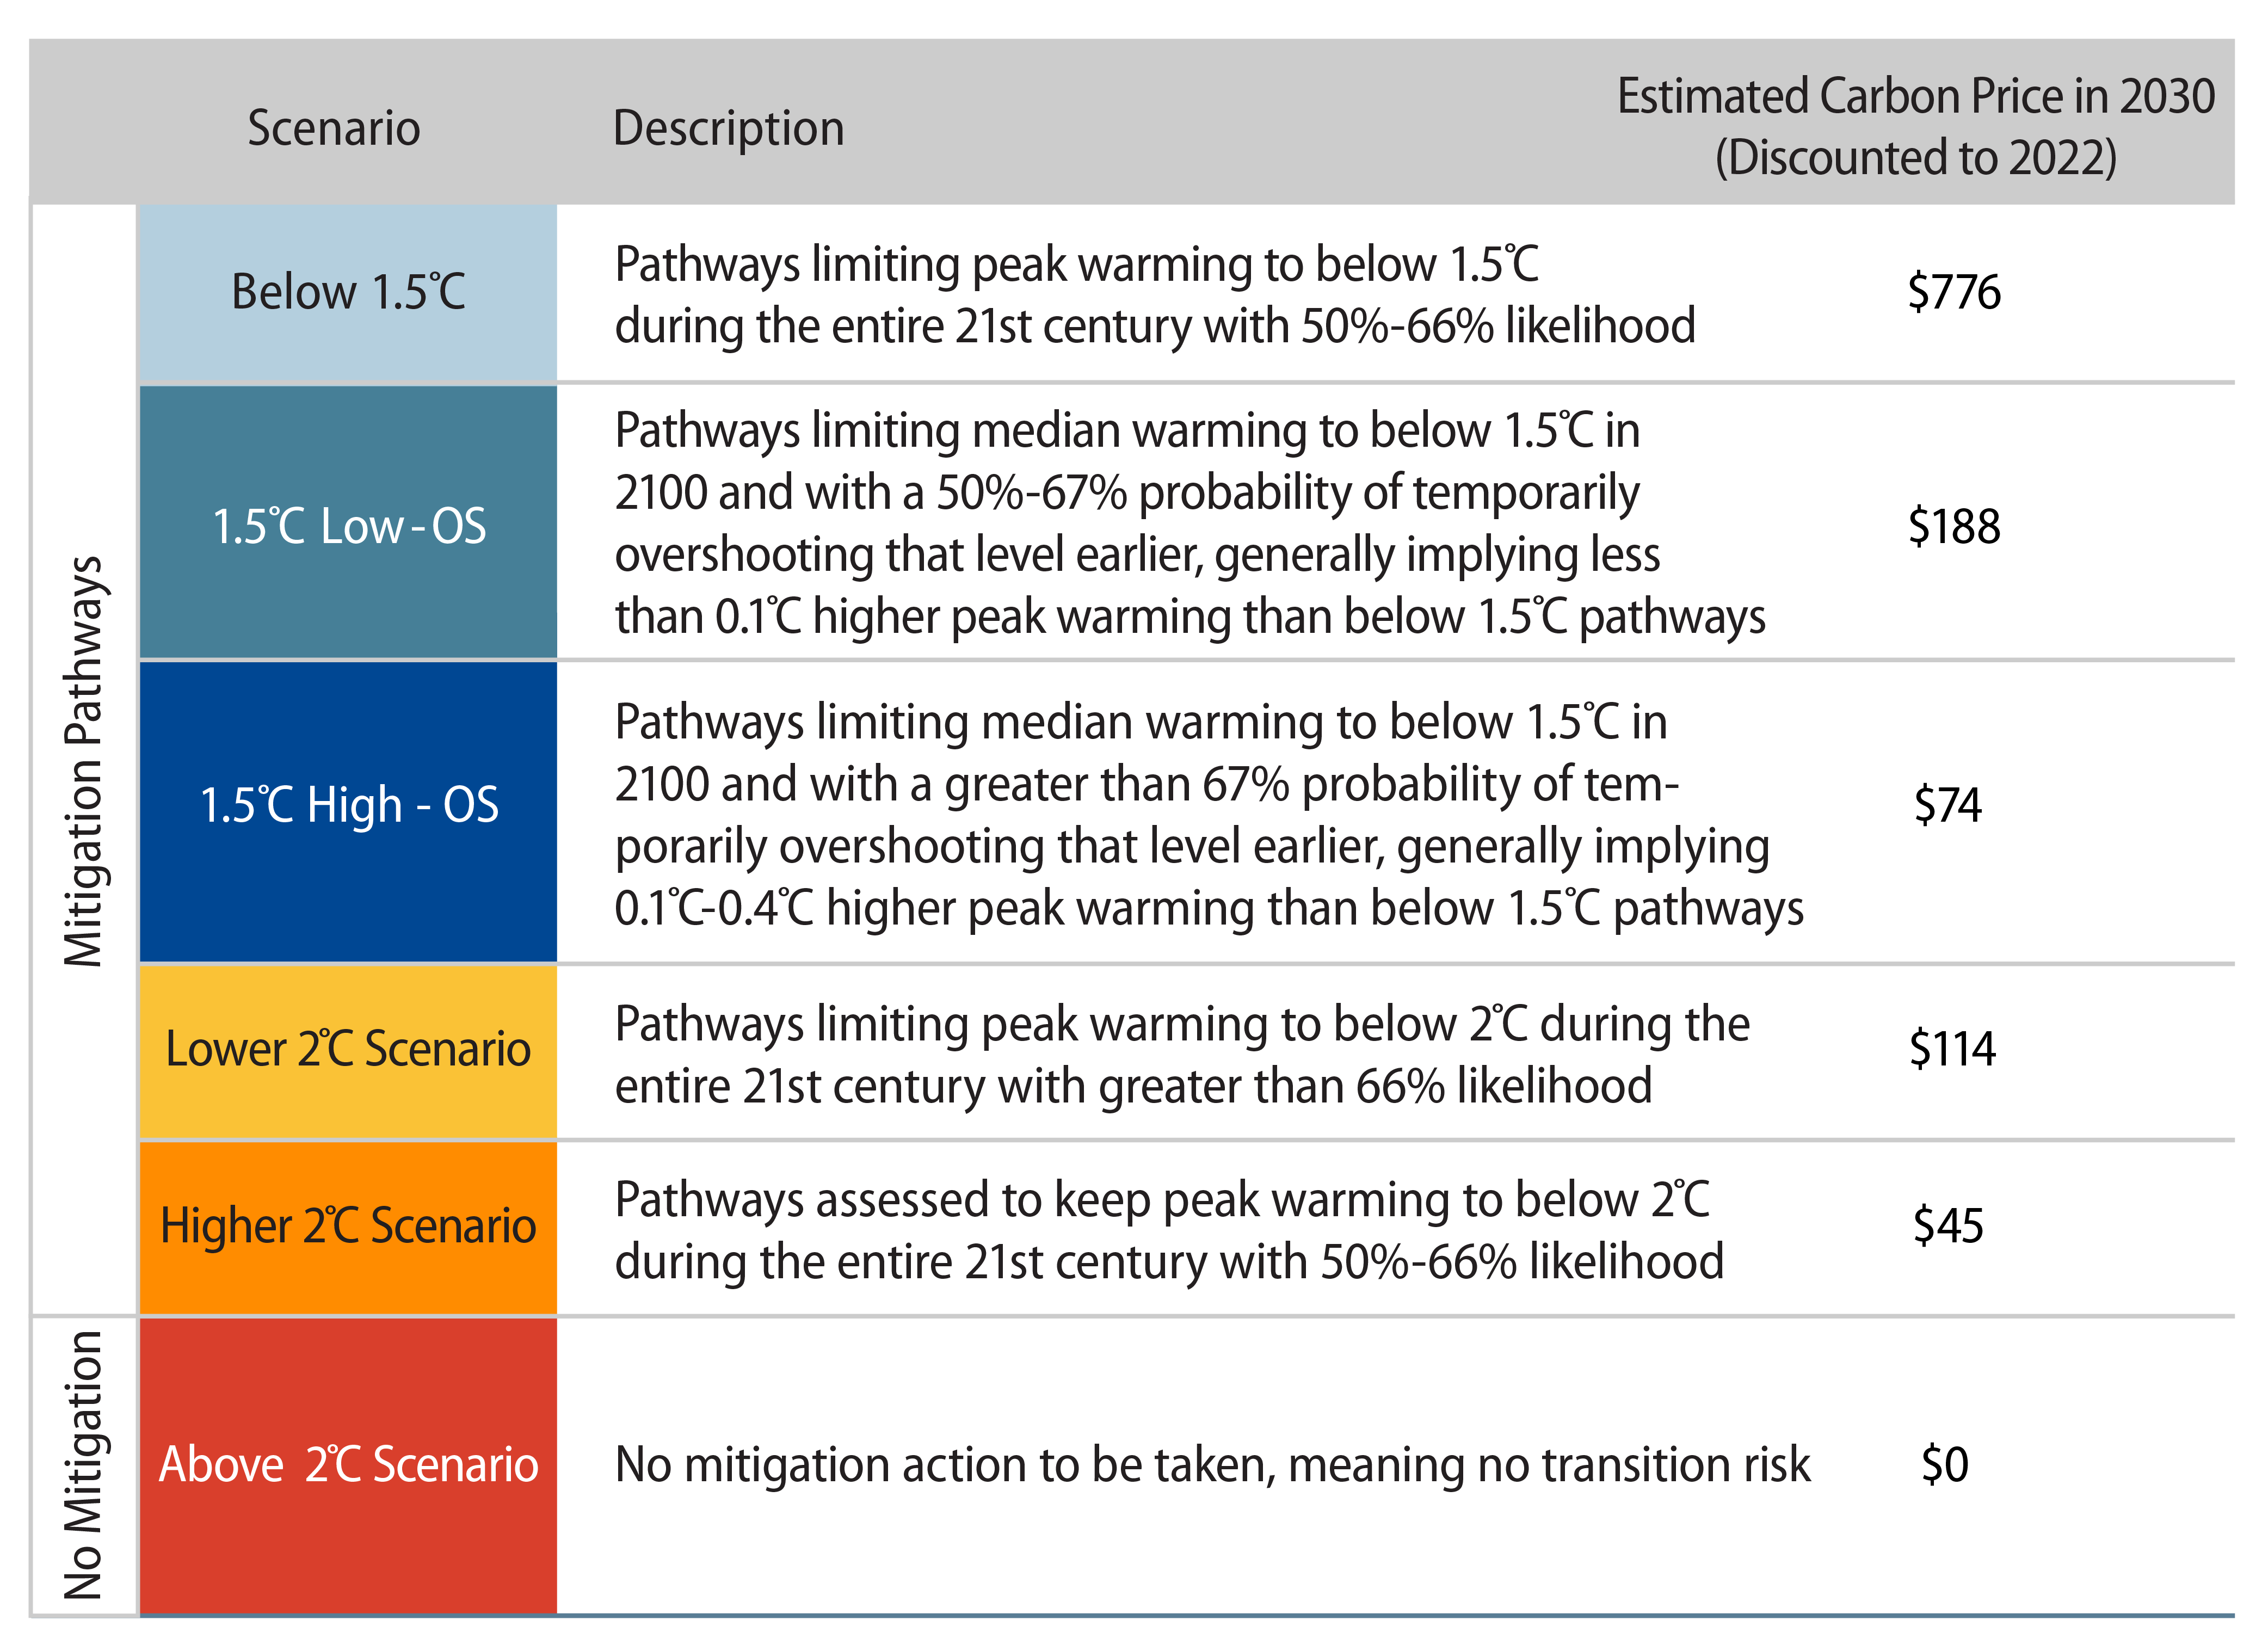
The profitability of companies that do not adapt to reduce carbon emissions will be harmed by effective taxes on their emissions through the different carbon pricing mechanisms. The impact on costs reduces a company’s value, likely affecting its default probability, rating, stock and bond prices. Our analysis is based on Scope 1 and Scope 2 emission data for each corporate issuer. Western Asset’s proprietary risk system, WISER—the Western Information System for Estimating Risk—has a credit default model (CDM) that uses a Merton2 based framework, combined with recent financial information about the issuer, to estimate corporate default probabilities. We explore, using our CDM, the evolution of corporate defaults over time in the face of growing carbon prices. Companies that adapt their businesses or reduce emissions can alleviate the impact on their profitability and limit their likelihood of defaulting, even as carbon prices increase, depending on the magnitude of their actions toward reducing emissions. As shown in Exhibit 1, in order to achieve an ambitious temperature rise target with a high likelihood, the IPCC estimate of the median carbon price (among several scenarios) must be extremely high—much higher than in other less ambitious scenarios—which would imply an immense “tax” burden to corporations.
Assuming Pathways for Carbon Prices
We analyze the difference between corporate issuer default probabilities estimated with current carbon prices, and future default probabilities as carbon prices evolve under the different IPCC scenarios. Exhibit 1 shows the median carbon prices in 2030 assumed in each of the IPCC scenarios. We bring those future prices to year-end 2022 values assuming an annual discount rate of 2.5%.
The current estimated probability of default assesses the issuer’s financial health based on information currently available; this implicitly includes today’s carbon prices. As in most cases, corporate default probabilities are estimated in annualized terms, so in this multi-year study a point-in-time (PIT) probability should be an estimate of an issuer’s likelihood of defaulting during a one-year interval. We use the year 2030 as the end point of our horizon, given that the first available estimated carbon prices of the IPCC scenarios are for that year. We refrain from using longer horizons given the amount of uncertainty surrounding even longer-term estimates of carbon prices for different temperature targets. For this exercise, we use the year 2030 IPCC median carbon price estimates, as the scenarios encompass a wide range of estimates from different studies. While the Firm has the ability to project the analysis up to the year 2100, in line with IPCC data, given the time horizon in question and the constant evolution of data, we have chosen to illustrate it to 2030.
To estimate today the likelihood that a corporate issuer defaults in the year 2030, we must assume that the issuer does not default prior to 2030. We then need to first estimate the probability that the issuer does not default in every year from now until 2029. To do so, we need pathways for carbon prices under each scenario for every year between now and 2029 that converge with the scenarios’ published median prices in 2030. We assume, for simplicity, that carbon prices in each scenario grow linearly in present-value terms, until they reach the median price estimates in 2030. Exhibit 2 shows our assumed carbon price pathways toward the 2030 IPCC median estimates, in year-end 2022 present-value terms. Emissions pathways such as Sustainable Development Scenarios (SDS), or Paris Agreement Capital Transition Assessment (PACTA) tend to be asymptotic in nature with initial marginal decrease followed by a much steeper decline in subsequent years. Adopting a linear pathway allows for a more conservative approach with an equal marginal change across all periods thus obviating sharper unrealistic changes in later periods that could result in some corporates' failure to adapt a serious pathway to reduction. In the Net Zero Paris Aligned 1.5°C scenarios, carbon prices grow steeply given the carbon taxes needed to be levied on corporates based on data published by the IPCC.
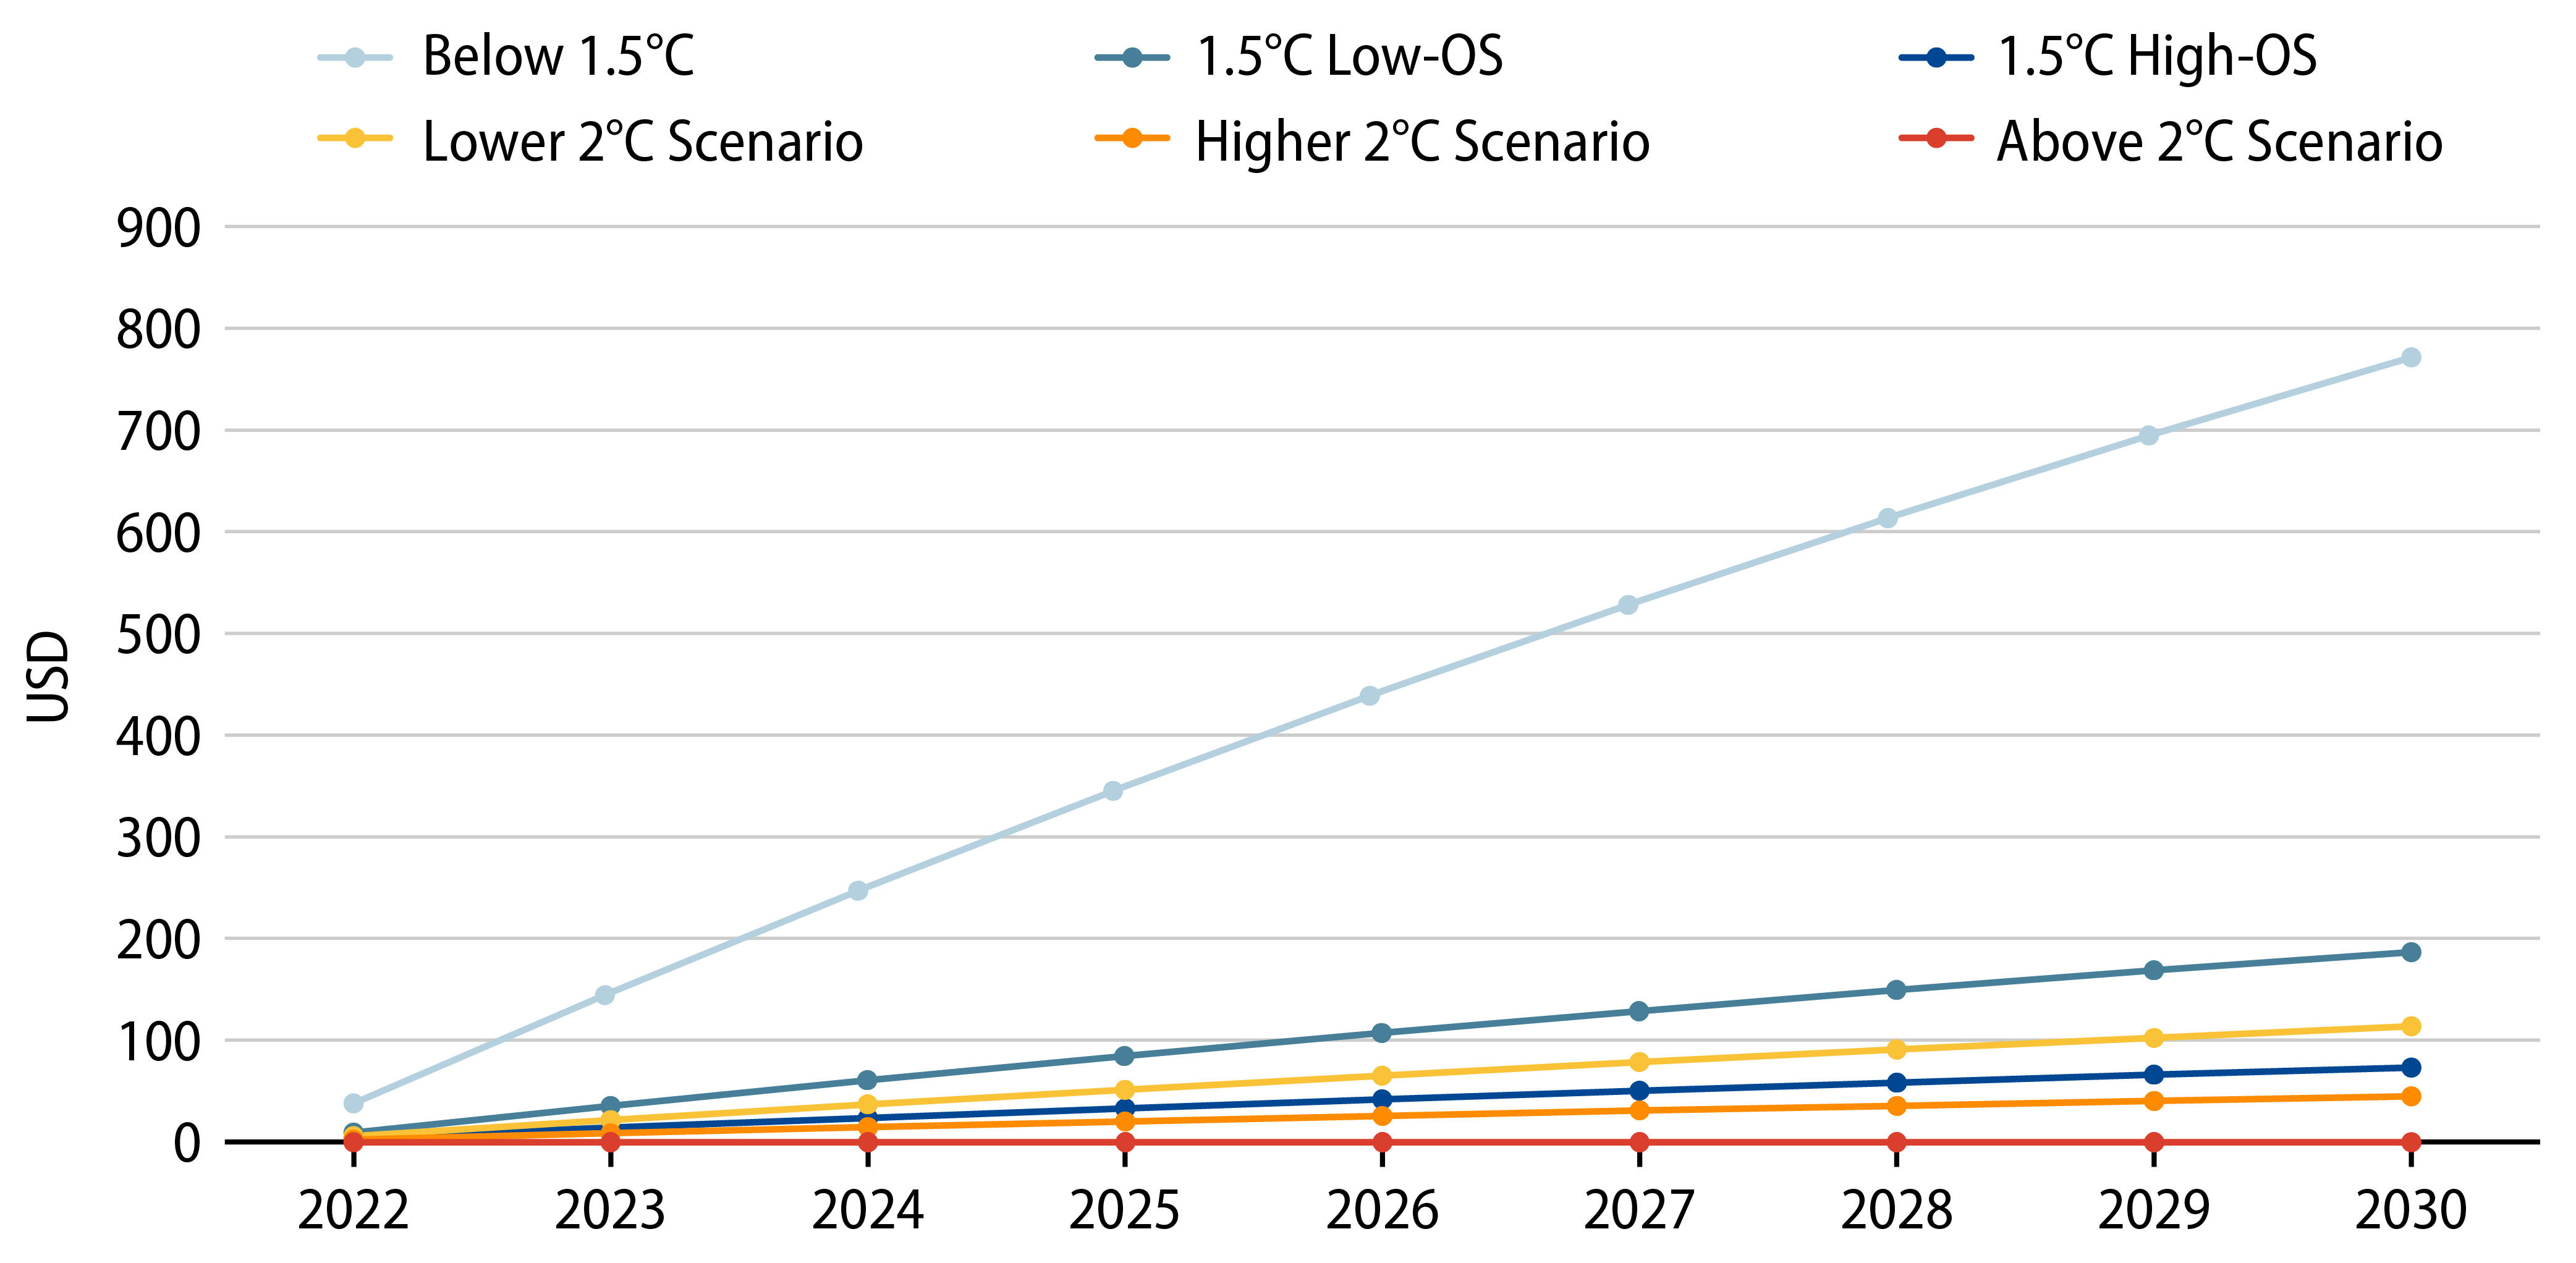
We could have assumed other carbon price pathways to estimate the intermediate survival probabilities. The model we use to assess cumulative and PIT default probabilities is flexible enough to allow for different carbon price pathways. Using Exhibit 2, we can immediately observe how different the Below 1.5°C IPCC scenario is from the others, and that it is likely to be much more burdensome for corporates as mentioned earlier. This is the most restrictive scenario.
Corporate Default Probabilities Evolve as Carbon Prices Increase
Companies operating in different locations around the globe might already be paying carbon taxes in some form, though in most places those are seen as ineffective3 tools for inducing the corporate sector to either cut emissions or invest in the pursuit of cleaner technologies. In this analysis, corporate issuers face the additional burden from higher carbon taxes in every year until 2030. Shocks to the profitability of companies in every year are based on the difference between the present value of the assumed pathway carbon prices, and the effective carbon price the issuer currently faces in the countries where it operates. These are the carbon price shocks faced by companies in every year, under the assumed pathways for each scenario. The exception is the Above 2°C scenario, which entails no mitigation; carbon price shocks are nil in this scenario. For companies that operate in countries where a higher than projected price is already in place, we consider no change in carbon price, instead of a negative shock. Emissions are assumed to be correlated with revenues, for lack of more precise data on corporate emissions by location. Companies that operate in different countries are assumed to face carbon price shocks weighted on the basis of the percentage of revenues from their operations in each country. Abatement costs, R&D investments and implementation of new technologies, and all other costs associated with reducing emissions are not explicitly considered in our analysis. In our framework, these other costs are all expressed in the form of taxes on emissions created by carbon prices. We use S&P Capital IQ data for a breakdown of issuers’ revenues by different countries and regions. The shocks on carbon prices create negative shocks to profitability, which impact the distance to default of each issuer in our CDM, and increase the likelihood of future defaults estimated through our CDM.
In any specific year, the estimated probability of corporate survival is the complement of the PIT probability of default, which we estimate from our CDM using the assumed carbon price in effect in that year:
The probability of surviving for the whole period of the analysis, 2023 to 2030, is the product of all PIT estimated probabilities of survival of each year of the period4:
Finally, the probability of a corporate issuer defaulting by 2030 estimated at the end of 2022 is:
This (cumulative) probability in 2030, for example, is different than the probability of a default in 2030 estimated at the end of 2029; the PIT probability is estimated as of today. If we are at the end of 2029 and estimating the default probability for an issuer in 2030, we would already be aware that the issuer survived the journey between 2023 and 2029. Hence, the probability of default estimated in 2029 is lower than the same probability estimated as of today, which needs to assume survival for the next seven years.
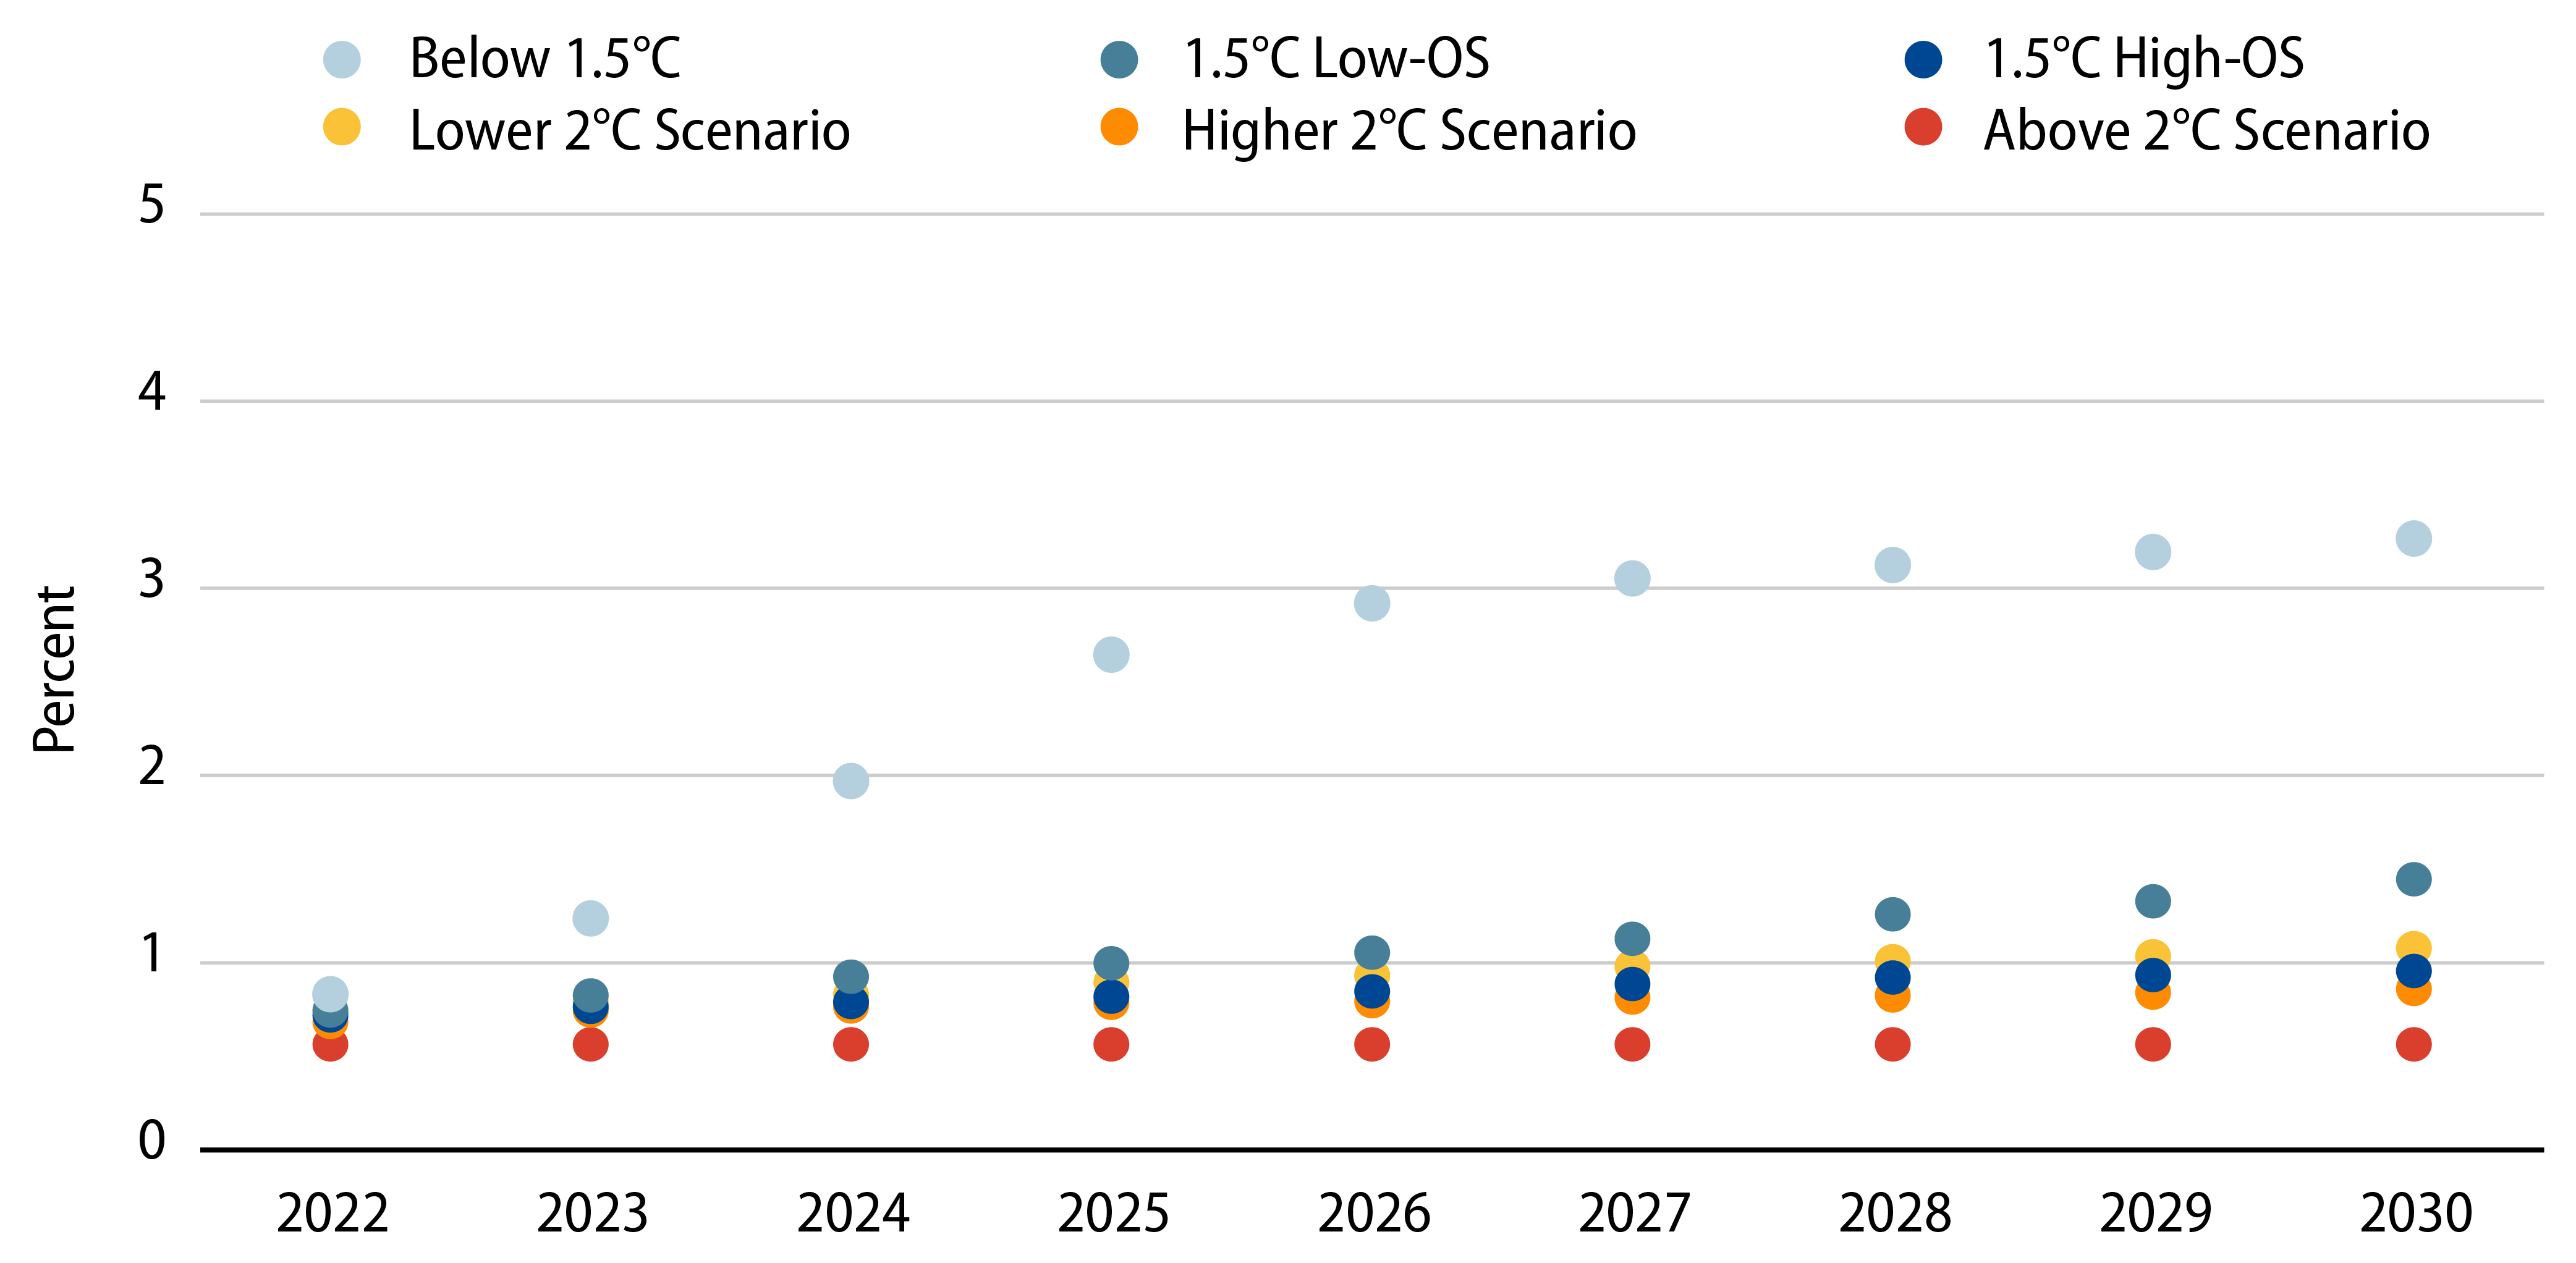
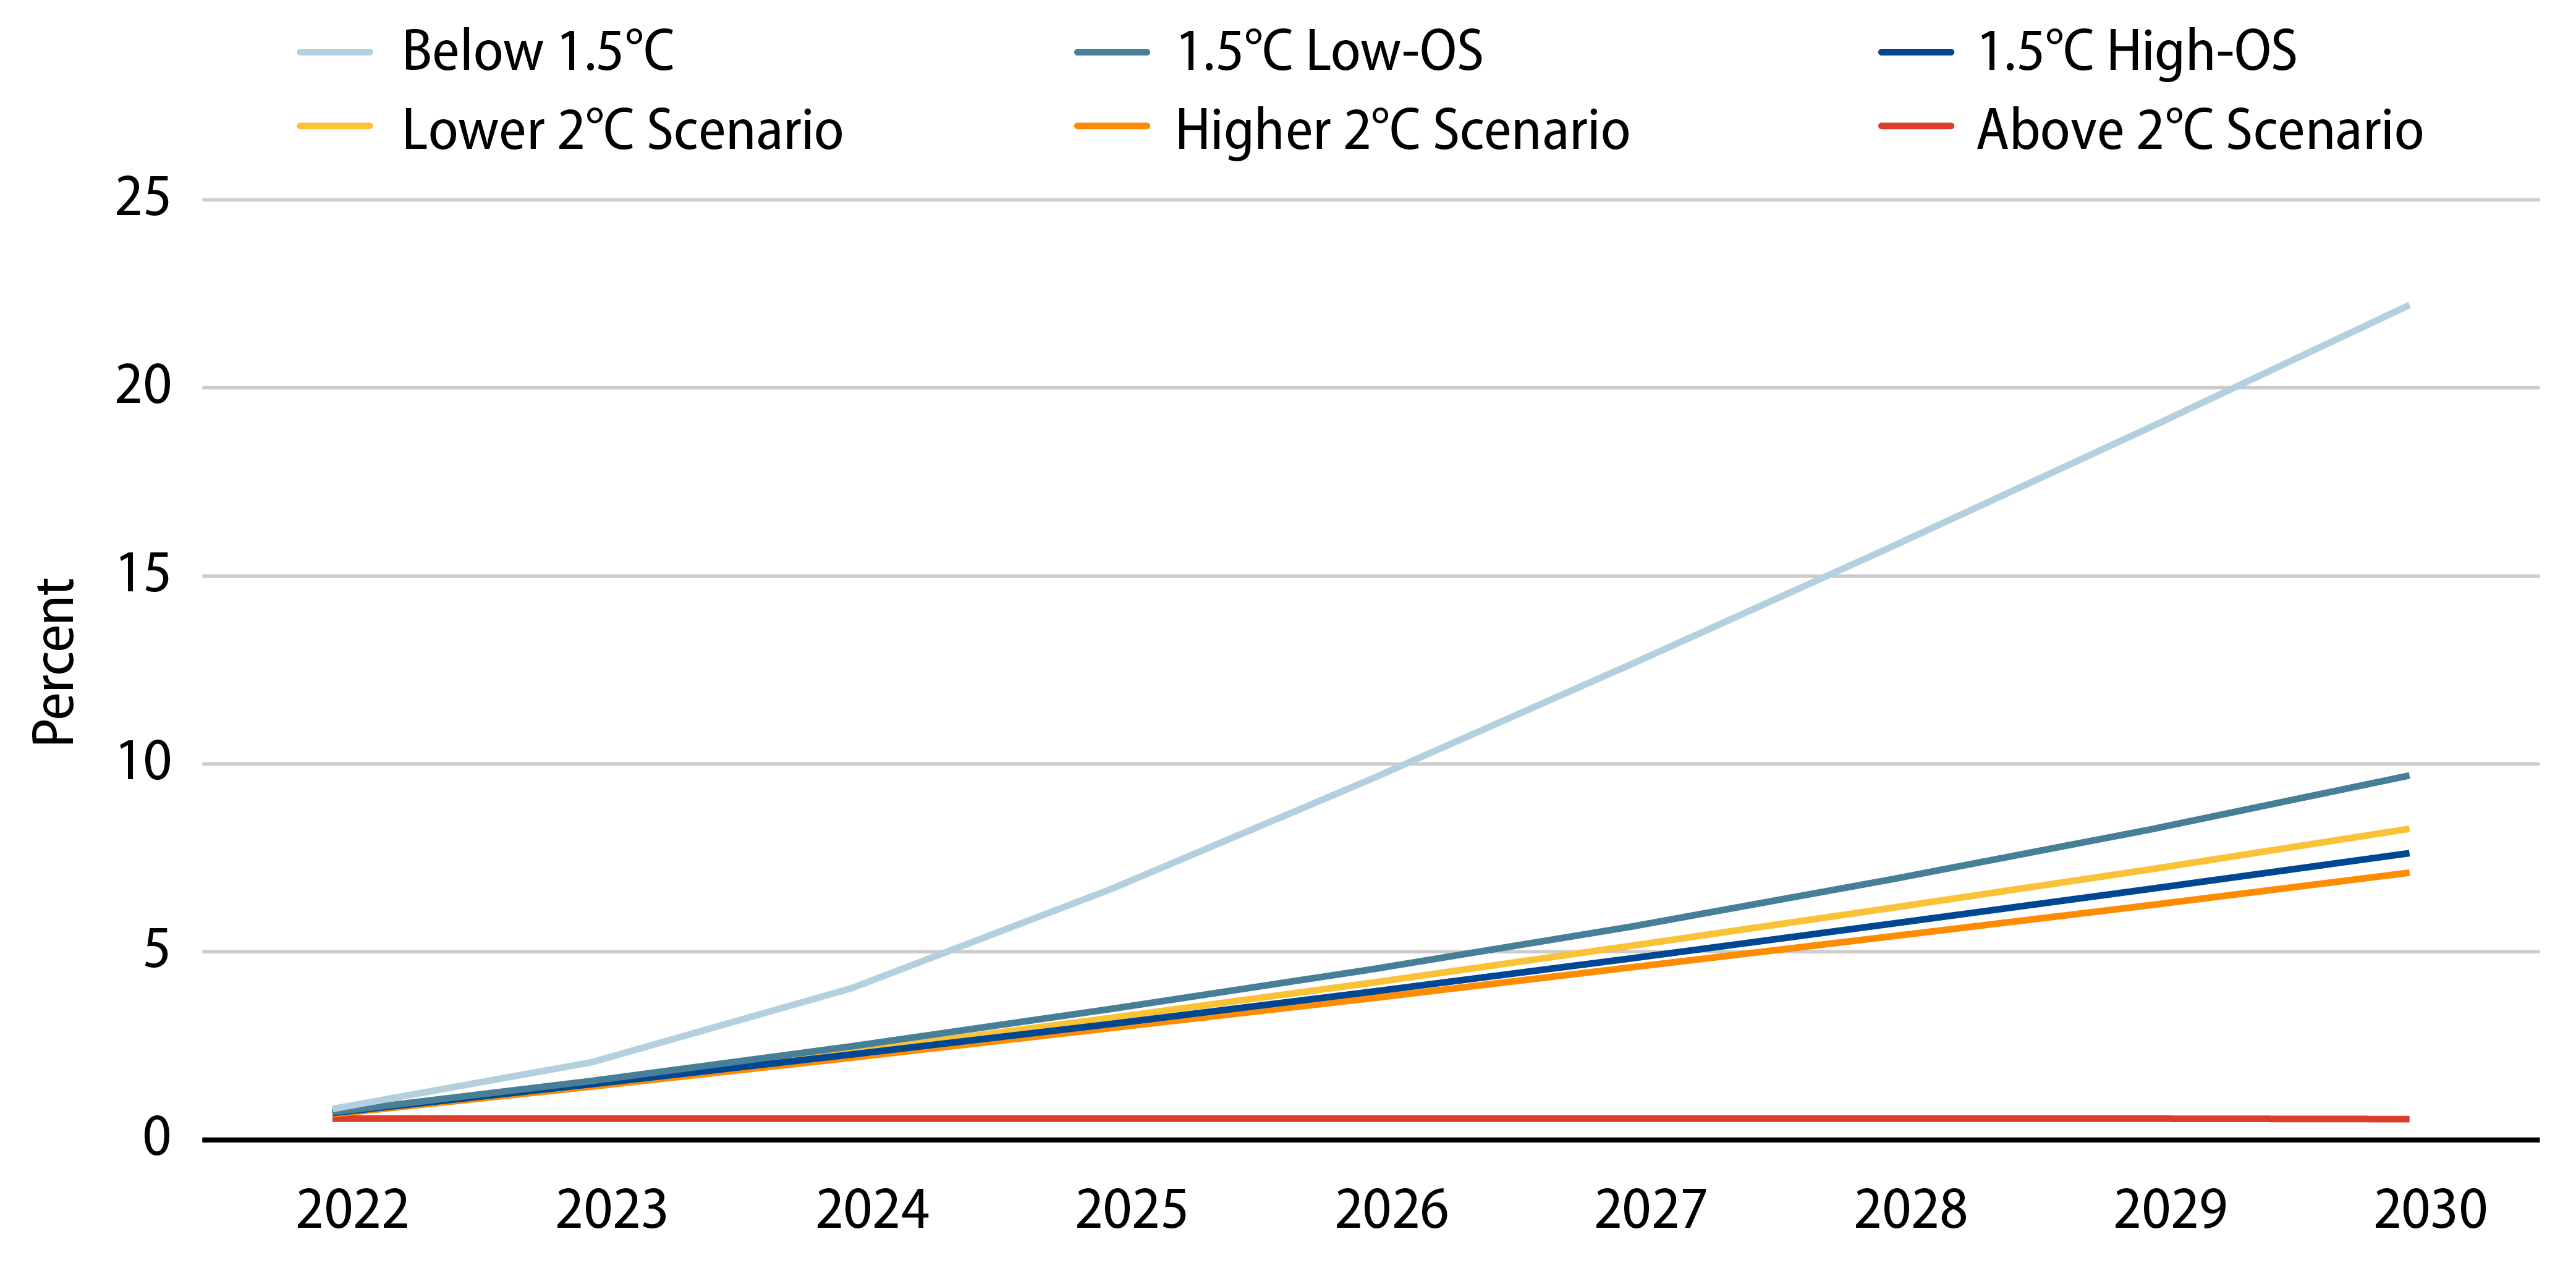
Exhibits 3 and 4 show, in the same scale, the difference between PIT and cumulative default probabilities of a corporate bond portfolio over the years under each different IPCC scenario, given assumed pathways for carbon prices. Individual issuers’ estimated PIT and cumulative probabilities were aggregated by market values in order to obtain estimated portfolio level probabilities. We assume that companies do not change their emissions/revenues ratios over time. In the next section, we explore the possibility of reacting to increasing taxes on emissions. It's worth noting how burdensome the most ambitious scenario is for the average creditworthiness of this portfolio.
Fighting a Potential Default Ahead
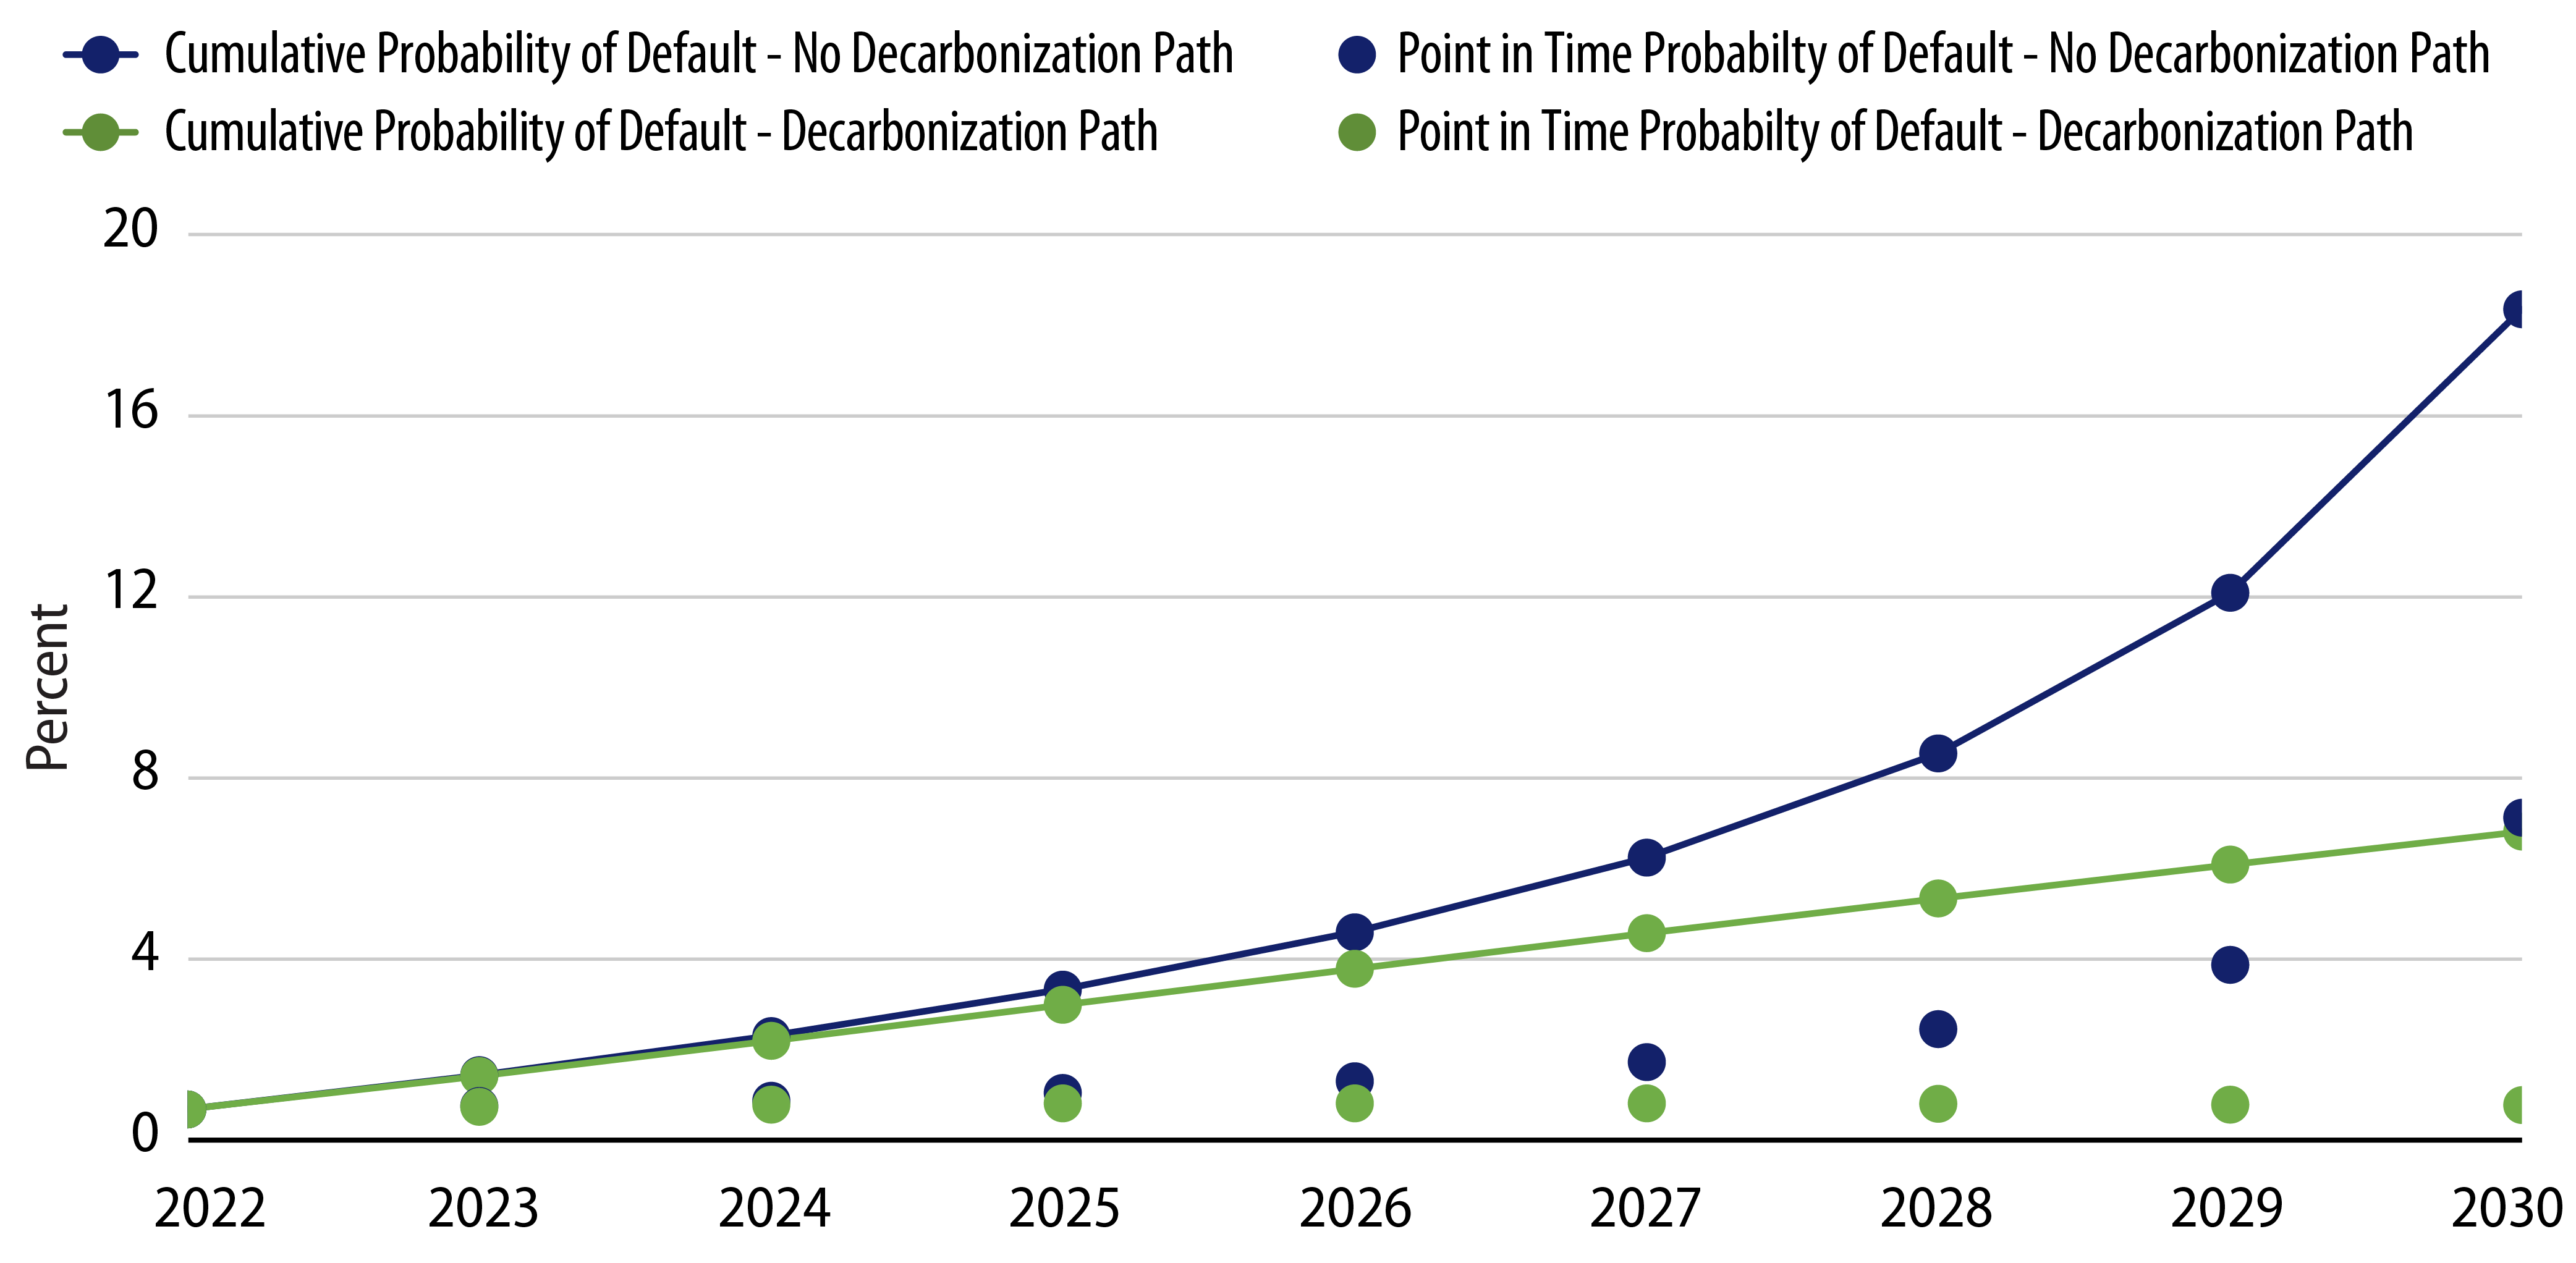
In Exhibit 5, we show estimated PIT and cumulative probabilities of default over time for a very large, well-known energy company that operates in many countries. We only show these probabilities in the most ambitious IPCC scenario so that the impact of emissions on the company’s profitability is more extreme, and differences are magnified. We did not use any commitments for future emissions levels in our initial assessment, but committed levels of future emissions can be easily considered as inputs in our model. We also show in Exhibit 5 what we call a decarbonization path for this same corporate issuer that encompasses an effective reduction in emissions (or adoption of new emissions offsetting technologies or other mechanisms that can effectively act as reductions in emissions). We show a path that keeps the estimated PIT probability of default in 2030 approximately in line with the current estimated probability of default. Even though we only show the impact on PIT and cumulative probabilities of default in the most ambitious IPCC scenario, we can affirm that the more ambitious the scenario for containing temperature rises by the end of the century, the more this energy sector multinational company would need to decarbonize to keep its assessed creditworthiness. Our model also allows for estimating the evolution of corporate default probabilities under pledged emissions targets for corporate issuers, and assessing if these are enough to contain the impacts to their credit ratings and survivability under our assumptions.
If corporate default probabilities are expected to increase as carbon prices rise, the issuer will then face potential downgrades in the future. In Exhibit 6, by comparing the estimated default probabilities with historical annual default probabilities, we show the potential downgrades that this corporate issuer might face if emissions per revenues either remain at current levels, or if it decarbonizes as shown in Exhibit 5.

Given the right level of decarbonization over time, even this energy company can maintain its credit ratings and a stable default likelihood. However, under the most extreme IPCC scenario, our model’s estimated level of decarbonization needed for this issuer to maintain its current level of creditworthiness is not trivial, at around 20% per year. This ambitious scenario, however, has a very low probability of being adopted. Based on recent research from Sherwood et al5, we estimate that the likelihood of this scenario becoming effective is approximately 2%. Nonetheless, we used it to more clearly showcase the impact of changes in carbon taxes on estimated default probabilities and ratings.
It is interesting to see the behavior of the PIT default probability over time. Under the current carbon intensity (emissions/revenues) level of this issuer, the PIT default probability is monotonically increasing. Meanwhile, under the decarbonization path, the PIT estimated default probability initially grows as the immediate burden of higher carbon taxes takes effect. But, as decarbonization successively occurs at a substantial pace, the company is able to reduce taxes on emissions to more acceptable levels. As a result, the estimated PIT default probability responds accordingly. Obviously, successive decarbonization year after year is increasingly more difficult.
Conclusion
Although current taxes on emissions do not currently pose an undue burden on most corporate issues, there may be potential future scenarios where their survival might be jeopardized in the case of an inability to mitigate climate transition risks. As always, investors will not wait until carbon prices actually increase before rebalancing their portfolios away from issuers that potentially face a deterioration in creditworthiness. Despite all the uncertainty about the future of carbon prices, we expect that investors will assess the prospects of decarbonization of the corporate issuers in their portfolios, and the actions issuers are promising to take in order to cut emissions. Our analysis attempts to create a framework to assess how corporate defaults evolve as carbon prices increase. We provide a toolkit to compare pledged emission reductions against issuer creditworthiness over time. Portfolio-level assessment is easily achievable through simple market value weighted aggregation.
To accurately analyze corporate issuers under higher future taxes on emissions, it is important to use the appropriate estimate of corporate default probabilities; issuers need to first survive the path from now to that future date under an increasing burden on emissions. However, they might fail before that future date arrives. The current carbon price environment, as most agree, seems to be ineffective in containing corporate emissions, and hence, estimating corporate default probabilities under relaxed restrictions on emissions does not capture the true challenges that some emitters will face in the future. It is this realization that led to the build-out of our model to help us analyze the steps toward decarbonization that issuers might need to take to avoid a deterioration in their creditworthiness, and ultimately survive in a world of increasing awareness of climate issues.
- Intergovernmental Panel on Climate Change (IPCC)—Panel (a) from Rogelj, J., D. Shindell, K. Jiang, S. Fifita, P. Forster, V. Ginzburg, C. Handa, H. Kheshgi, S. Kobayashi, E. Kriegler, L. Mundaca, R. Séférian, and M.V.Vilariño, 2018: Mitigation Pathways Compatible with 1.5°C in the Context of Sustainable Development. In: Global Warming of 1.5°C. An IPCC Special Report on the impacts of global warming of 1.5°C above pre-industrial levels and related global greenhouse gas emission pathways, in the context of strengthening the global response to the threat of climate change, sustainable development, and efforts to eradicate poverty [Masson-Delmotte, V., P. Zhai, H.-O. Pörtner, D. Roberts, J. Skea, P.R. Shukla, A. Pirani, W. Moufouma-Okia, C. Péan, R. Pidcock, S. Connors, J.B.R. Matthews, Y. Chen, X. Zhou, M.I. Gomis, E. Lonnoy, T. Maycock, M. Tignor, and T. Waterfield (eds.)]. In Press.
- Merton, Robert C. (1974). On the Pricing of Corporate Debt: The Risk Structure of Interest Rates. Journal of Finance. 29 (2): 449–470.
- These might be zero in several countries. In some countries, if subsidies to companies or sectors are available, effective carbon prices can be negative.
- Given the assumptions in the Merton structural model for the issuer stock price evolution, conditional probabilities can be estimated in this way. But we must point out that our CDM also incorporates current balance sheet information, that might create some intertemporal dependencies in our corporate default estimates. Given the difficulty of assessing balance sheet serial dependencies, we assume that the formula is valid. For issuers that do not have publicly traded stocks, we assumed sector medians.
- Steven C. Sherwood et al 2022 Environ. Res. Lett. 17 064022