

We sat down with Portfolio Manager and Head of Global Investment-Grade Credit Ryan Brist and Product Specialist James So to discuss general concerns over deterioration of the domestic credit market and specific concerns about the growth of the BBB quality cohort. Ryan and James also delve into historical performance by issue quality and discuss the current market outlook.
RB: Dark clouds are gathering across the global investment landscape. They include potential issues with Brexit, Italy, a China slowdown, emerging market problems in general, the US mid-term elections and the ongoing Russian collusion investigation. There’s also a perception that we are very late in the credit cycle and an overwhelming amount of BBBs could be the linchpin that ignites a dramatic downturn in risk markets. This is because the overall economic expansion has been unbroken since the great financial crisis. Approaching 10 years in duration, the current cycle is second in length only to that of the 1990s. While we do recognize that the current expansion is long in terms of time, we still argue that credit cycles don’t die of old age; rather, they end because of a build-up in excesses that needs to be corrected. Further, these excesses would require a catalyst to set off the correction. In Western Asset Product Specialist Tom McMahon’s latest piece, “The Credit Cycle: Key Signals We Watch,” he states that we don’t yet see any such trigger characteristics on the near-term horizon. Our view remains optimistic that the current trend of positive but unimpressive domestic growth will continue.
Macro Backdrop—Fear of Late Cycle

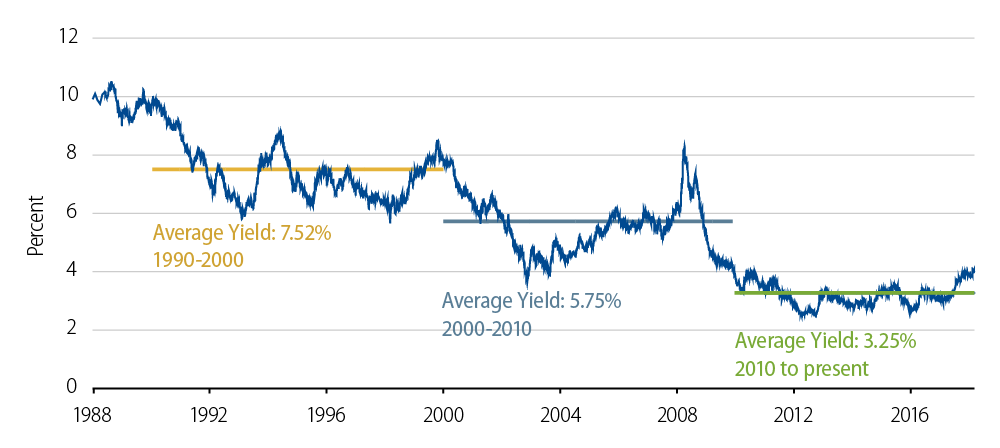
JS: It is true that over the past few decades the overall credit quality of the investment-grade market has gradually deteriorated. Back in the early 1970s the majority of the bonds outstanding were from AAA and AA issuers (i.e., utilities, oil and telephone issues), whereas today these higher-quality cohorts are less than 20% of the index combined. Since the great financial crisis, corporate managements have settled into the mindset that the optimal capital structure includes more leverage. Some of the reasons for this include a historically higher tax rate (as interest payments are deductible) and the declining cost of financing as overall rates have fallen over time (Exhibit 2). More recently, debt-financed M&A has been a cause of leverage creep over the last several years. It remains to be seen whether the trend continues given already elevated P/E levels, the marginal disincentive to use debt financing given lower tax rates (from 35% to 21%), and the increasing cost of debt as the curve has bear-flattened.
The Cost of Debt; Bloomberg Barclays US Credit Index Yield-to-Worst
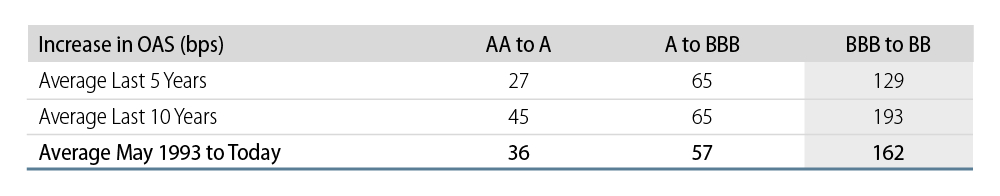
The gradual migration toward lower ratings has been caused by the fact that companies have incurred only an incremental cost for a lower-quality but still investment-grade balance sheet (Exhibit 3). Looking at the increase in spreads an issuer bears when moving to a lower-rating cohort, we see that an A rated issuer only pays 0.36% more than an AA rated company. Migration from single A to the BBB category has historically meant an additional 0.57% in financing costs. Given the rating sensitivities of many investor classes, there is a meaningful jump in financing costs when an issuer is downgraded to high-yield. The increase in the option-adjusted spread (OAS) of a BB issuer over a BBB issuer is 1.62%. Thus, many firms wish to hold the line once they settle in at BBB.
Increase in Option-Adjusted Spread (OAS)
RB: On that last point, when looking at Moody’s data on ratings migration (average five-year migration rates since 1970) the skew has been sharply more negative for higher-quality cohorts (AAs and As) relative to BBBs. One recent example is Union Pacific Corporation (UNP), the largest public railroad operator in the US. UNP recently announced a three-year $20 billion share buyback program resulting in the company initially issuing $6 billion in debt over a three-year period to partially fund the buybacks. Upon the announcement, both Moody’s and S&P downgraded UNP’s rating from low single A to high BBB. Even after the credit-negative news, Western Asset’s research still believed that UNP is an efficient operator with a strong track record. But management clearly feels no need to stick to its historically more conservative financial policy.
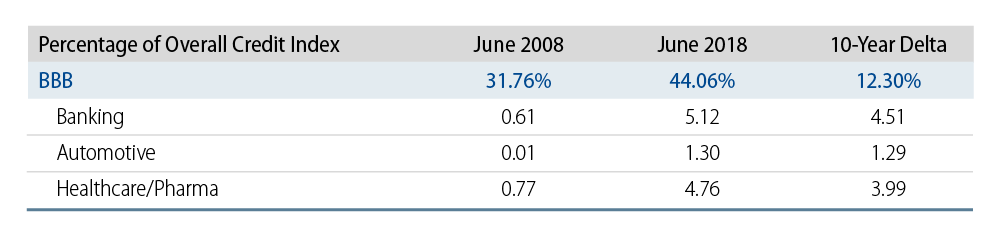
JS: One other point to highlight is that the growth of BBBs as a proportion of the investment-grade market over the past decade has largely been observed within three subsectors. As a percentage of the overall investment-grade market, BBBs in the Bloomberg Barclays US Investment-Grade Credit Index grew from 32% to 44%. Banks, auto, and healthcare/pharmaceuticals accounted for the bulk of that increase (Exhibit 4).
BBBs As a Proportion to the Investment-Grade Market Over the Past Decade
RB: The narrative around the growth of BBBs is that a proliferation of downgrades (fallen angels) will overwhelm the high-yield market, which is a scary prospect. When we take a closer look at the expansion of the BBB market, we see divergent paths for the three subsectors James mentioned.
Banks—The banking industry was downgraded en masse in the aftermath of the financial crisis but it is currently on a well-known fundamental upswing. Our global financials research team summed up our thoughts in a paper published in August 2017, “ Stronger, Safer, Simpler: The Investment Case for Banks a Decade After the Crisis,” and we still believe this thesis has legs. Record earnings, improving asset quality over the last 10 years and much higher capital ratios than in the past have this sector on an improving ratings trend. Bank of America senior paper was upgraded back to single A territory in late 2017 while Citi, which represents 90 basis points (bps) of the 5.12% in BBB banks, is rated Baa1/BBB+/A. Moody’s placed Citi’s outlook on positive watch back in November 2017, so even a one-notch upgrade will have Citi categorized back as single A. European banks make up a large swath of the remaining BBBs. While European banks are behind their US counterparts in terms of balance sheet repair, they are heading in the right direction and in a much stronger position than pre-crisis.
Healthcare/Pharma—This sector has gone through a secular fundamental decline. What used to be an AA/A industry has settled in at A/BBB as a result of deteriorating margins, weak product pipelines and generic competition. To combat these forces, industry consolidation was necessary but managements have generally been committed to investment-grade ratings. A great example to consider here is Abbot Labs. Abbot used to be an AAA company in 2000 and slowly migrated down to single A over time. In late 2016, it purchased St. Jude Medical for $25 billion and leverage went up. Multiple downgrades followed with Moody’s taking it to the lowest investment-grade rating of Baa3. Since then, Abbot has slowly deleveraged and Moody’s has followed with a series of rating upgrades, taking Abbot back to Baa1. Another comforting factor is that the healthcare/pharma sector is non-cyclical so it is much less exposed to a dramatic downturn in revenue during recessions.
Autos—The original equipment manufacturers (OEMs), Ford and GM, have been through a ratings roller coaster over the past couple of decades, but the most recent turn has been upward as a rising star back into investment-grade in the 2012 to 2014 timeframe. This subsector has become an area of concern as these companies are subject to forces beyond their control (peak sales, China slowdown and tariffs). We credit management with addressing legacy issues (debt load, underfunded pensions, labor contracts) and understand they have no intention of giving up their hard fought investment-grade rating. However, even with much stronger balance sheets today versus 2008, downgrade risk is a possibility as rising input costs eat into margins for an industry whose natural state is already operationally leveraged.
Another concern to highlight is the general risk of rating agencies changing their methodology. There has been a meaningful increase in M&A-related debt amongst certain large issuers (e.g., Anheuser-Busch InBev, CVS Health, Northrup Grumman) whose leverage metrics, when considered in isolation, are more consistent with a high-yield rating. The justification for a higher rating despite the incremental leverage has been tied to a variety of factors such as the sheer scale of the business, the ability to generate free cash flow, management’s stated intention to de-lever post M&A, and the defensive (i.e., non-cyclical) nature of some of these businesses. Markets have grown accustomed to the current equilibrium. If the agencies change their methodology resulting in a meaningful downgrade of one or some of these large issuers, the resulting market indigestion could be distressing.
JS: As one would expect, risk has been rewarded over time. We’ve plotted cumulative excess returns* by quality cohort and separated intermediate credit (1-10 years to maturity) from long credit (10+ years to maturity) for LDI investors (Exhibit 5). It should be no surprise that BBBs have generated the most excess returns, as one would expect more return when bearing more risk.
Cumulative Excess Returns* on Intermediate Credit By Rating Since July 31, 1988
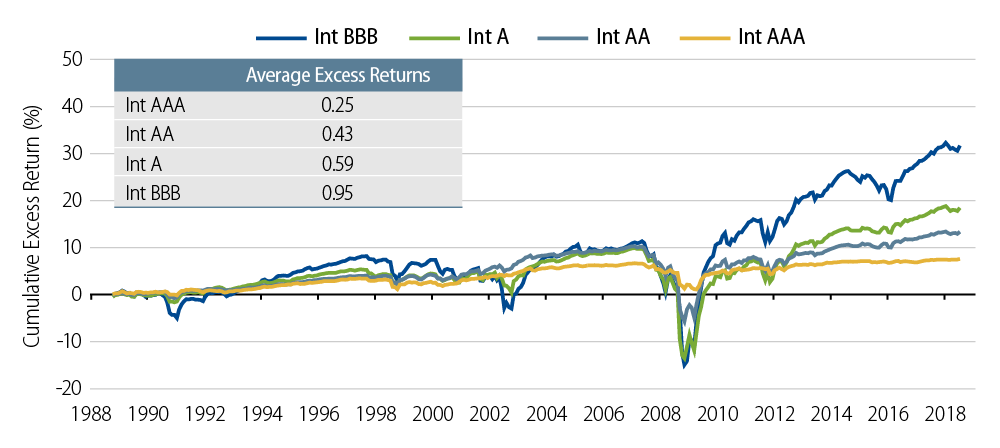
*Excess returns as calculated by Bloomberg Barclays are the incremental returns over a duration comparable Treasury thus removing the impact of fluctuating Treasury yields.
Cumulative Excess Returns* on Long Credit By Rating Since July 31, 1988

*Excess returns as calculated by Bloomberg Barclays are the incremental returns over a duration comparable Treasury thus removing the impact of fluctuating Treasury yields.
But there is a nuance to note between the intermediate-maturity end and longer-dated bonds. In the intermediate space, history has shown that excess returns progressively rose as quality fell/risk increased. With shorter-dated bonds there is a better chance of the lower-quality bonds maturing before a downgrade bumps them to a lower quality grouping.
In the long end, however, that has not been the case. Within the long credit space there has been a large give-up in returns when moving up in quality from long BBBs to long As. Long single As have also underperformed long AAs. Along with the historical ratings migration pattern, part of this is explained by some notable cases of jump-to-defaults from the single A realm (e.g., WorldCom, Lehman). We highlight this as a point of caution for LDI/pension investors that desire a higher-quality portfolio to optically be closer to the high-quality discount rate applied against the liability stream. As mentioned earlier, AAA and AA credits are a much smaller subset of the credit universe today. As such, long investment-grade credit investors are basically left to choose between single A and BBB bonds. Moving up in quality to single As may result in better tracking to a client’s liabilities but it has a cost in terms of keeping up with liability returns. As a result, timing matters and it must be noted that, other than during the 2007-2008 period, the drawdowns for BBBs have been more severe than for single As.
When looking at more recent performance, moving up in quality from BBB to single A hasn’t helped this year either. Single As are the only quality cohort with negative excess returns so far in 2018.
Bloomberg Barclays Credit Index Excess Returns
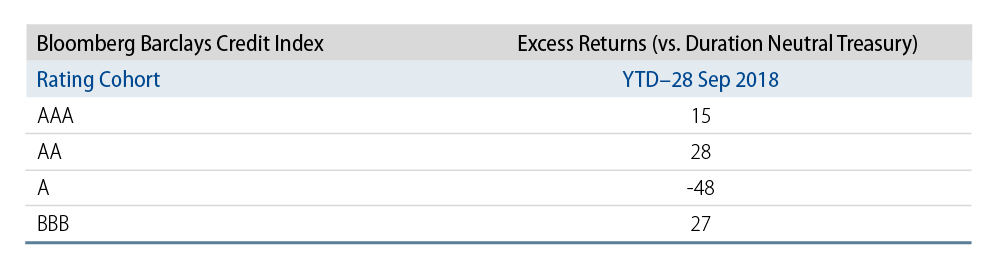
RB: Some additional high-profile examples of underperforming single A names this year include the aforementioned UNP as well as Starbucks, Disney and Comcast. Starbucks debt was downgraded to high BBB after the CEO announced that the company would “flex their balance sheet” by raising the dividend and increasing its share buyback program. Comcast (A3/A-/A-) and Disney (A2/A+/A) bonds also experienced high volatility during their bidding war for Fox and Sky assets. While past performance is no guarantee of future results, moving up in quality to single A simply to avoid BBBs may have been costly.
RB: Our fundamental outlook remains intact and we see stable economic growth (with fiscal policy now a tailwind), benign inflationary trends, strong corporate earnings, and better liquidity given a robust banking system today. Against this we are monitoring the risks from rising trade tensions and less accommodative monetary policy. Companies on the whole appear in good shape and US economic data continue to indicate that recession risk is remote. The technical backdrop appears to be in a more favorable place heading into the second half of the year with less issuance and the potential return of foreign demand. Despite increasing the risk profile in the spring/summer of this year as valuations had cheapened, we still carry a lower risk profile than we did at this time last year as we realize that market sentiment can decline if fundamentals shift from great to good. Our bias is still to be overweight industries that have been through the ends of their credit cycles, namely banks, metals and mining, and energy, while taking a cautious stance on many other industrial subsectors that are at risk of further leverage creep or additional shareholder-friendly behavior. Valuations are also more attractive today than at the beginning of the year. We believe it is prudent to remain disciplined as it relates to risk, but barring any significant surprises the overall environment should be supportive of credit.