skip navigation
Blog

Stay up to date on timely topics and market events. Subscribe to our Blog now.

ECONOMY
19 March 2024

Weekly Municipal Monitor—Wealth Boom Bodes Well for Muni Demand

By Sam Weitzman

Stay up to date on timely topics and market events. Subscribe to our Blog now.

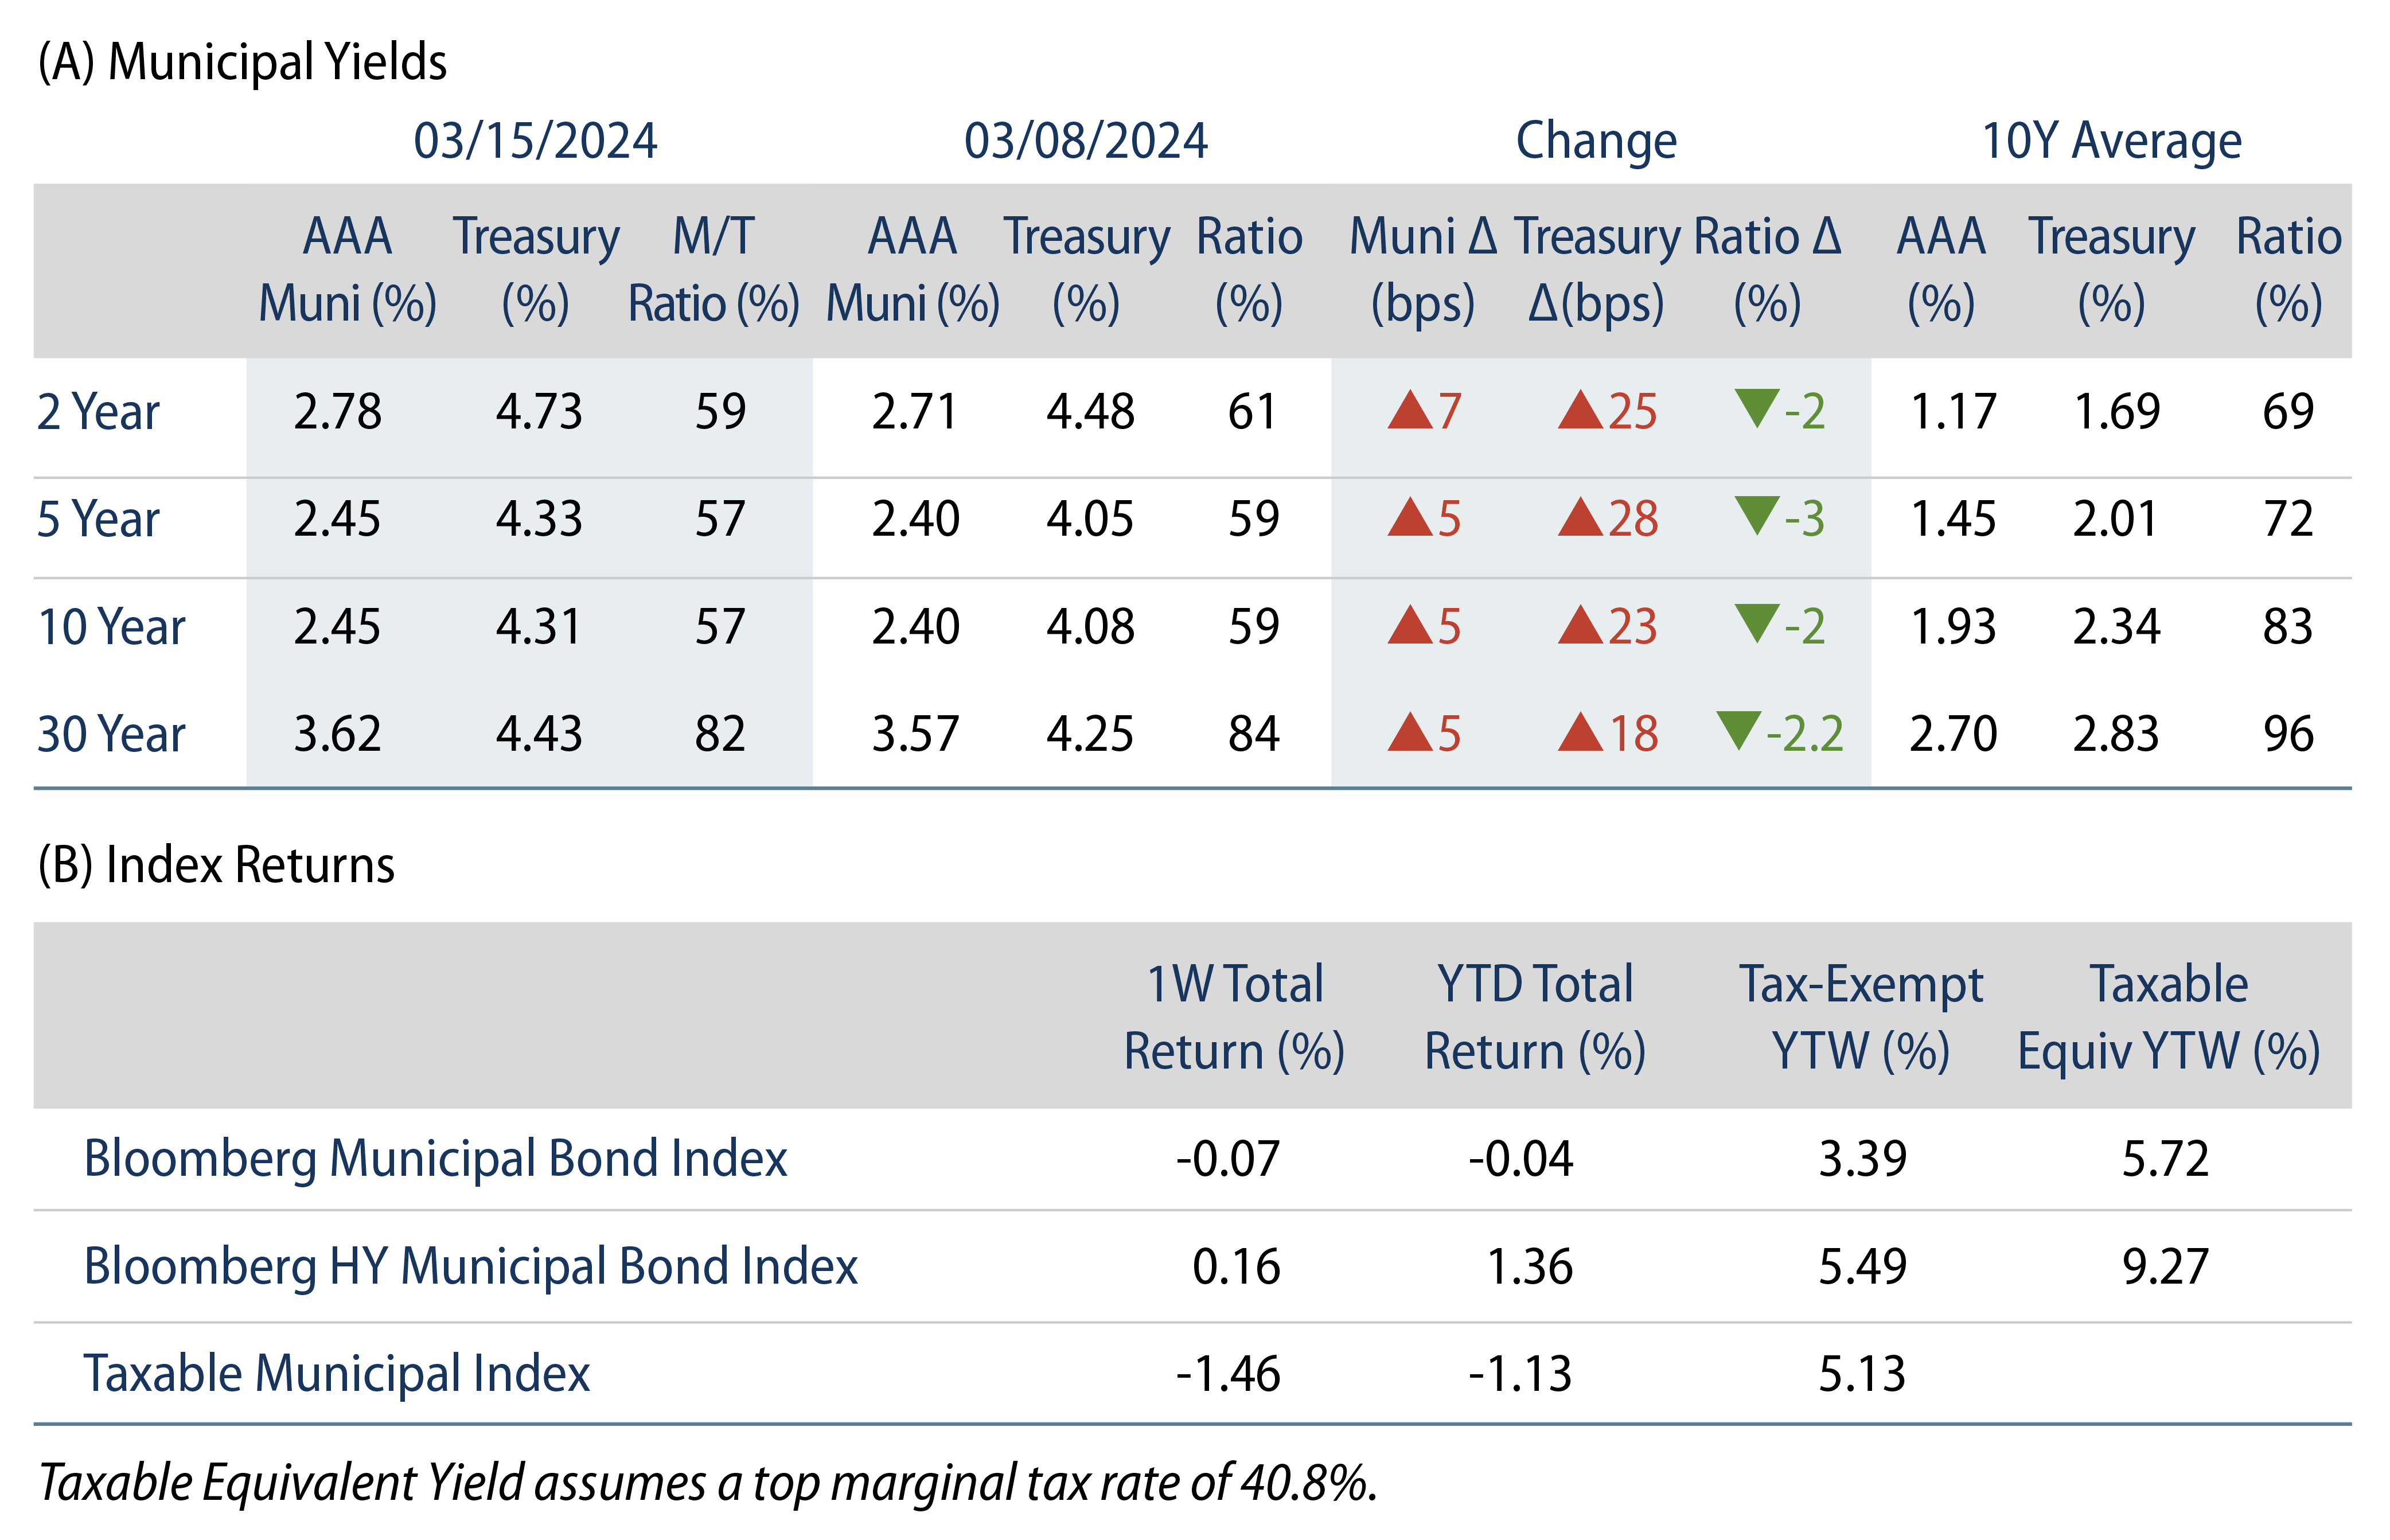
Municipals Posted Negative Returns Last Week

Munis posted negative returns last week and outperformed Treasuries, as Treasury yields moved higher on stronger-than-anticipated core Consumer Price Index (CPI) and Producer Price Index (PPI) data. High-grade muni yields moved higher across the yield curve, and technicals improved as municipal mutual funds recorded inflows. The Bloomberg Municipal Index returned -0.07% during the week, the High Yield Muni Index returned 0.16% and the Taxable Muni Index returned -1.46%. This week we highlight wealth trends from recent IRS data.

Fund Flows and Supply Levels Continued to Move Higher

Fund Flows: During the week ending March 16, weekly reporting municipal mutual funds recorded $295 million of net inflows, according to Lipper. Long-term funds recorded $315 million of inflows, intermediate funds recorded $25 million of inflows and high-yield funds recorded $279 million of inflows. Short-term funds recorded $52 million of outflows. This week’s inflows lead estimated year-to-date (YTD) net inflows higher to $4.6 billion.

Supply: The muni market recorded $10 billion of new-issue volume last week, up 10% from the prior week. YTD issuance of $83 billion is 38% higher than last year’s level, with tax-exempt issuance 52% higher and taxable issuance 48% lower year-over-year (YoY). This week’s calendar is expected to decline to $7.5 billion. Largest deals include $1.2 billion NY Metropolitan Transportation Authority (MTA) and $770 million Florida Development Corp transactions.

This Week in Munis: Wealth Boom Bodes Well for Muni Demand

Recently released IRS income data for the 2021 tax year highlights overall income and wealth trends across the US. For the municipal market, this reported income data across tax brackets and states provides insight into tax collections and taxing power for municipalities, a key gauge of credit health. From a market technicals perspective, income trends also inform the composition of potential demand for municipal securities, not only shedding light on the number of taxpayers that can benefit from the municipal tax exemption, but also in which states demand could be highest.

Exhibit 1: US Adjusted Gross Income (AGI) by Year
Explore US Adjusted Gross Income (AGI) by Year
Source: US Internal Revenue Service (IRS). IRS data for tax years 2001-2021. As of 27 Feb 24. Select the image to expand the view.

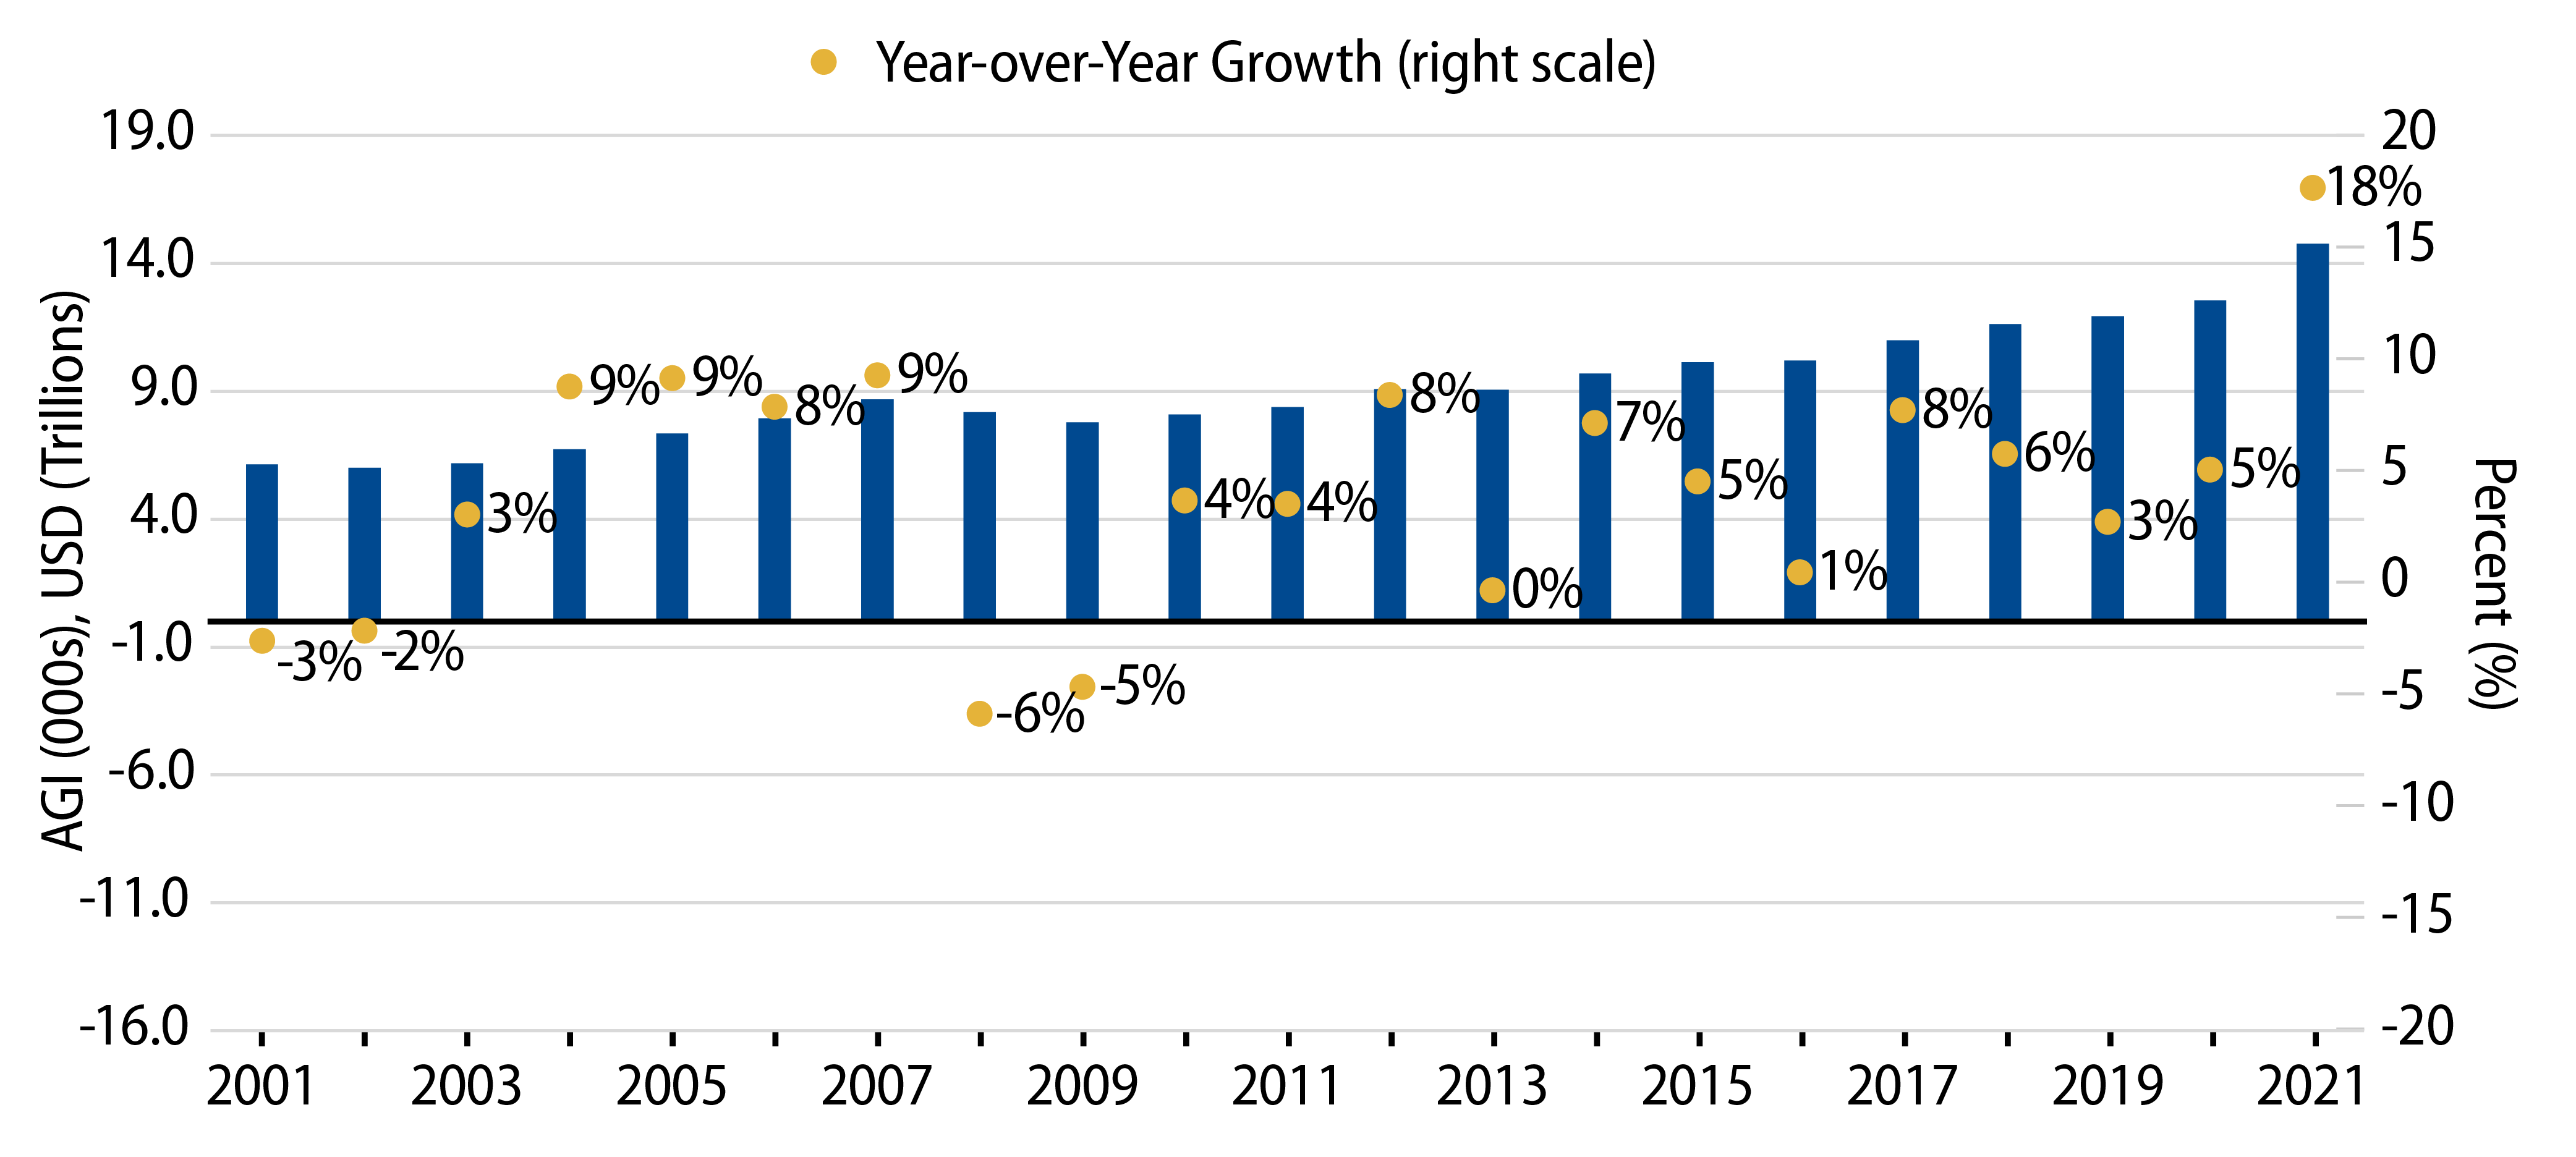
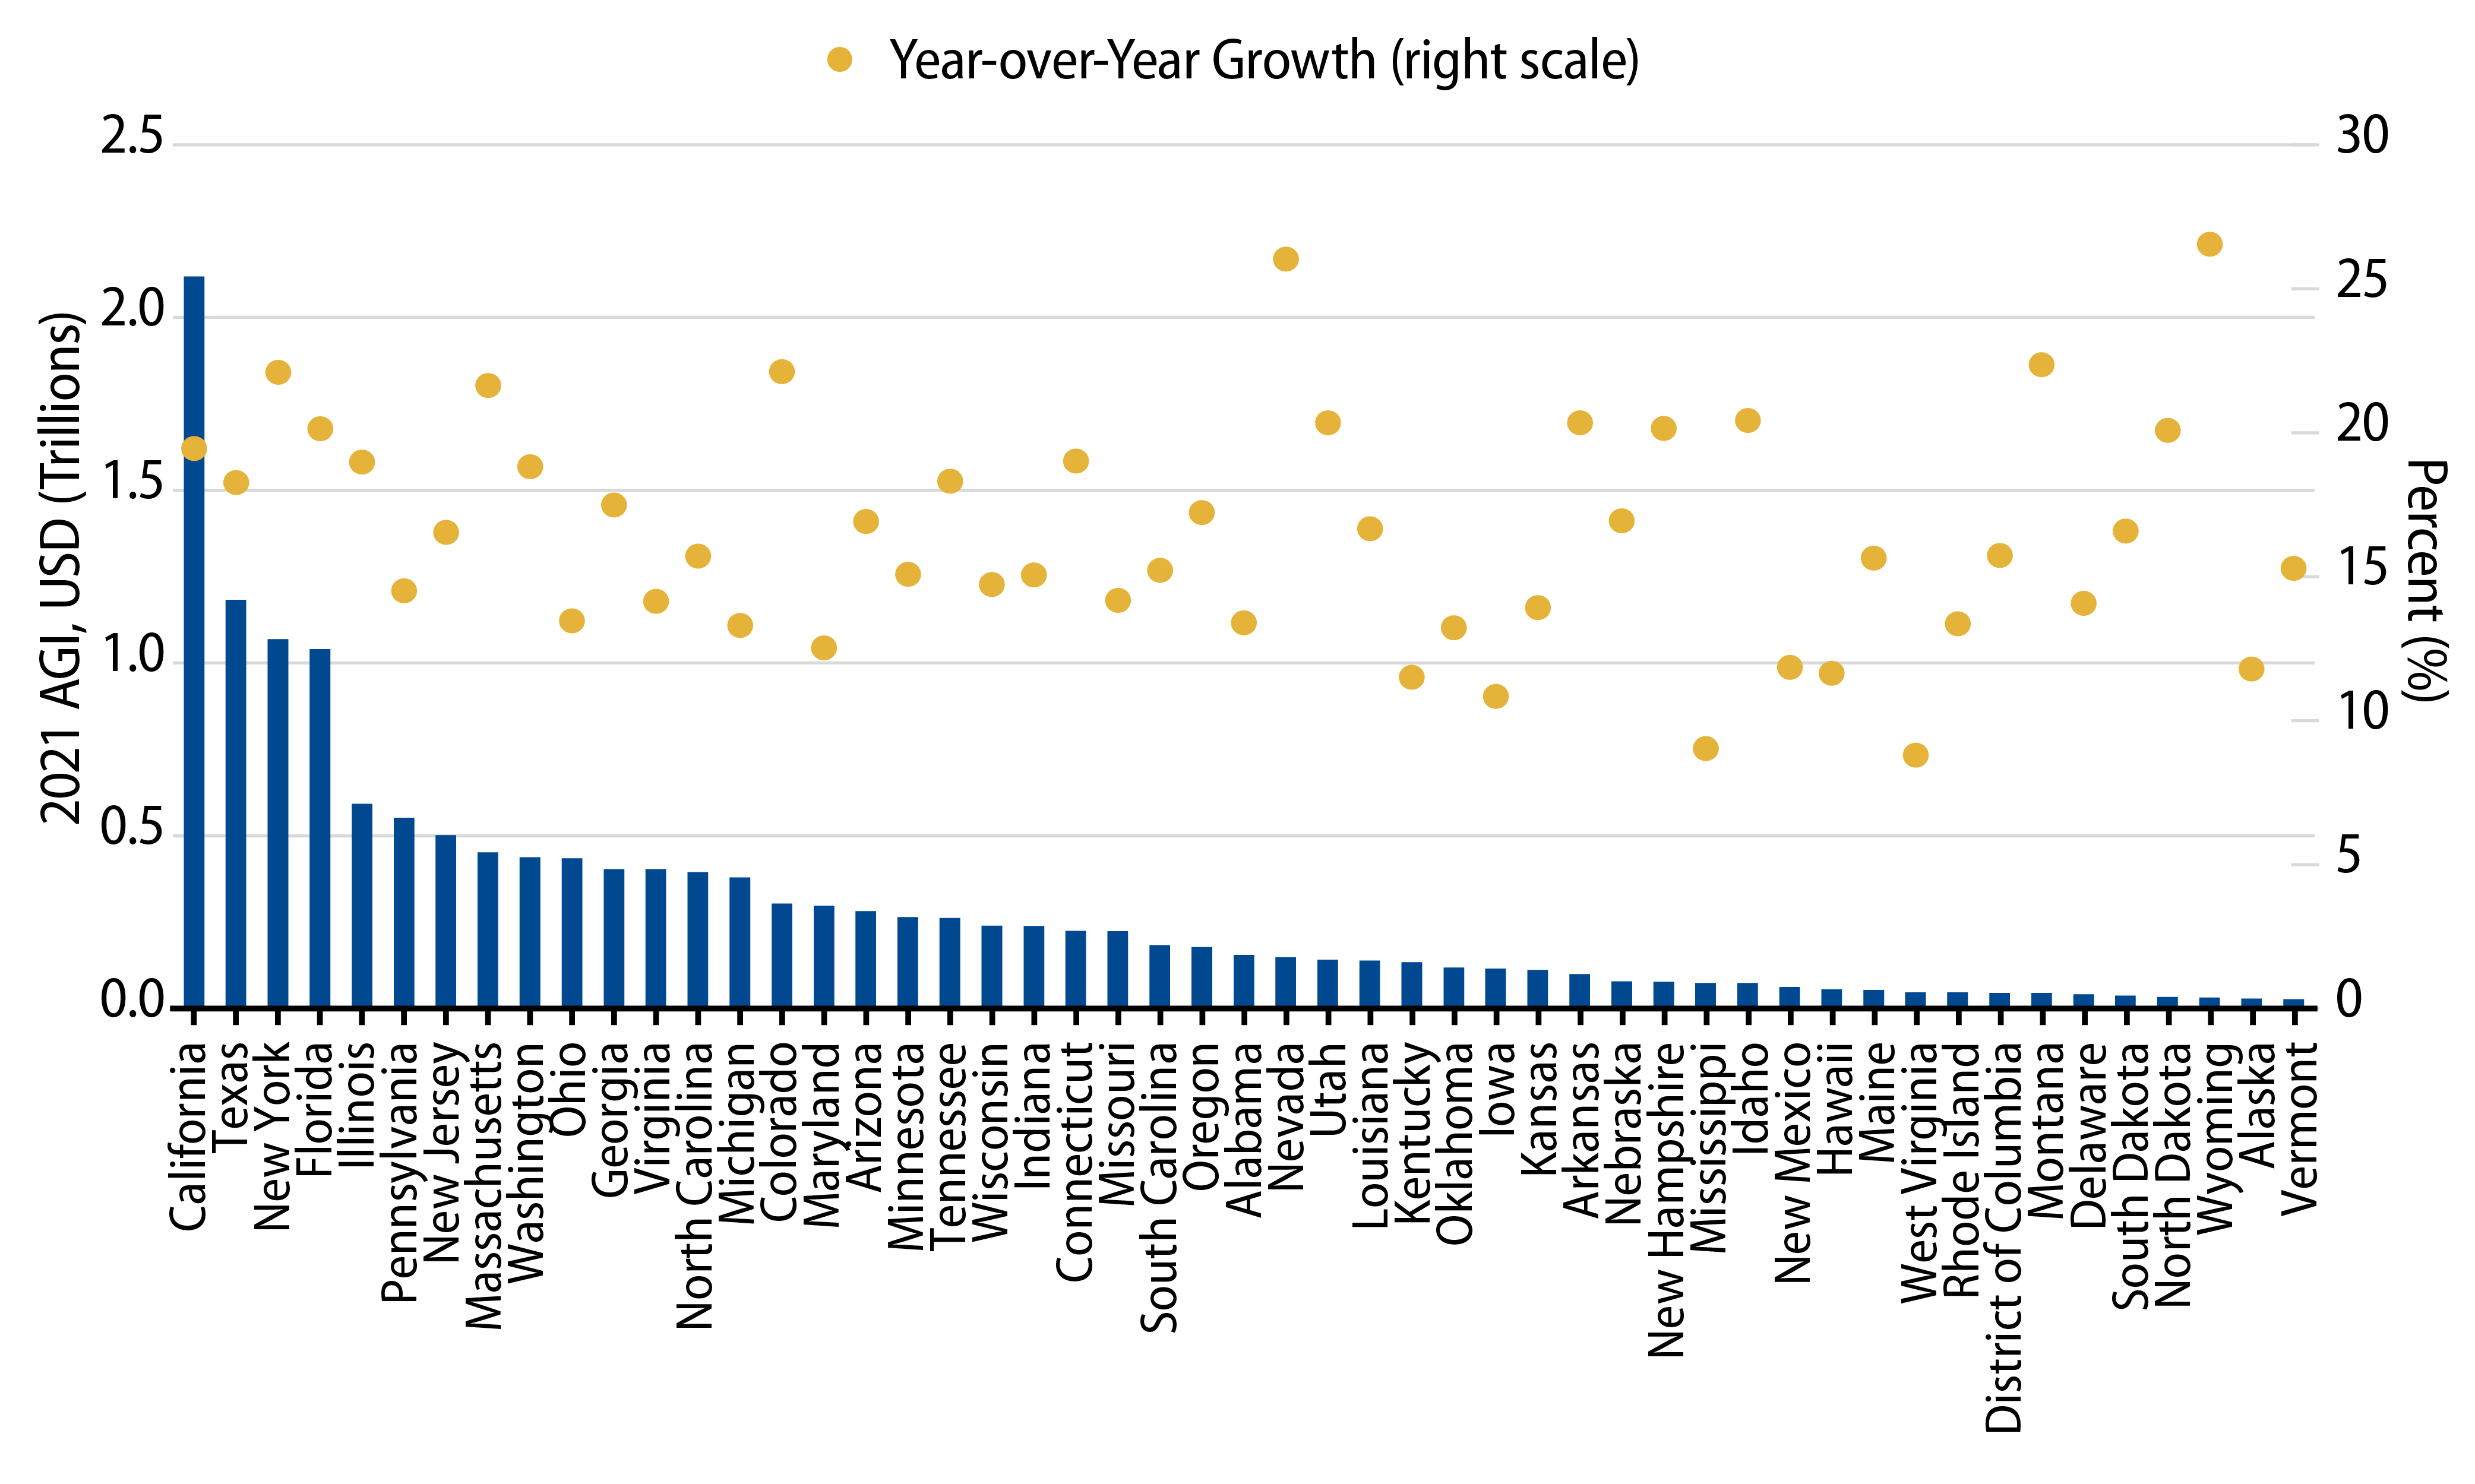
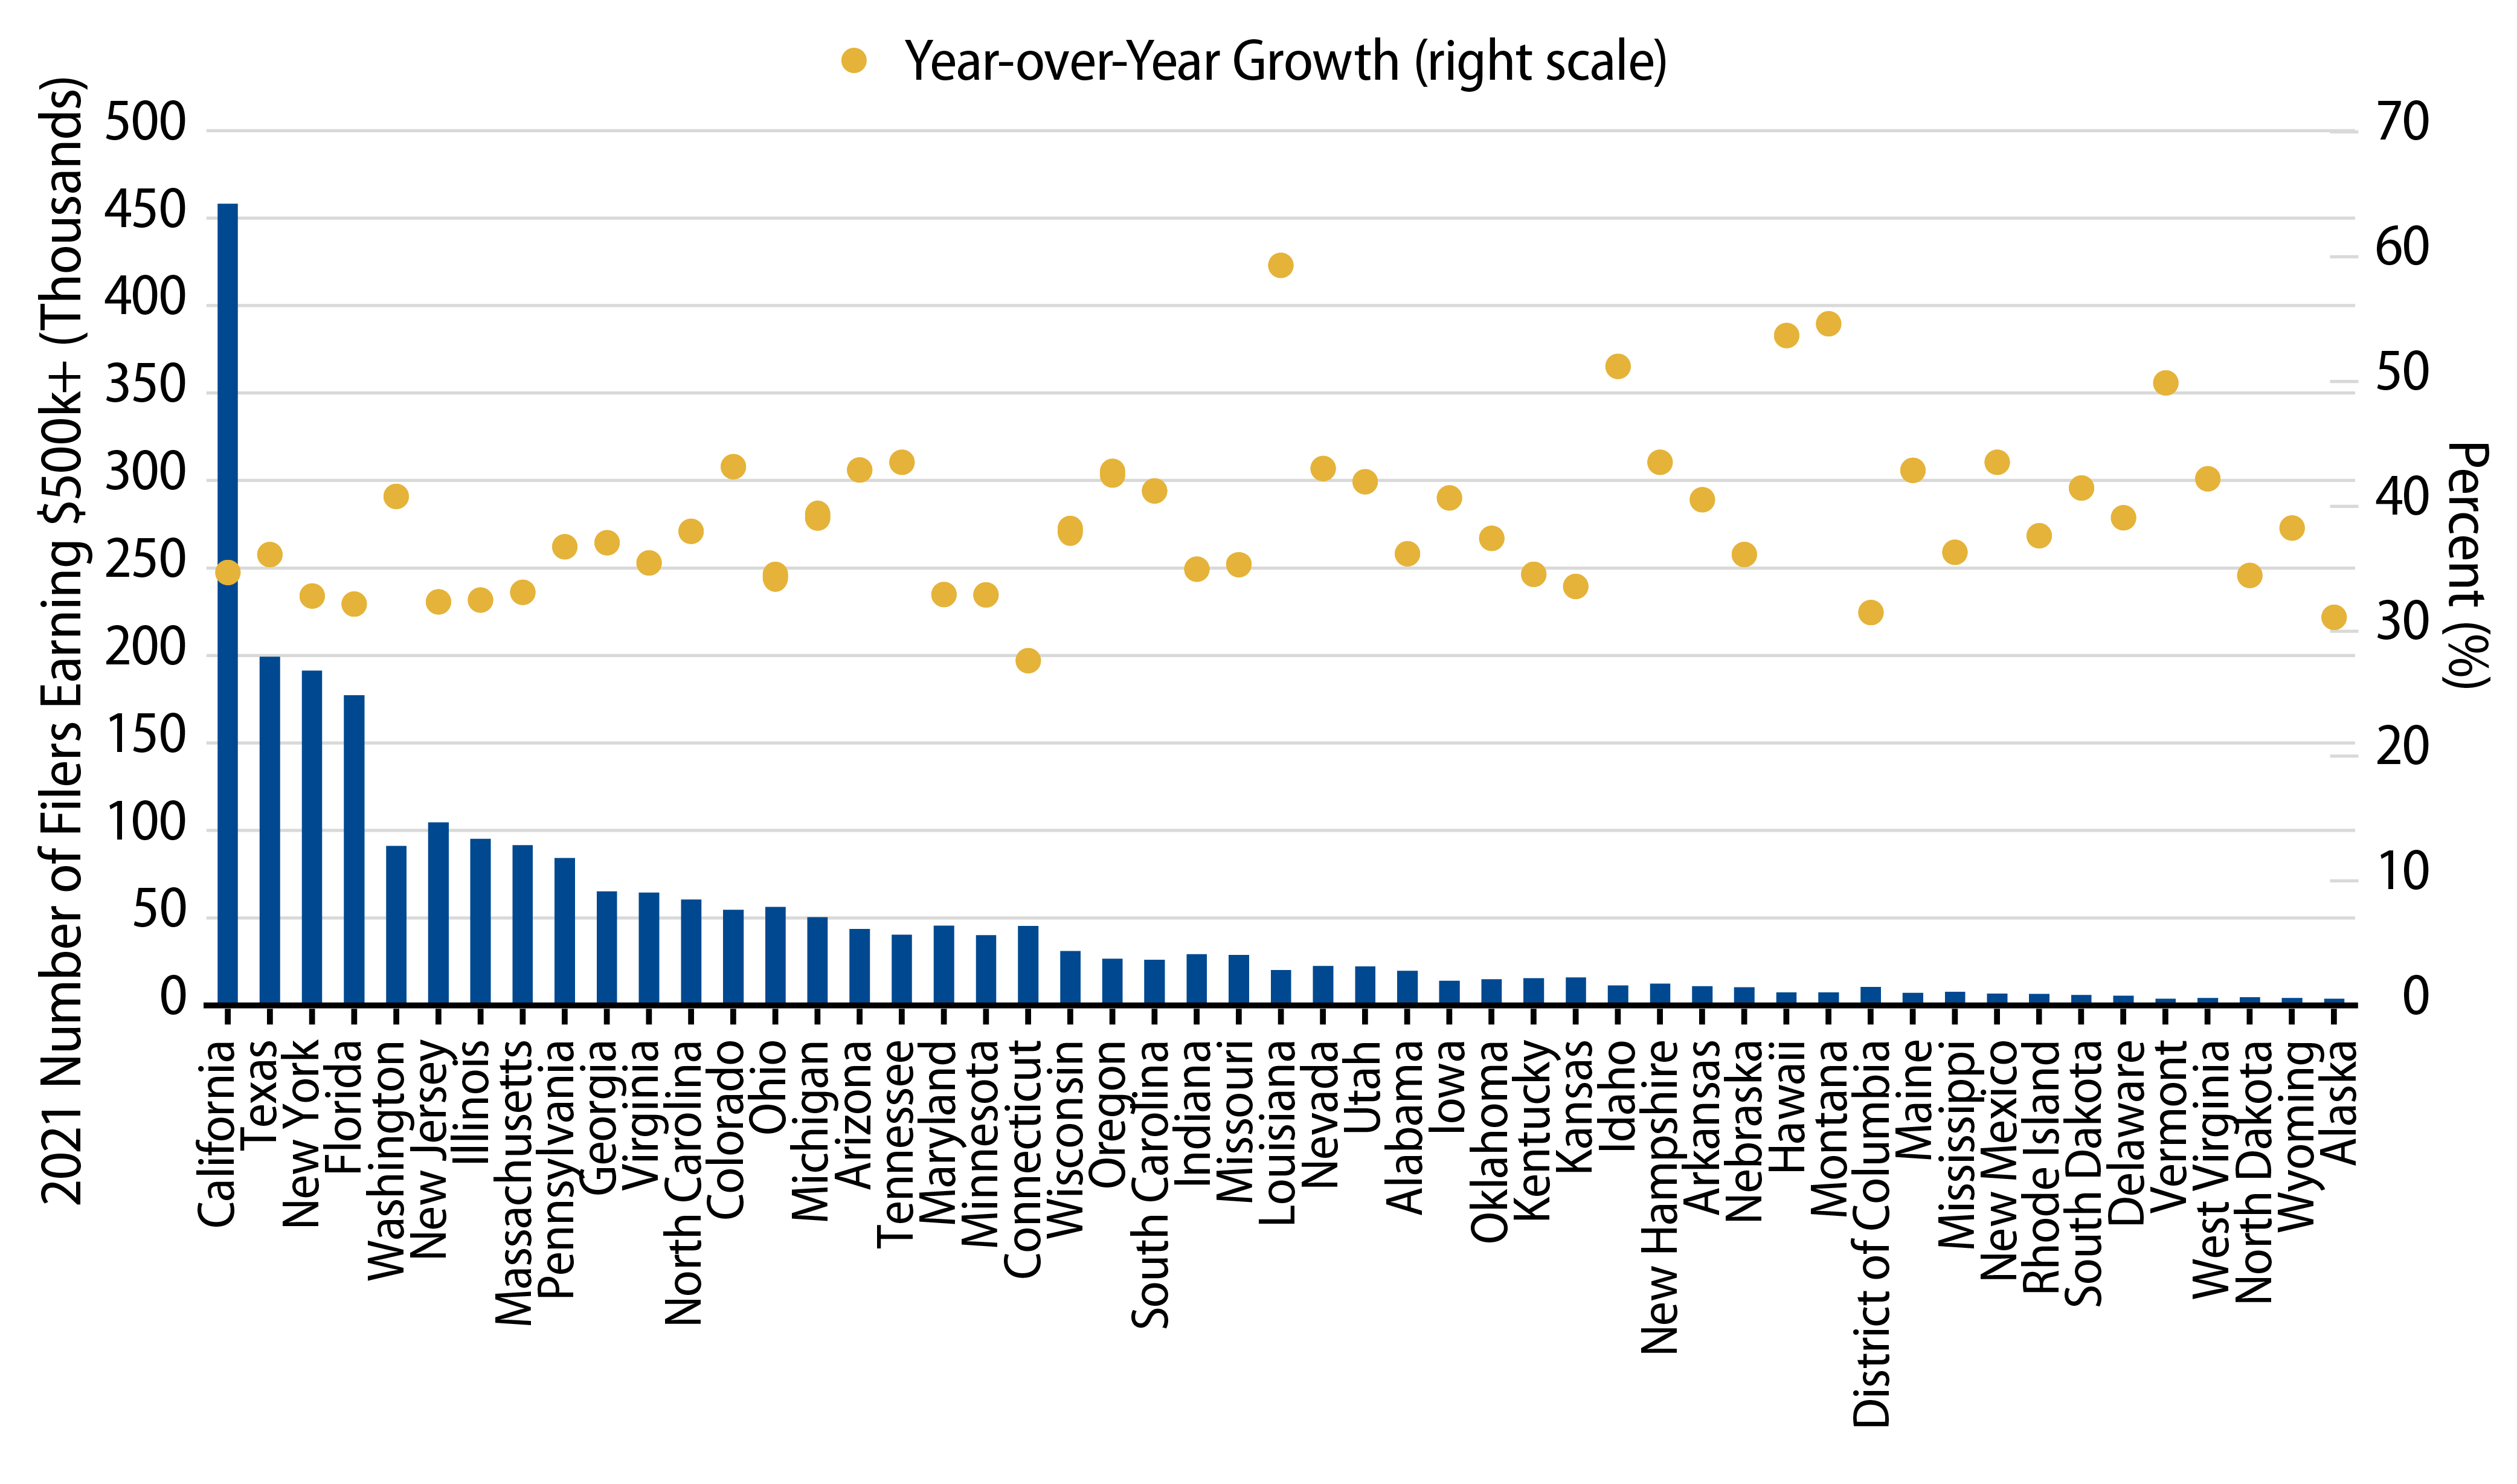
As economies continued to recover from the pandemic drawdowns and as the labor market strengthened, adjusted gross income (AGI) in the US increased $2.2 trillion in 2021 (or 17.7% YoY), marking the highest YoY increase in AGI over the past 20 years (Exhibit 1). AGI growth in 2021 was widespread across states, led by Wyoming (27%), Nevada (26%) and Montana (22%). New York, often maligned for domestic outmigration issues, recorded 22% growth in AGI, ranking fifth among states (Exhibit 2).

Exhibit 2: US Adjusted Gross Income (AGI) and YoY Growth by State
Explore US Adjusted Gross Income (AGI) and YoY Growth by State
Source: US Internal Revenue Service (IRS). IRS data for tax year 2021. As of 27 Feb 24. Select the image to expand the view.

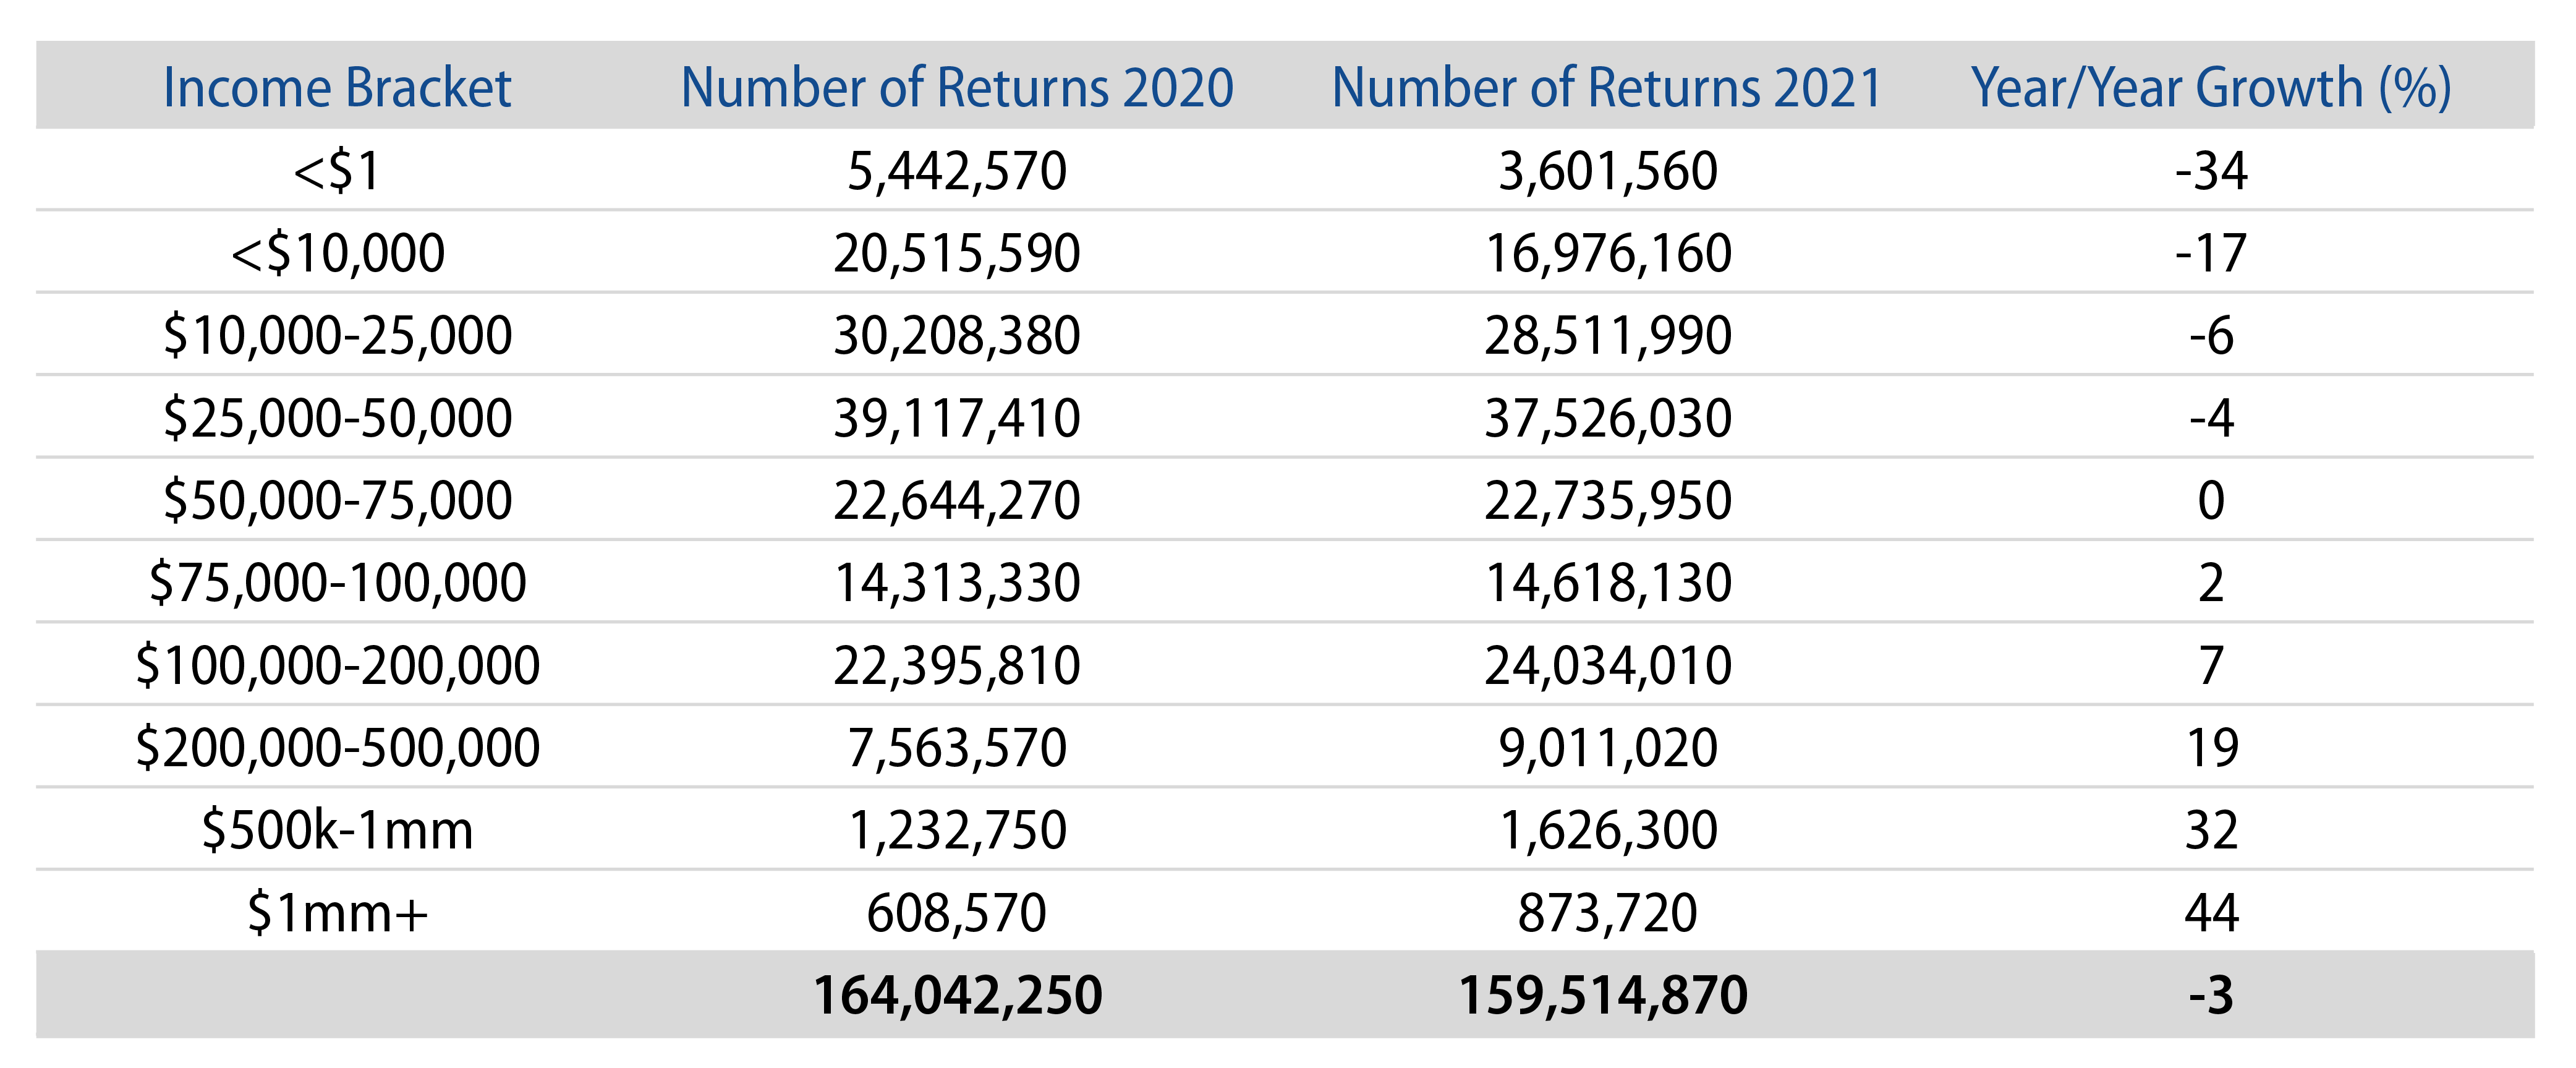
Improving overall wealth levels supported a decline of filers in the lowest marginal tax brackets and an increase in filers subject to higher tax rates. Filers with an annual AGI below $50,000 declined 4% to 34% across income cohorts. Meanwhile, filers with AGIs over $500,000, who benefit the most from the municipal tax exemption given relatively higher tax rates, increased 32% to 44%.

Exhibit 3: Number of Returns by Tax Bracket, 2020 vs. 2021
Explore Number of Returns by Tax Bracket, 2020 vs. 2021
Source: Western Asset. IRS data for tax years 2020 and 2021. As of 27 Feb 24. Select the image to expand the view.

Growth of high-income earners was widespread, similar to national trends. Louisiana (+59% YoY), Montana (+55%) and Hawaii (+54%), recorded the highest YoY growth rates of high-income filers. Meanwhile, California (+117,000 filers), Texas (+53,000 filers), and New York (+47,000 filers), recorded the strongest growth by number of filers.

Exhibit 4: Growth of High-Income Earners ($500k+) by State
Explore Growth of High-Income Earners ($500k+) by State
Source: Western Asset. IRS data for tax year 2021. As of 27 Feb 24. Select the image to expand the view.

Domestic migration and population trends across states often contribute to headlines that point to credit concerns for municipalities. However, population changes only consider a single component of a municipal tax base that can support tax revenues and credit quality. Wealth levels are a key driver of taxing power for state and local governments, and this IRS release is an example of recent strength that has supported recent record high tax collections and favorable municipal credit quality. As income trends and tax rates both move higher for many, Western Asset believes that municipals will offer value for a greater number of individuals going forward.

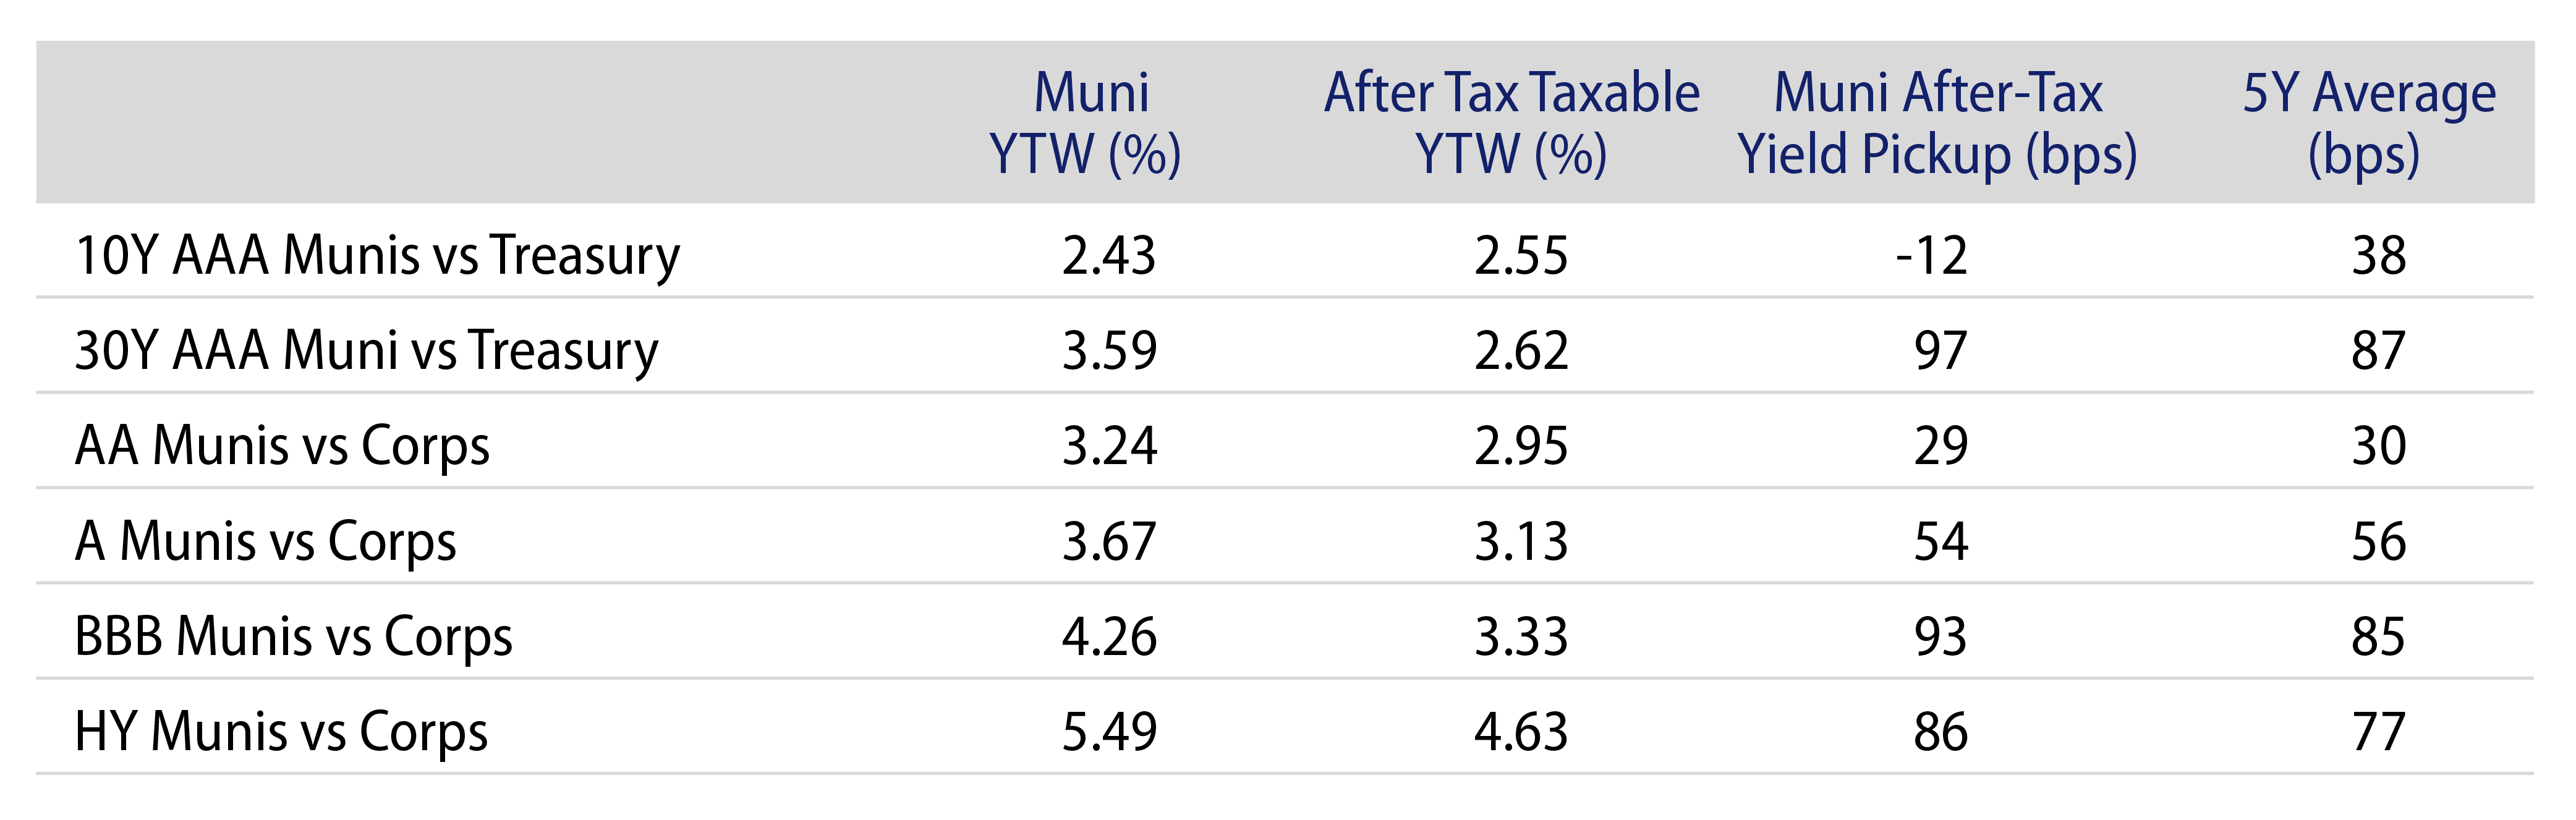
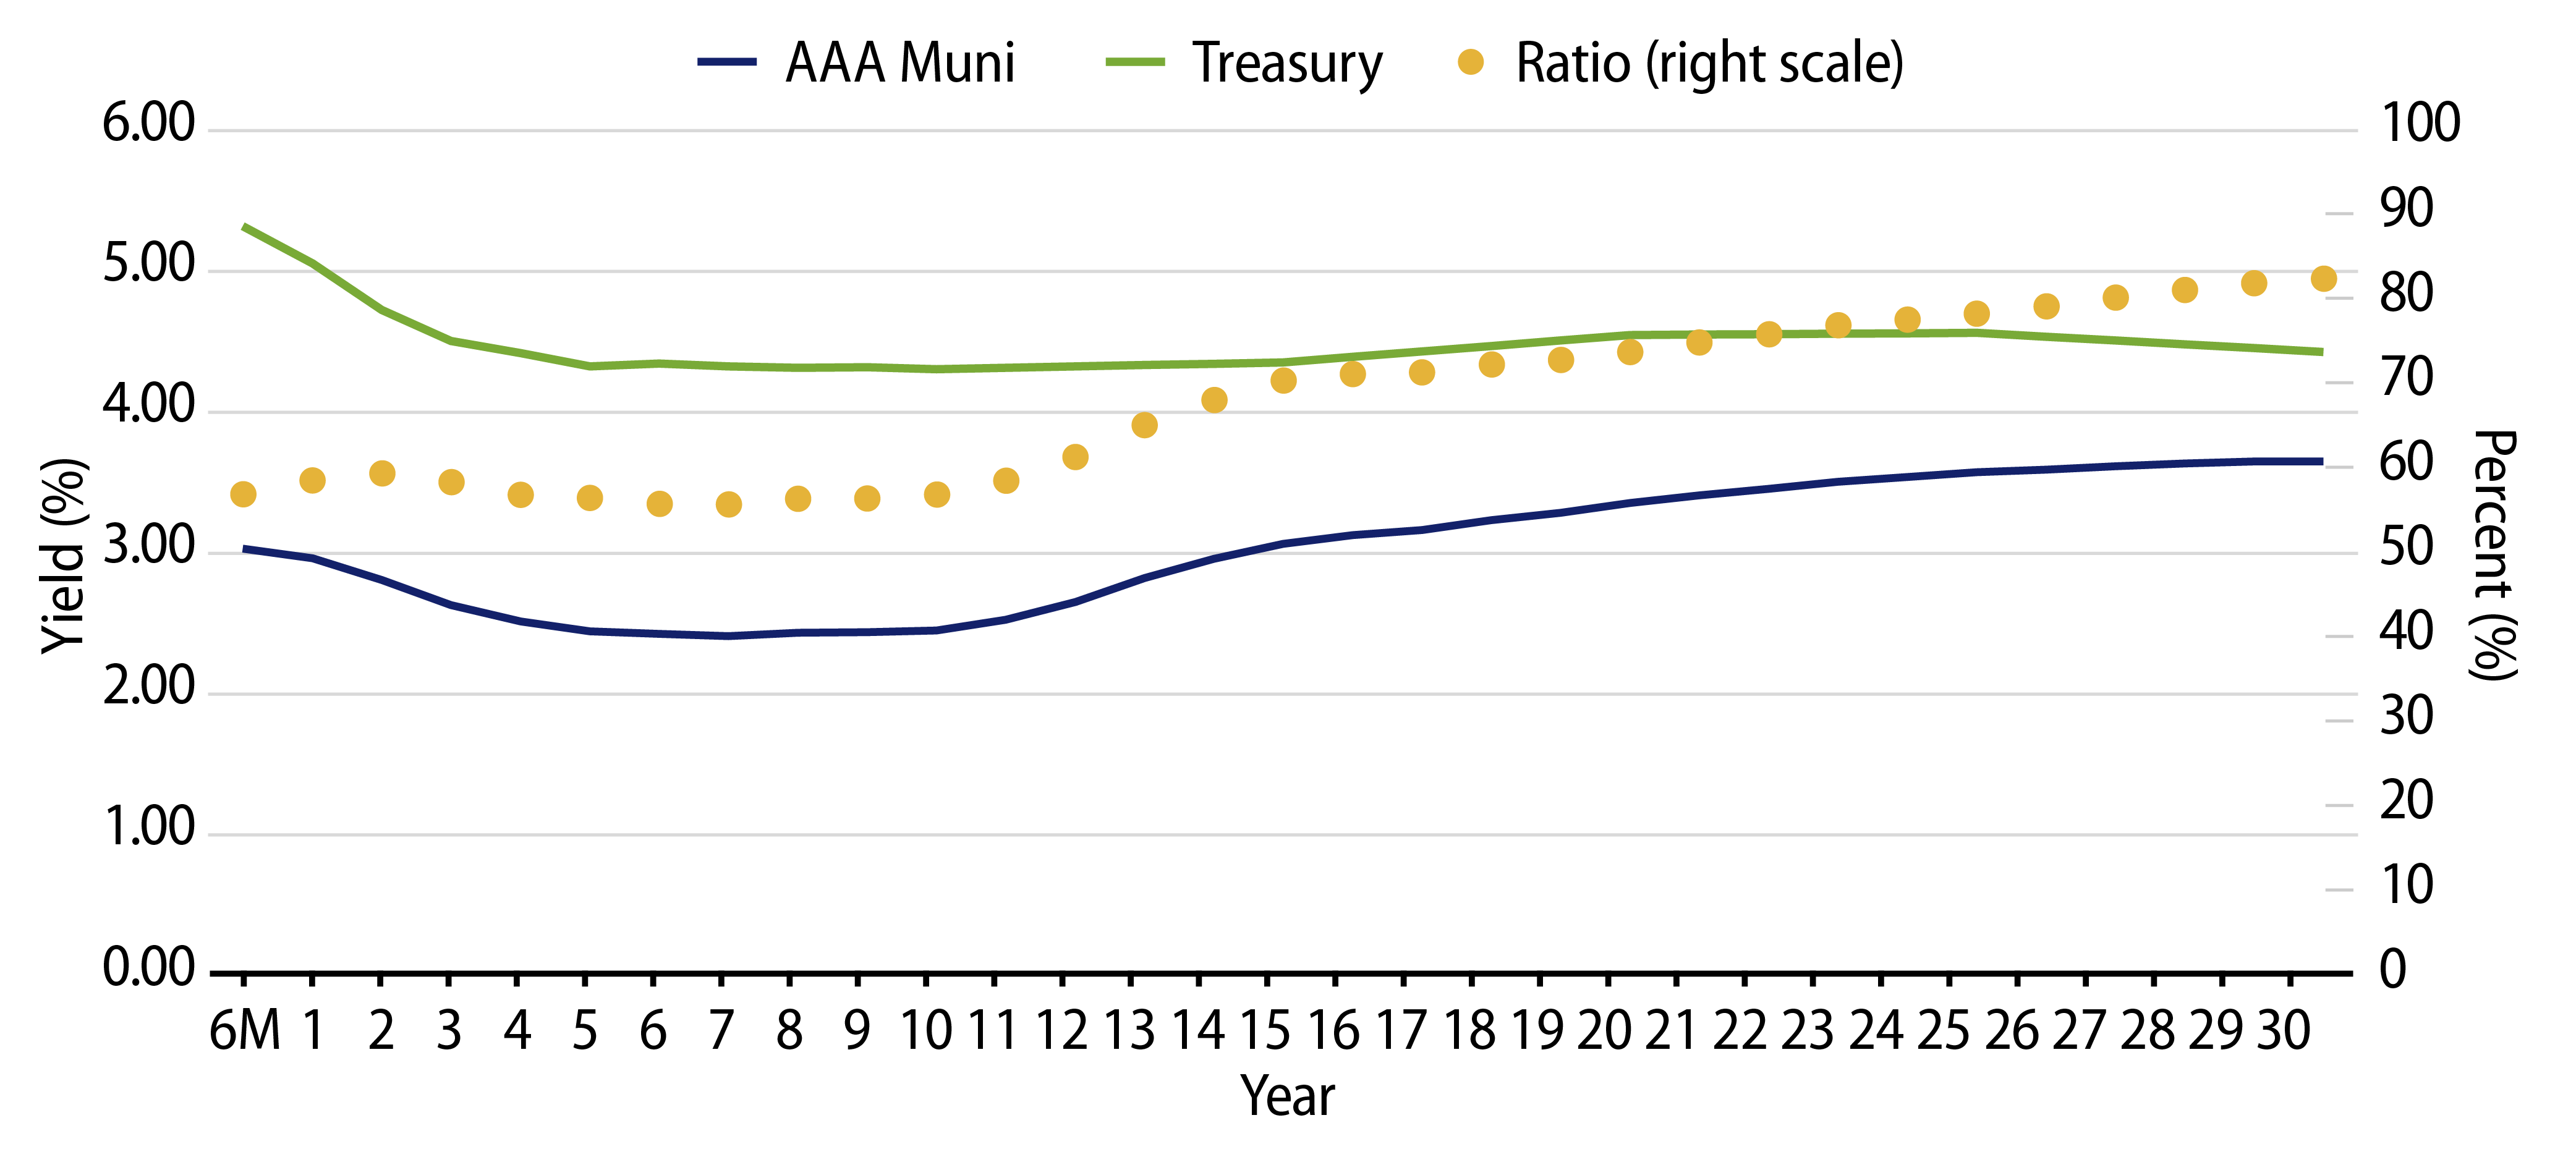
Municipal Credit Curves and Relative Value

Exhibit 5: Muni Credit Curves
Explore Muni Credit Curves
Source: Bloomberg, Western Asset. As of 15 Mar 24. Bloomberg BVAL Municipal Credit Indices (AAA, AA, A, BBB, respectively) and US Sovereign Curves. Taxable-Equivalent Muni Credit Curves consider the top marginal effective tax rate of 40.8%. Select the image to expand the view.
Exhibit 6: Taxable-Equivalent Muni Credit Curves
Explore Taxable-Equivalent Muni Credit Curves
Source: Bloomberg, Western Asset. As of 15 Mar 24. Bloomberg BVAL Municipal Credit Indices (AAA, AA, A, BBB, respectively) and US Sovereign Curves. Taxable-Equivalent Muni Credit Curves consider the top marginal effective tax rate of 40.8%. Select the image to expand the view.
Exhibit 7: AAA Munis versus Treasuries
Explore AAA Munis versus Treasuries
Source: Muni Yields: Thomson Reuters MMD, Treasury Yields: Bloomberg. As of 15 Mar 24. Past performance is not a guarantee of future results. It is not possible to invest directly in an Index. Select the image to expand the view.
Exhibit 8: Tax-Exempt and Taxable Muni Valuations
Explore Tax-Exempt and Taxable Muni Valuations
Source: Bloomberg. Yield-to-worst (YTW) is the lowest potential yield that can be received on a bond without the issuer actually defaulting. As of 15 Mar 24. Select the image to expand the view.

Western Asset Key Themes for Muni Investors

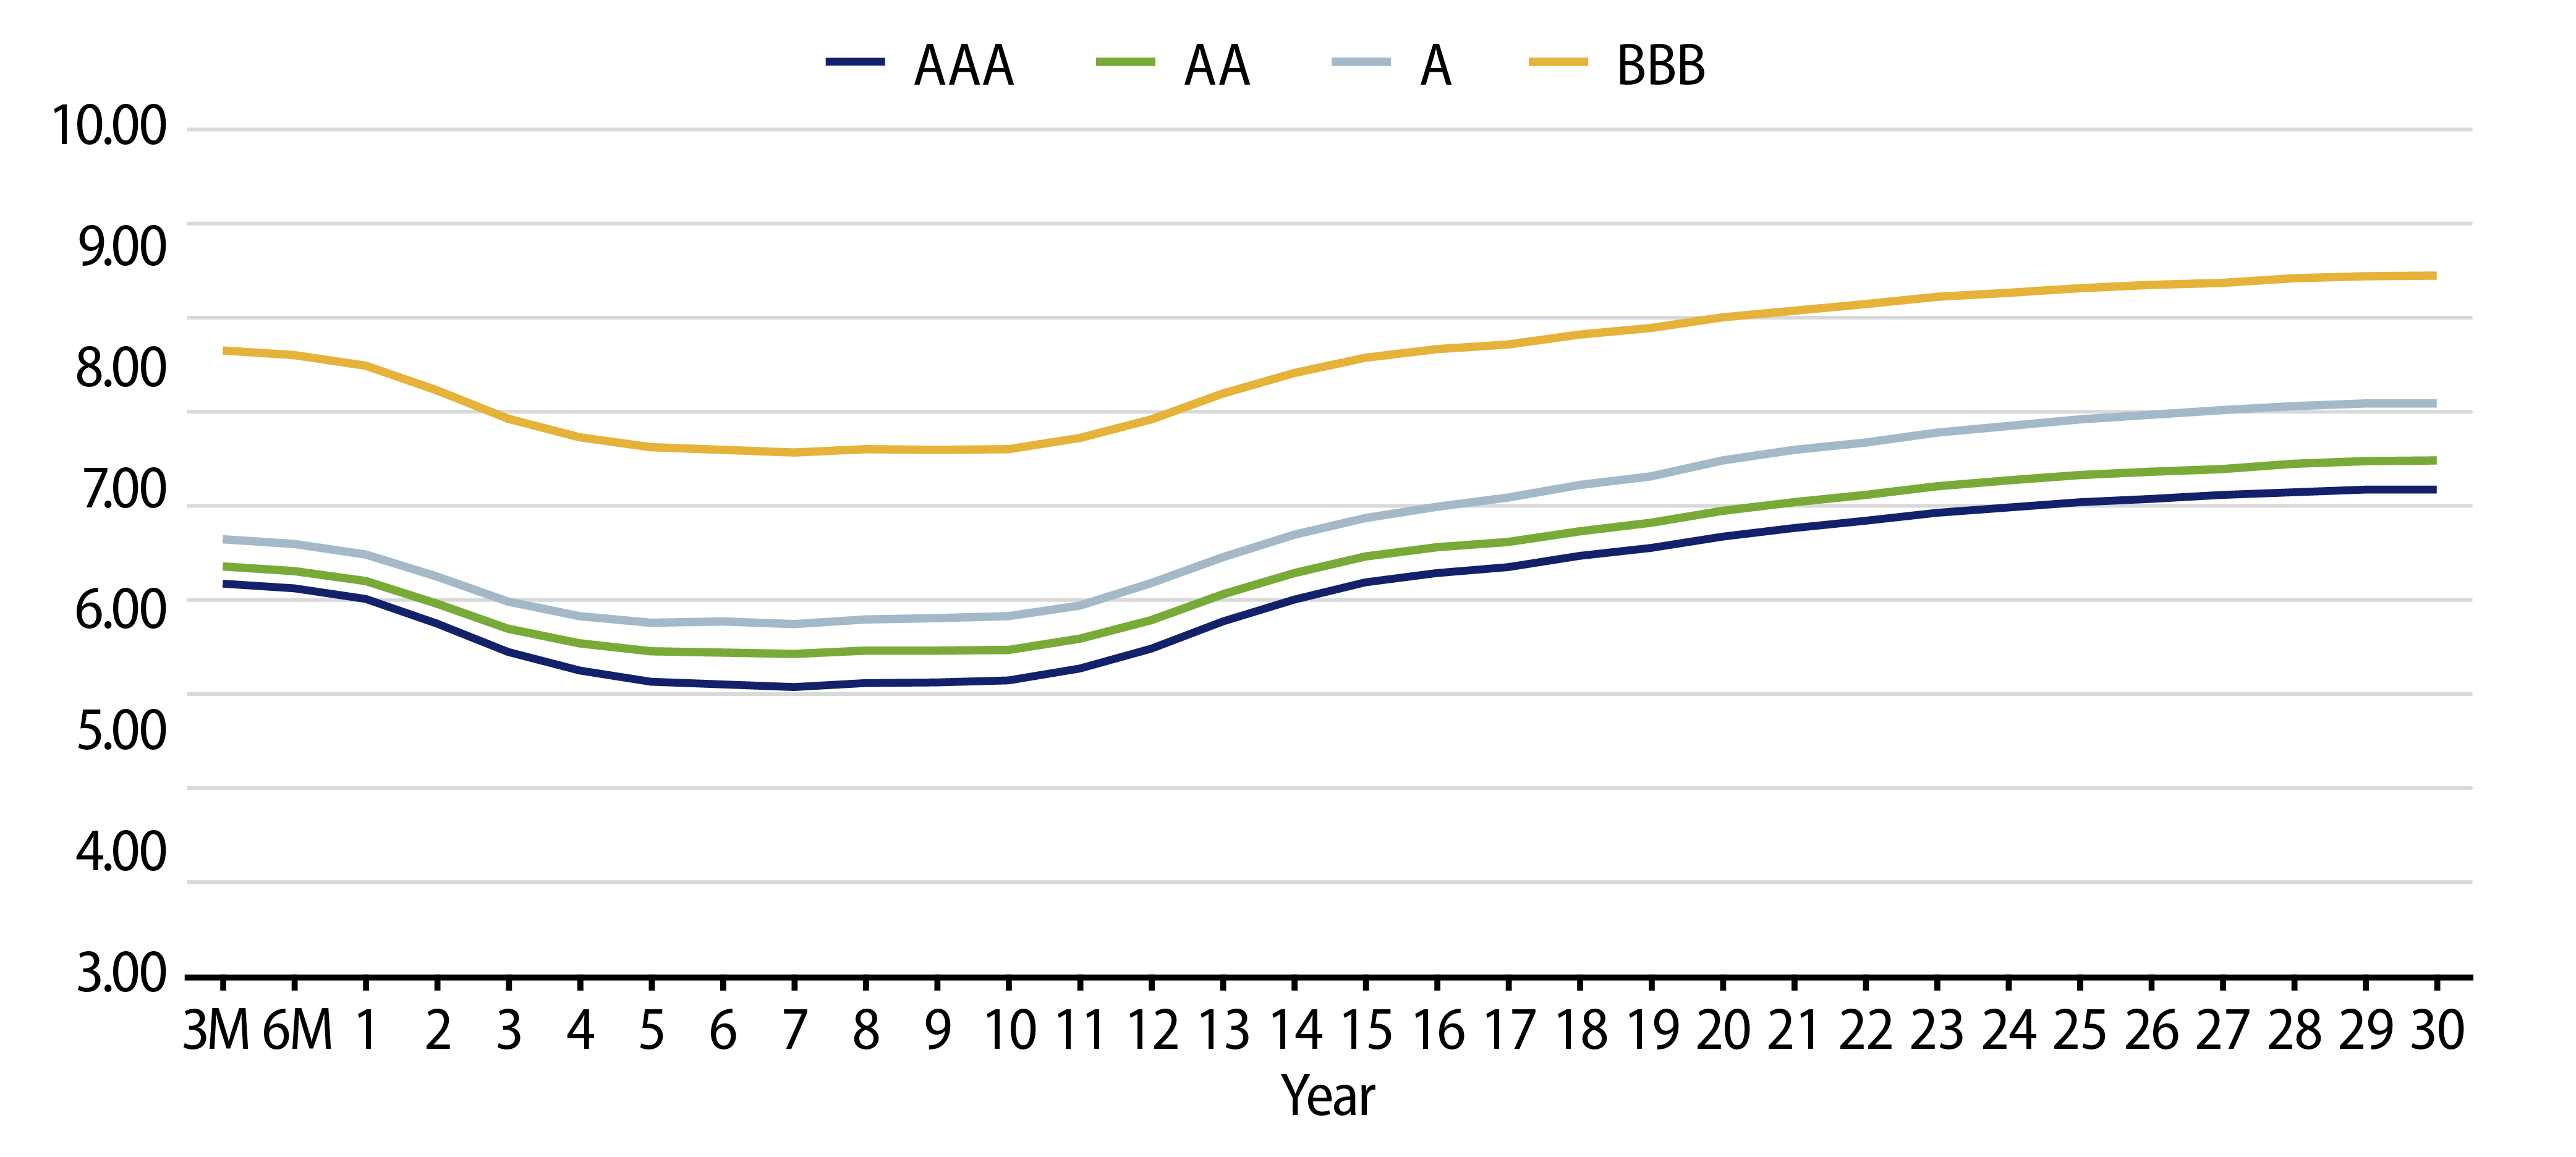
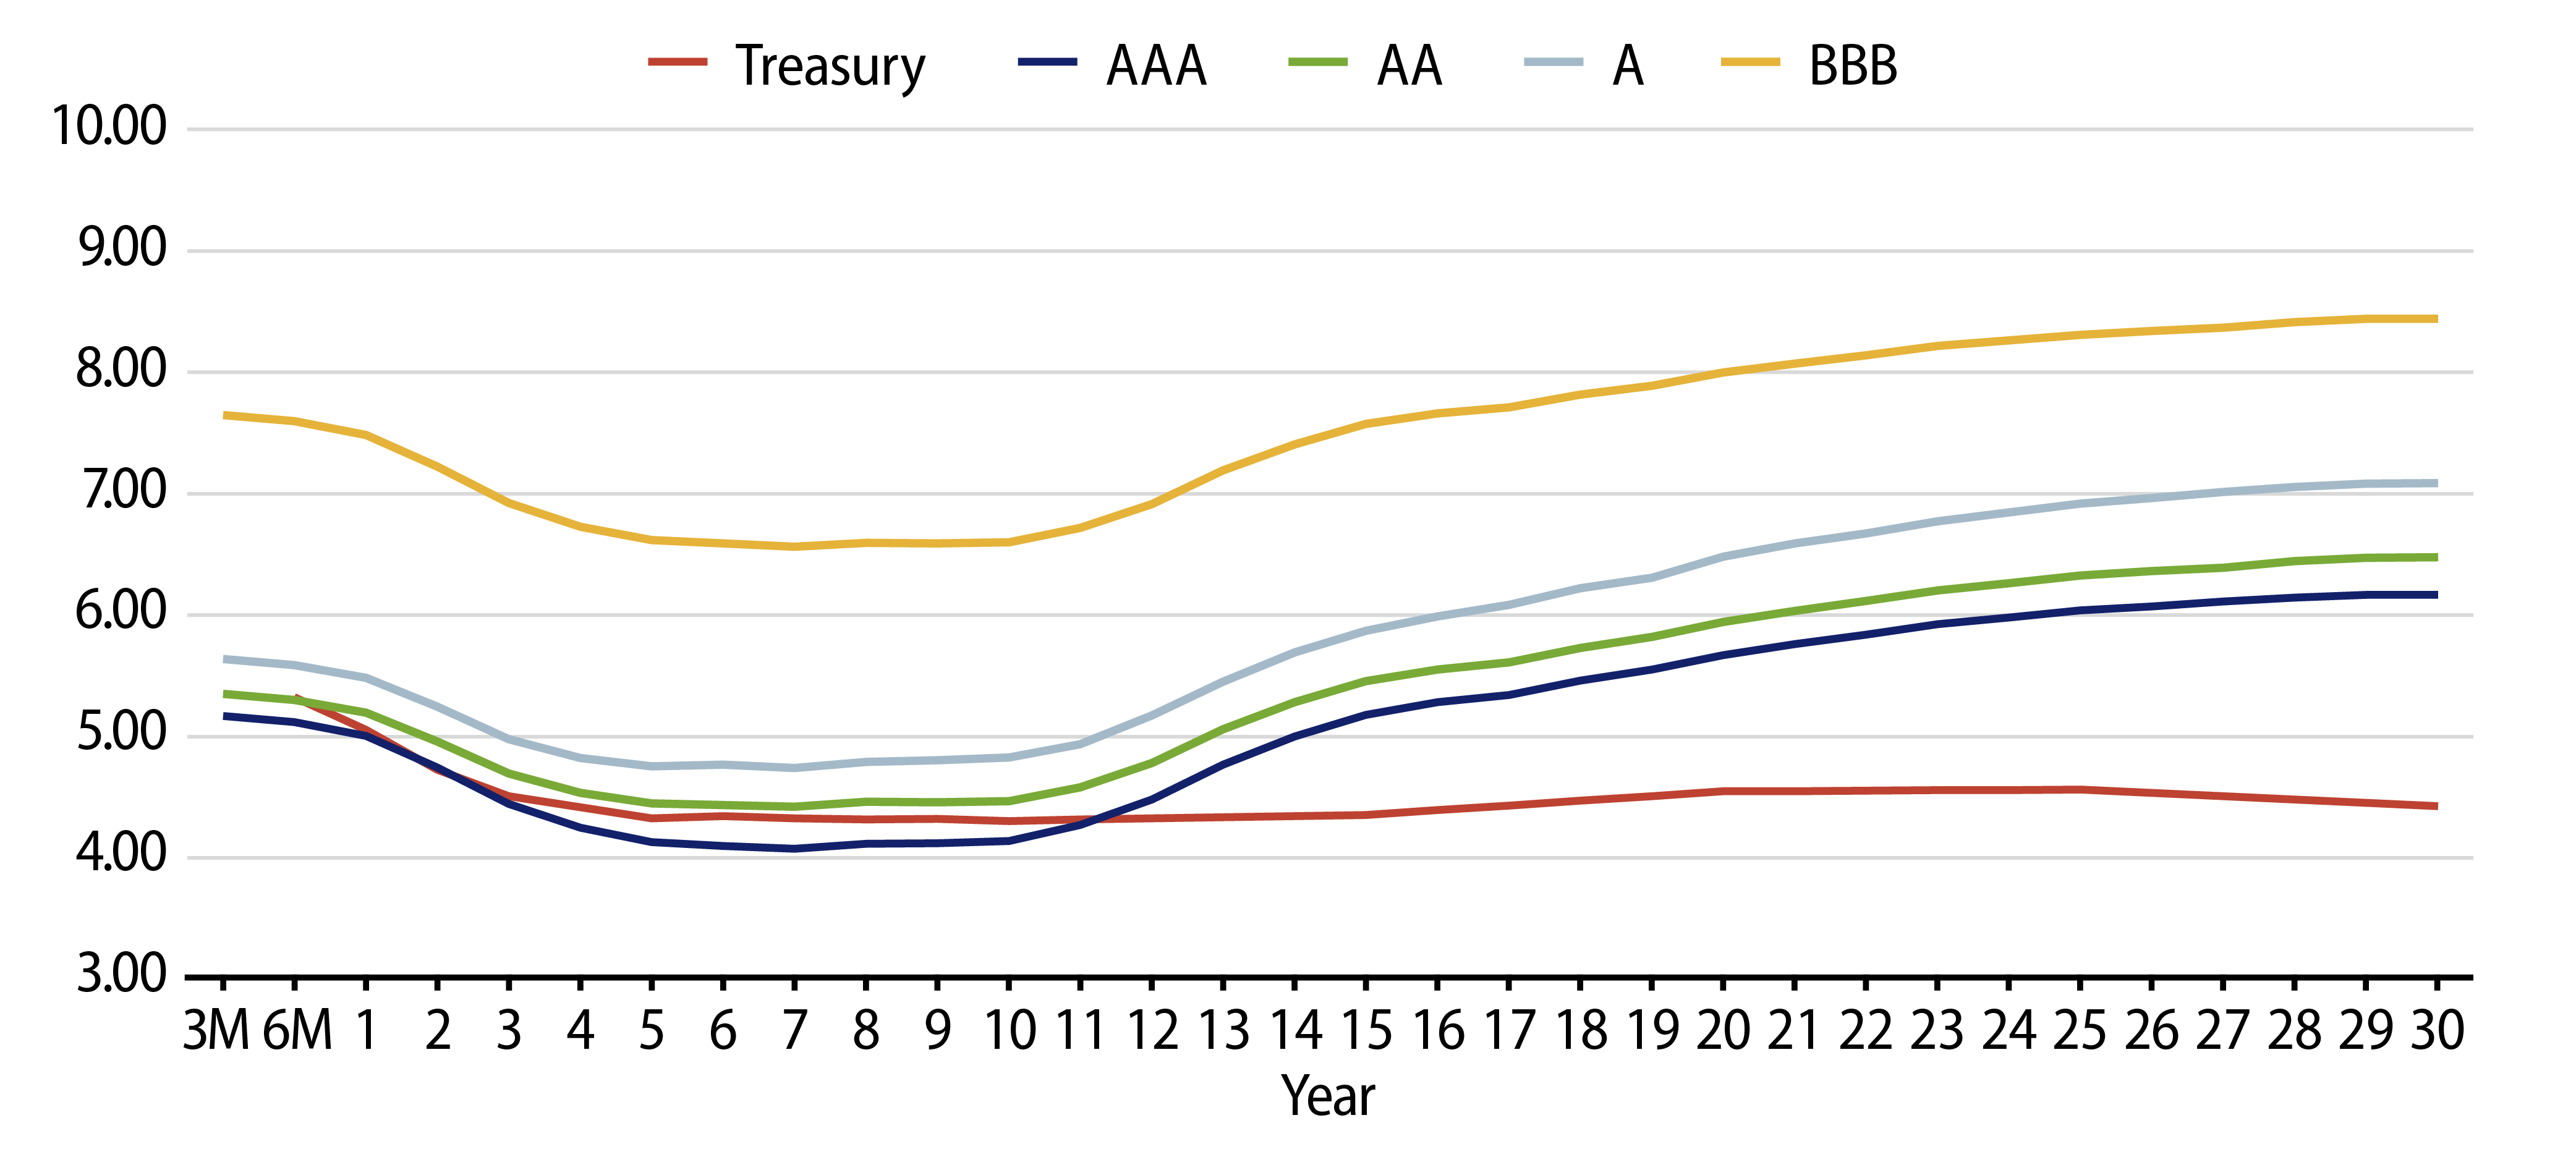
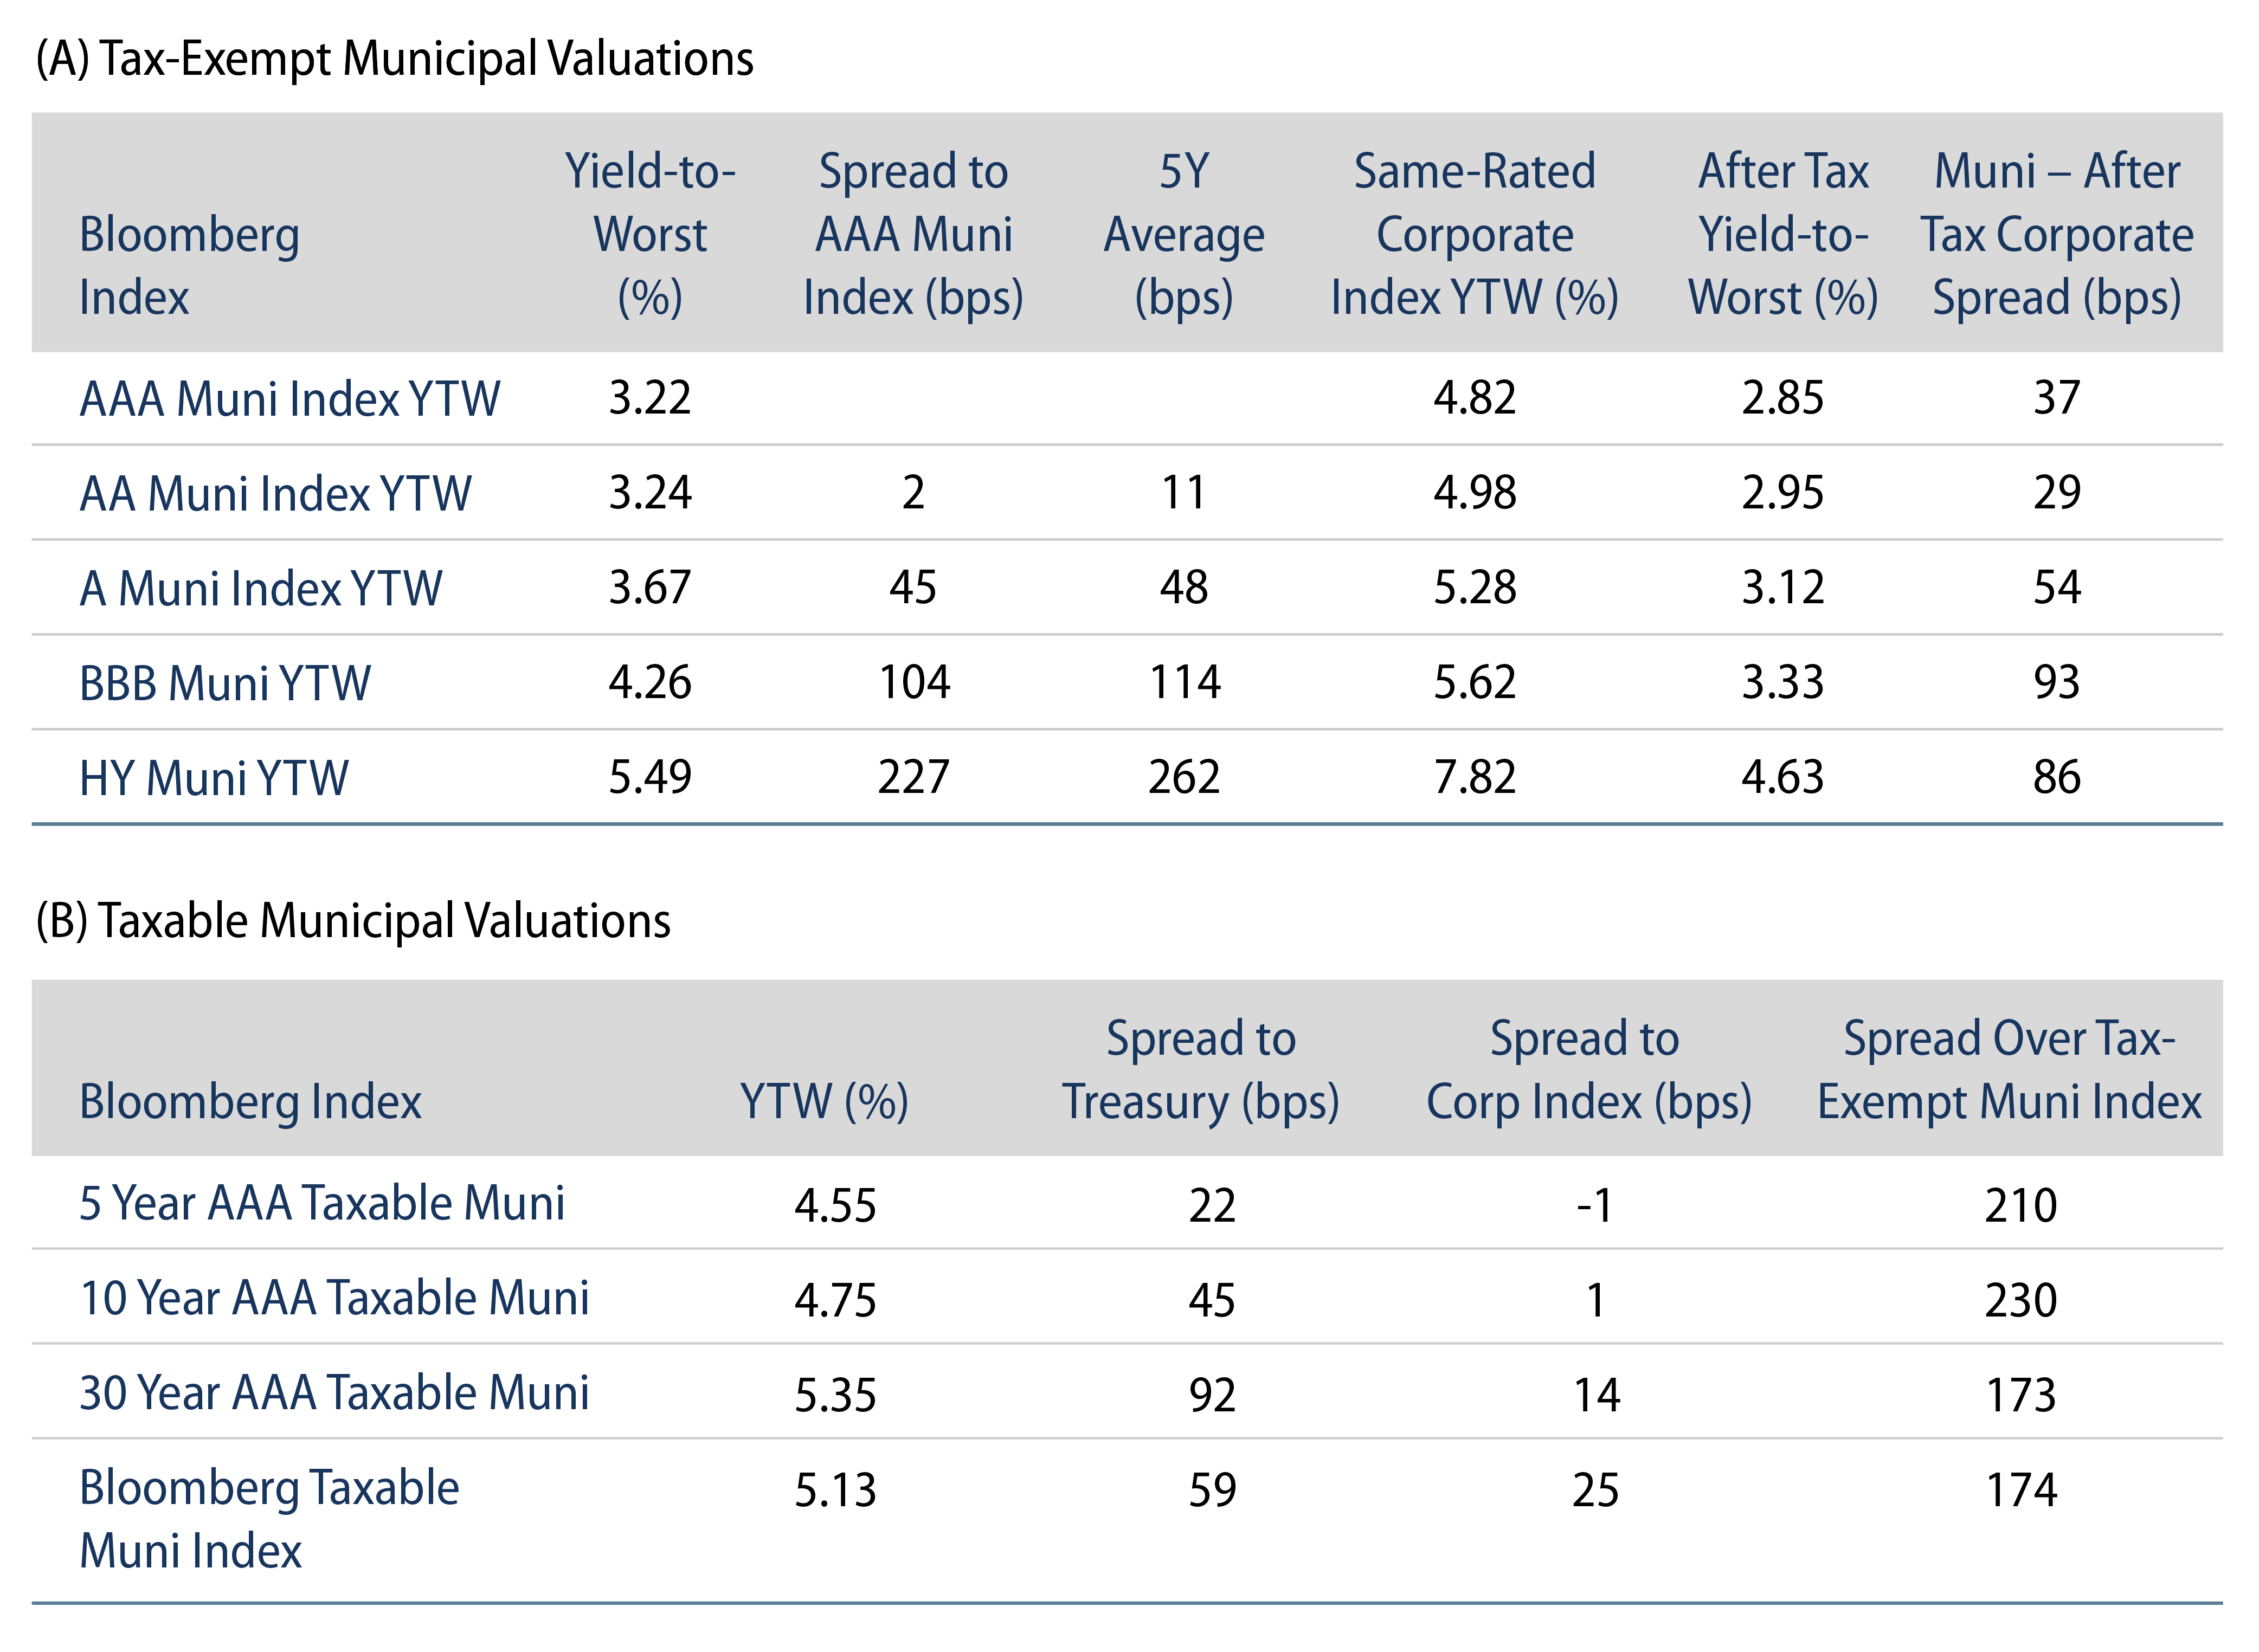
Theme #1: Municipal taxable-equivalent yields are above decade averages.

Exhibit 9: Muni and Taxable-Equivalent Muni Yield-to-Worst
Explore Muni and Taxable-Equivalent Muni Yield-to-Worst
Source: Bloomberg, Western Asset. As of 15 Mar 24. Bloomberg Municipal Bond Index Yield Considering Highest Marginal Tax Rate of 40.8%. Indexes are unmanaged and one cannot directly invest in them. They do not include fees, expenses or sales charges. Past performance is not an indicator or a guarantee of future results. Select the image to expand the view.

Theme #2: Recent yield-curve steepening has highlighted relative value in longer maturities.

Exhibit 10: AAA Municipal vs. Treasury Yield Curves
AAA Municipal vs. Treasury Yield Curves
Source: Bloomberg, Western Asset. As of 15 Mar 24. Bloomberg Valuation Service (BVAL) AAA Muni Curve and US On-/Off-the-Run Sovereign Curve. Indexes are unmanaged and one cannot directly invest in them. They do not include fees, expenses or sales charges. Past performance is not an indicator or a guarantee of future results. Select the image to expand the view.

Theme #3: Munis offer attractive after-tax yield pickup versus long Treasuries and corporate credit.

Exhibit 11: Municipal vs. Taxable Fixed-Income Yields by Quality
Explore Municipal vs. Taxable Fixed-Income Yields by Quality
Source: Western Asset, Bloomberg. As 08 Mar 24. 10- and 30-Year comparison reflects Bloomberg Valuation Service (BVAL) AAA Muni Curve and US On-/Off-the-Run Sovereign Curve. AA Muni reflects the Bloomberg AA Muni Bond Index. A Muni reflects the Bloomberg A Muni Bond Index. BBB Muni reflects the Bloomberg BBB Muni Bond Index. HY Muni reflects the Bloomberg High Yield Muni Bond Index. AA Corp reflects the Bloomberg AA Corporate Bond Index. A Corp reflects the Bloomberg A Corporate Bond Index. BBB Corp reflects the Bloomberg BBB Corporate Bond Index. After-tax yield considers top marginal tax rate of 40.8%. Indexes are unmanaged and one cannot directly invest in them. They do not include fees, expenses or sales charges. Past performance is not an indicator or a guarantee of future results. Select the image to expand the view.

© Western Asset Management Company, LLC 2024. The information contained in these materials ("the materials") is intended for the exclusive use of the designated recipient ("the recipient"). This information is proprietary and confidential and may contain commercially sensitive information, and may not be copied, reproduced or republished, in whole or in part, without the prior written consent of Western Asset Management Company ("Western Asset").
Past performance does not predict future returns. These materials should not be deemed to be a prediction or projection of future performance. These materials are intended for investment professionals including professional clients, eligible counterparties, and qualified investors only.
These materials have been produced for illustrative and informational purposes only. These materials contain Western Asset's opinions and beliefs as of the date designated on the materials; these views are subject to change and may not reflect real-time market developments and investment views.
Third party data may be used throughout the materials, and this data is believed to be accurate to the best of Western Asset's knowledge at the time of publication, but cannot be guaranteed. These materials may also contain strategy or product awards or rankings from independent third parties or industry publications which are based on unbiased quantitative and/or qualitative information determined independently by each third party or publication. In some cases, Western Asset may subscribe to these third party's standard industry services or publications. These standard subscriptions and services are available to all asset managers and do not influence rankings or awards in any way.
Investment strategies or products discussed herein may involve a high degree of risk, including the loss of some or all capital. Investments in any products or strategies described in these materials may be volatile, and investors should have the financial ability and willingness to accept such risks.
Unless otherwise noted, investment performance contained in these materials is reflective of a strategy composite. All other strategy data and information included in these materials reflects a representative portfolio which is an account in the composite that Western Asset believes most closely reflects the current portfolio management style of the strategy. Performance is not a consideration in the selection of the representative portfolio. The characteristics of the representative portfolio shown may differ from other accounts in the composite. Information regarding the representative portfolio and the other accounts in the composite are available upon request. Statements in these materials should not be considered investment advice. References, either general or specific, to securities and/or issuers in the materials are for illustrative purposes only and are not intended to be, and should not be interpreted as, recommendation to purchase or sell such securities. Employees and/or clients of Western Asset may have a position in the securities or issuers mentioned.
These materials are not intended to provide, and should not be relied on for, accounting, legal, tax, investment or other advice. The recipient should consult its own counsel, accountant, investment, tax, and any other advisers for this advice, including economic risks and merits, related to making an investment with Western Asset. The recipient is responsible for observing the applicable laws and regulations of their country of residence.
Founded in 1971, Western Asset Management Company is a global fixed-income investment manager with offices in Pasadena, New York, London, Singapore, Tokyo, Melbourne, São Paulo, Hong Kong, and Zürich. Western Asset is a wholly owned subsidiary of Franklin Resources, Inc. but operates autonomously. Western Asset is comprised of six legal entities across the globe, each with distinct regional registrations: Western Asset Management Company, LLC, a registered Investment Adviser with the Securities and Exchange Commission; Western Asset Management Company Distribuidora de Títulos e Valores Mobiliários Limitada is authorized and regulated by Comissão de Valores Mobiliários and Brazilian Central Bank; Western Asset Management Company Pty Ltd ABN 41 117 767 923 is the holder of the Australian Financial Services License 303160; Western Asset Management Company Pte. Ltd. Co. Reg. No. 200007692R is a holder of a Capital Markets Services License for fund management and regulated by the Monetary Authority of Singapore; Western Asset Management Company Ltd, a registered Financial Instruments Business Operator and regulated by the Financial Services Agency of Japan; and Western Asset Management Company Limited is authorised and regulated by the Financial Conduct Authority ("FCA") (FRN 145930). This communication is intended for distribution to Professional Clients only if deemed to be a financial promotion in the UK as defined by the FCA. This communication may also be intended for certain EEA countries where Western Asset has been granted permission to do so. For the current list of the approved EEA countries please contact Western Asset at +44 (0)20 7422 3000.