skip navigation
Blog

Stay up to date on timely topics and market events. Subscribe to our Blog now.

MARKETS
03 December 2024

Weekly Municipal Monitor—Supply Slows in November

By Sam Weitzman

Stay up to date on timely topics and market events. Subscribe to our Blog now.

Macros, Markets and Munis

Munis posted positive returns last week as fixed-income yields moved lower, although they trailed Treasuries and underperformed partly due to an under-reaction to the rate selloff earlier in the month. This occurred against the backdrop of President Trump’s selection of Scott Bessent as Treasury Secretary, an appointment viewed favorably by fixed-income markets as it allayed fears of unchecked fiscal expansion. Economic data, including jobless claims, 3Q24 GDP and inflation, were reported in line with expectations and remained relatively unchanged from prior readings. Meanwhile, muni technicals remained favorable amid limited supply and continued inflows. This week we highlight November’s muni supply slowdown.

Muni Supply Levels Remained Elevated as Fund Inflows Continued

Fund Flows (up $561 million): During the week ending November 27, weekly reporting municipal mutual funds recorded $561 million of net inflows, according to Lipper. Long-term funds recorded $657 million of inflows, intermediate funds recorded $123 million of outflows and high-yield funds recorded $301 million of inflows. This week’s inflows marked the 22nd consecutive week of inflows and led estimated year-to-date (YTD) net inflows higher to $40 billion.

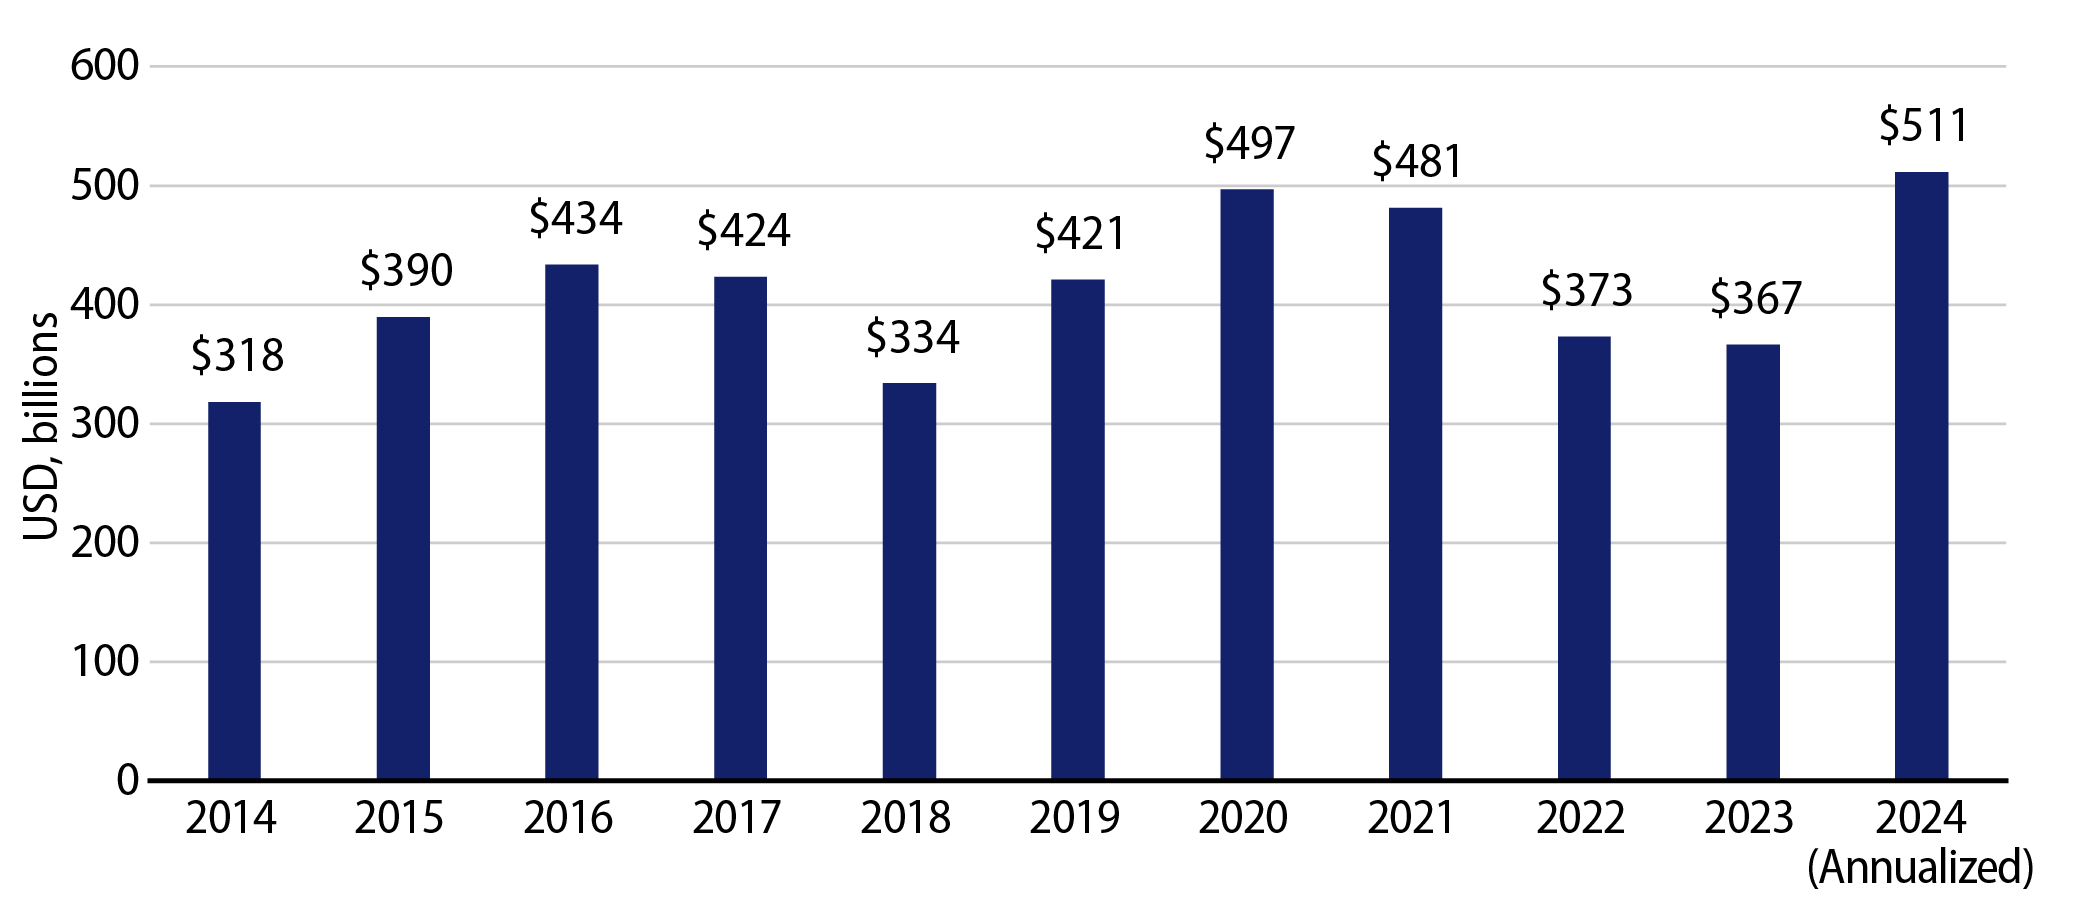
Supply (YTD supply of $468 billion, up 40% YoY): The muni market recorded just $2 billion of new-issue volume last week due to the Thanksgiving holiday. YTD issuance of $468 billion is 40% higher than last year’s level, with tax-exempt issuance 43% higher and taxable issuance 11% higher year-over-year (YoY). This week’s calendar is expected to jump to an elevated $16 billion. The largest deals include $1.5 billion New Jersey Transportation Trust and $767 million State of Connecticut General Obligation transactions.

This Week in Munis: Supply Slows in November

Entering November, YTD municipal supply reached a record pace with total municipal supply of $444 billion representing the highest level of supply recorded through the first 10 months of a calendar year in the muni market’s history. Due to the election, along with the Veterans Day and Thanksgiving holidays, supply has slowed in November as $25 billion of issuance represented the lowest supply level of the year and declined 30% from November 2023 levels.

Exhibit 1: 2024 Municipal Supply (vs. YoY Growth)
2024 Municipal Supply (vs. YoY Growth)
Source: Bloomberg, Western Asset. As of 29 Nov 24. Select the image to expand the view.

While elevated supply conditions contributed to municipal underperformance versus other fixed-income asset classes throughout much of 2024, stronger supply technicals along with steady municipal fund flows have supported relative outperformance in November. The Bloomberg Municipal Bond Index returned 1.73% in November, outperforming the Bloomberg Treasury (0.78%) and Bloomberg Corporate (1.34%) indices.

Despite the November slowdown, 2024 supply remains elevated and has been supportive of tax-exempt income opportunities and relative valuations. However, strong November technicals and muni outperformance underscore potential reinvestment risk associated with lower supply and higher demand that could quickly appear in the municipal market. Western Asset anticipates that the 2025 municipal bond supply will remain elevated due to domestic infrastructure needs, but these elevated supply conditions should be well absorbed by demand from individuals seeking higher after-tax income opportunities as the Federal Reserve continues to cut rates. Should supply underperform expectations, persistent demand could lead to additional muni outperformance that could limit future income opportunities, further supporting the entry point offered by attractive municipal valuations today.

Exhibit 2: Annual Municipal Supply
Annual Municipal Supply
Source: Bloomberg, Western Asset. As of 29 Nov 24. Select the image to expand the view.

Municipal Credit Curves and Relative Value

Exhibit 3: Muni Credit Curves
Muni Credit Curves
Source: Bloomberg, Western Asset. As of 29 Nov 24. Bloomberg Valuation Service (BVAL) Municipal Credit Indices (AAA, AA, A, BBB, respectively) and US Sovereign Curves. Taxable-Equivalent Muni Credit Curves consider the top marginal effective tax rate of 40.8%. AA Muni is represented by the US General Obligation AA Muni BVAL Yield Curve. The BVAL curve is populated with pricing from uninsured AA General Obligation bonds. A Muni is represented by the US General Obligation A Muni BVAL Yield Curve. The BVAL curve is populated with pricing from uninsured A General Obligation bonds. BBB Muni is represented by the US General Obligation BBB Muni BVAL Yield Curve. The BVAL curve is populated with pricing from uninsured BBB General Obligation bonds. Indices are unmanaged and one cannot directly invest in them. They do not include fees, expenses or sales charges. Past performance is not an indicator or a guarantee of future results. Select the image to expand the view.
Exhibit 4: Taxable-Equivalent Muni Credit Curves
Taxable-Equivalent Muni Credit Curves
Source: Bloomberg, Western Asset. As of 29 Nov 24. Bloomberg Valuation Service (BVAL) Municipal Credit Indices (AAA, AA, A, BBB, respectively) and US Sovereign Curves. Taxable-Equivalent Muni Credit Curves consider the top marginal effective tax rate of 40.8%. AA Muni is represented by the US General Obligation AA Muni BVAL Yield Curve. The BVAL curve is populated with pricing from uninsured AA General Obligation bonds. A Muni is represented by the US General Obligation A Muni BVAL Yield Curve. The BVAL curve is populated with pricing from uninsured A General Obligation bonds. BBB Muni is represented by the US General Obligation BBB Muni BVAL Yield Curve. The BVAL curve is populated with pricing from uninsured BBB General Obligation bonds. Indices are unmanaged and one cannot directly invest in them. They do not include fees, expenses or sales charges. Past performance is not an indicator or a guarantee of future results. Select the image to expand the view.
Exhibit 5: AAA Munis vs. Treasuries
AAA Munis vs. Treasuries
Source: Muni Yields: Thomson Reuters MMD, Treasury Yields: Bloomberg. As of 29 Nov 24. Past performance is not a guarantee of future results. It is not possible to invest directly in an index. Select the image to expand the view.
Exhibit 6: Tax-Exempt and Taxable Muni Valuations
Tax-Exempt and Taxable Muni Valuations
Source: Bloomberg, Western Asset. Yield-to-worst (YTW) is the lowest potential yield that can be received on a bond without the issuer actually defaulting. AAA, AA, A, BBB Corporate Indices; After-Tax Yield assumes a top effective tax rate of 40.8%. Taxable Muni Index Corporate comparable used is the Global Corporate Aggregate (ex. BBB) to better align credit quality and duration. As of 29 Nov 24. Select the image to expand the view.

Western Asset Key Themes for Muni Investors

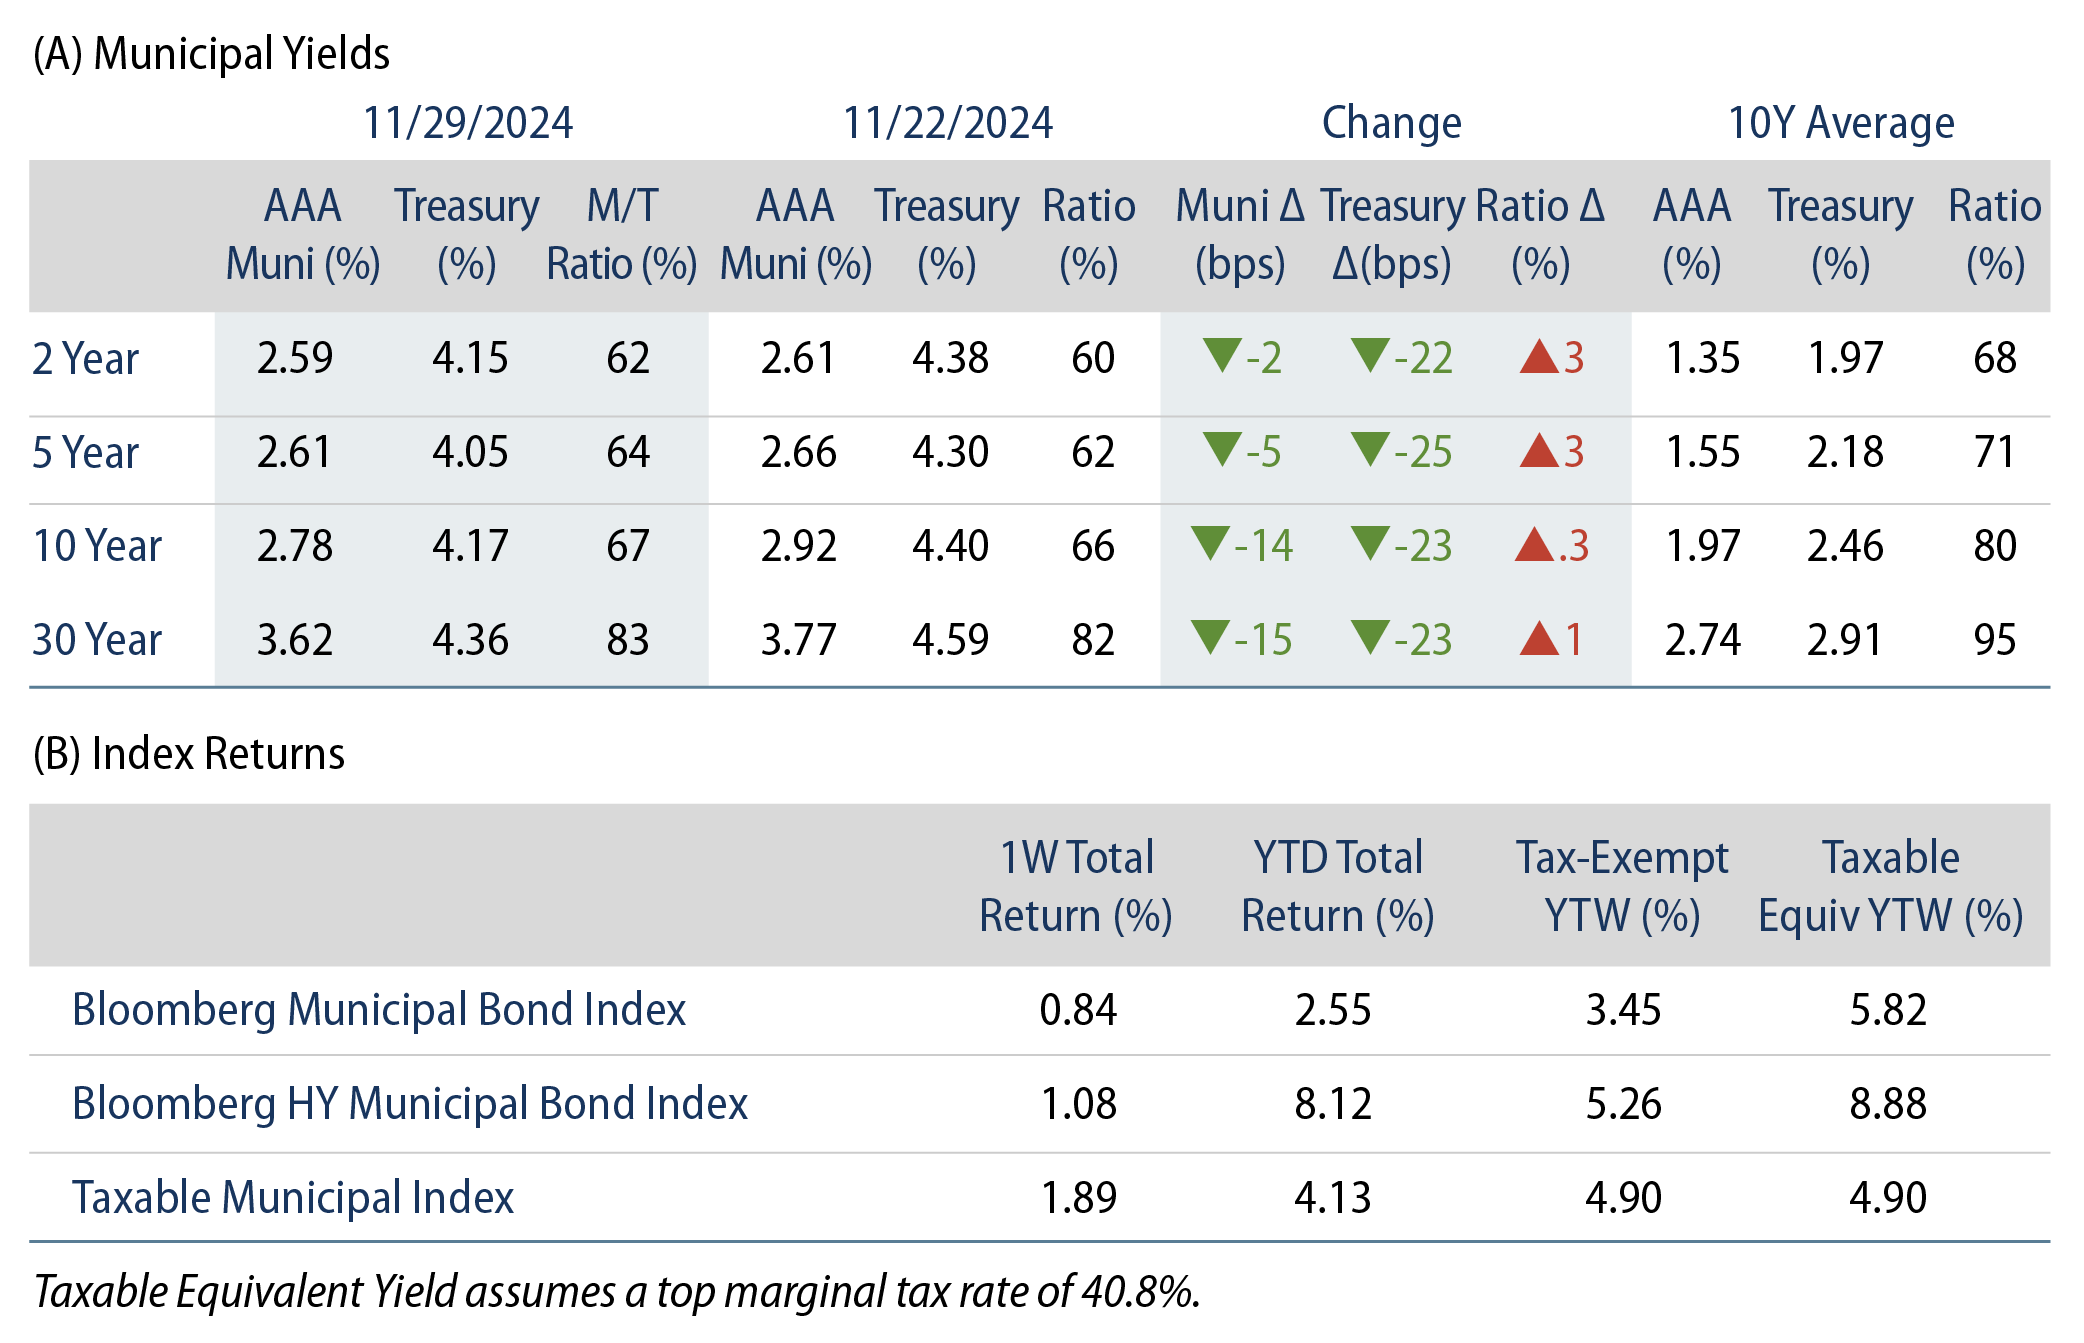
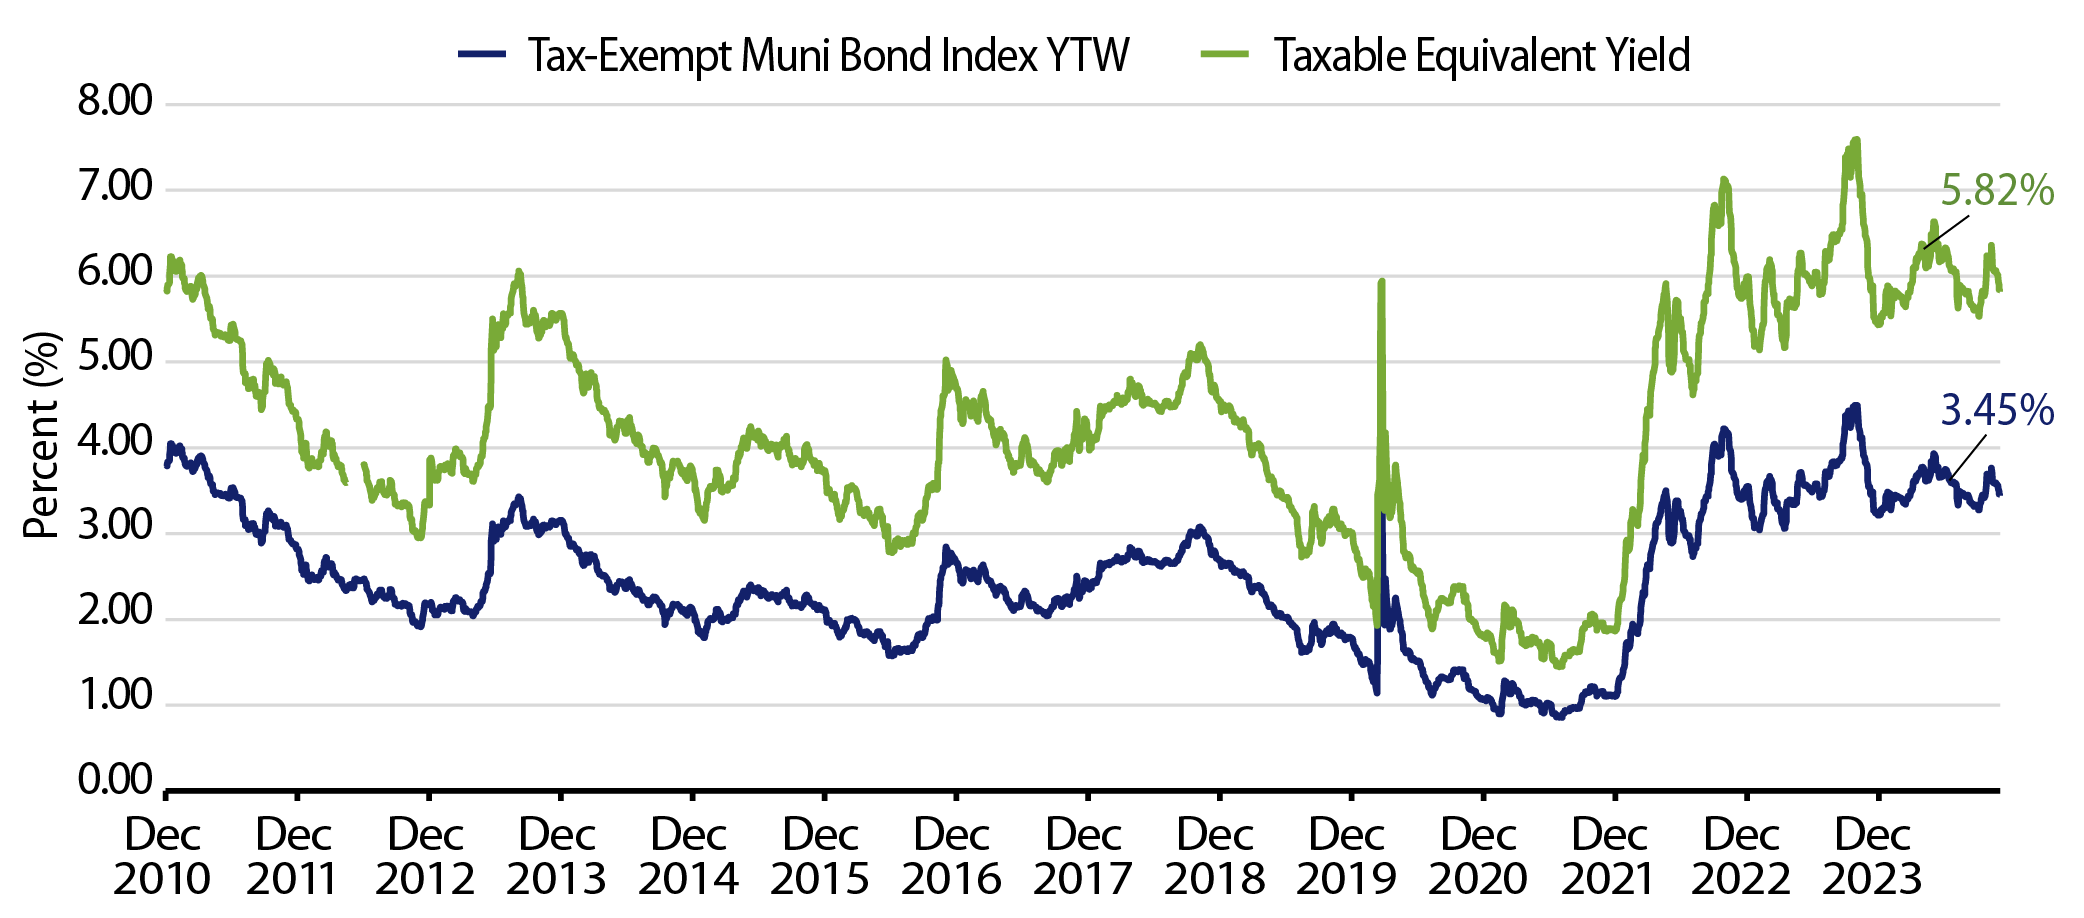
Theme #1: Municipal taxable-equivalent yields remain above decade averages.

Exhibit 7: Muni and Taxable-Equivalent Muni Yield-to-Worst
Muni and Taxable-Equivalent Muni Yield-to-Worst
Source: Bloomberg, Western Asset. As of As of 29 Nov 24. Bloomberg Municipal Bond Index yield considering highest marginal tax rate of 40.8%. Indexes are unmanaged and one cannot directly invest in them. They do not include fees, expenses or sales charges. Past performance is not an indicator or a guarantee of future results. Select the image to expand the view.

Theme #2: A slight inversion in short maturities underscores the potential value in longer maturities.

Exhibit 8: AAA Municipal vs. Treasury Yield Curves
AAA Municipal vs. Treasury Yield Curves
Source: Bloomberg, Western Asset. As of 29 Nov 24. Bloomberg Valuation Service (BVAL) AAA Muni Curve and US On-/Off-the-Run Sovereign Curve. Indexes are unmanaged and one cannot directly invest in them. They do not include fees, expenses or sales charges. Past performance is not an indicator or a guarantee of future results. Select the image to expand the view.

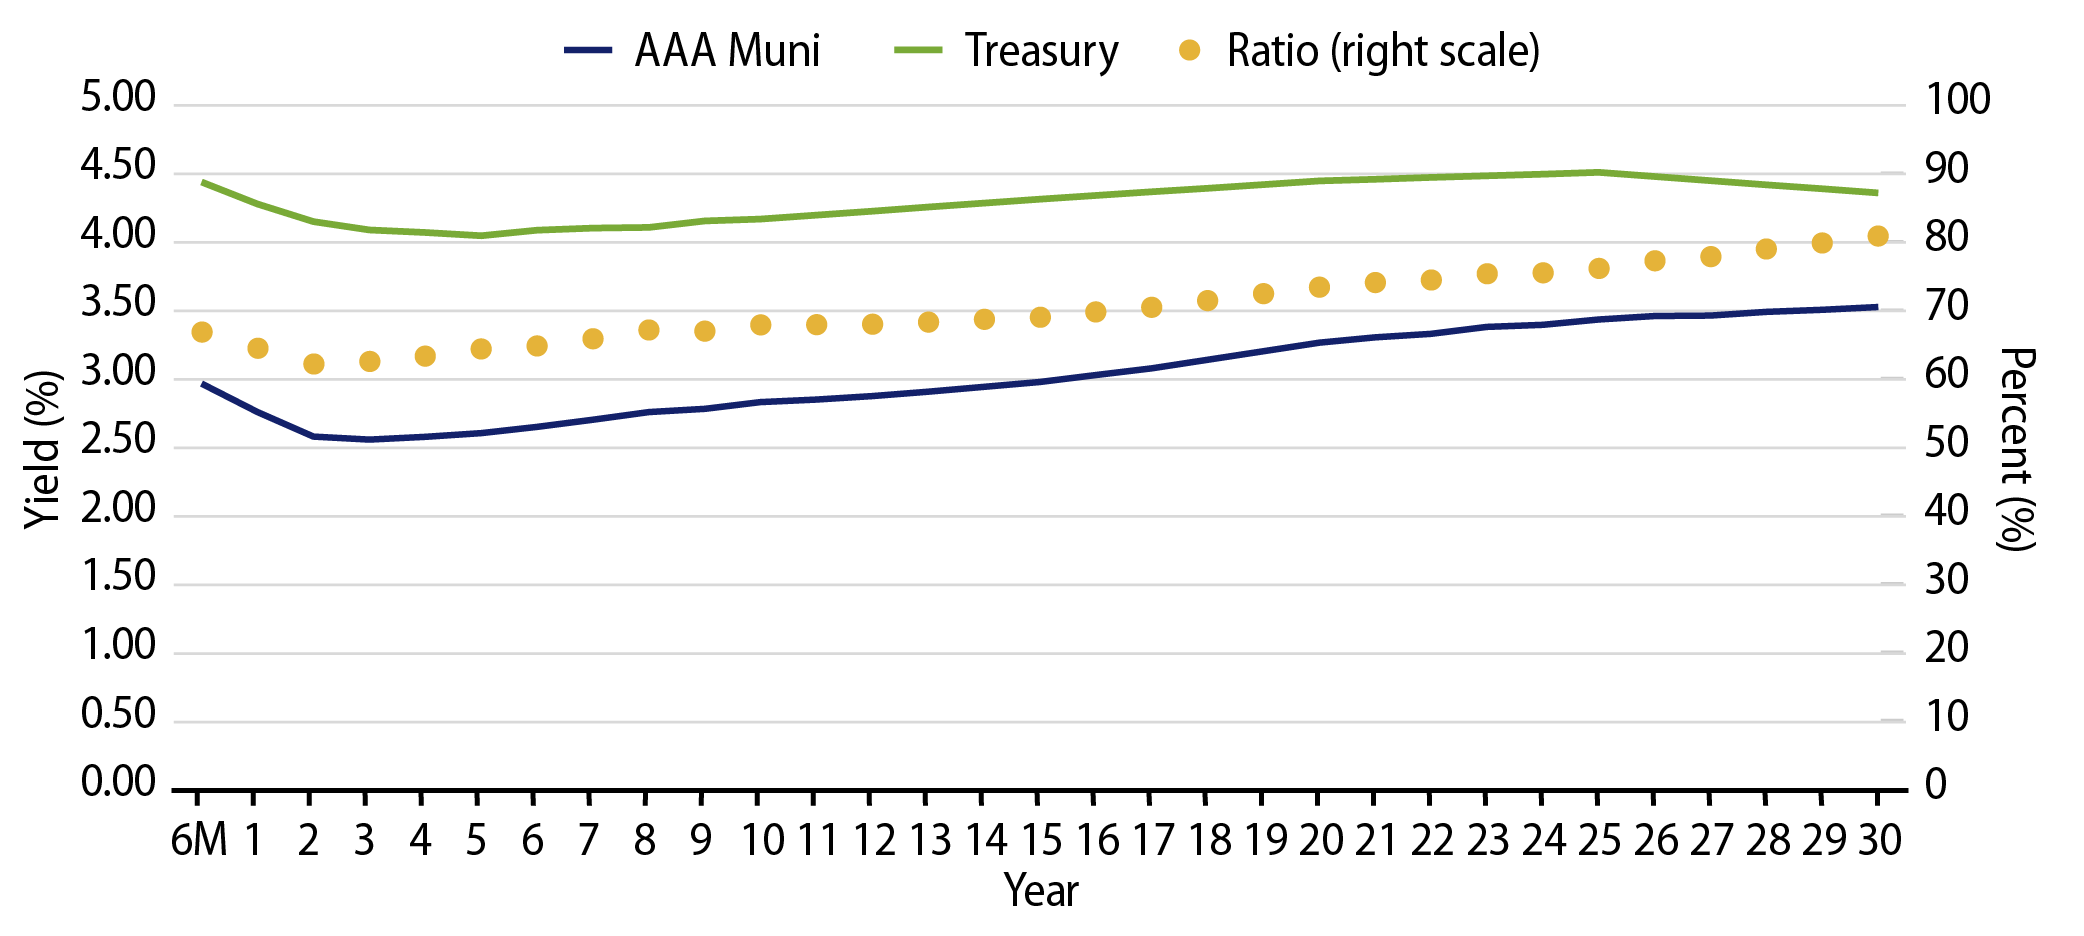
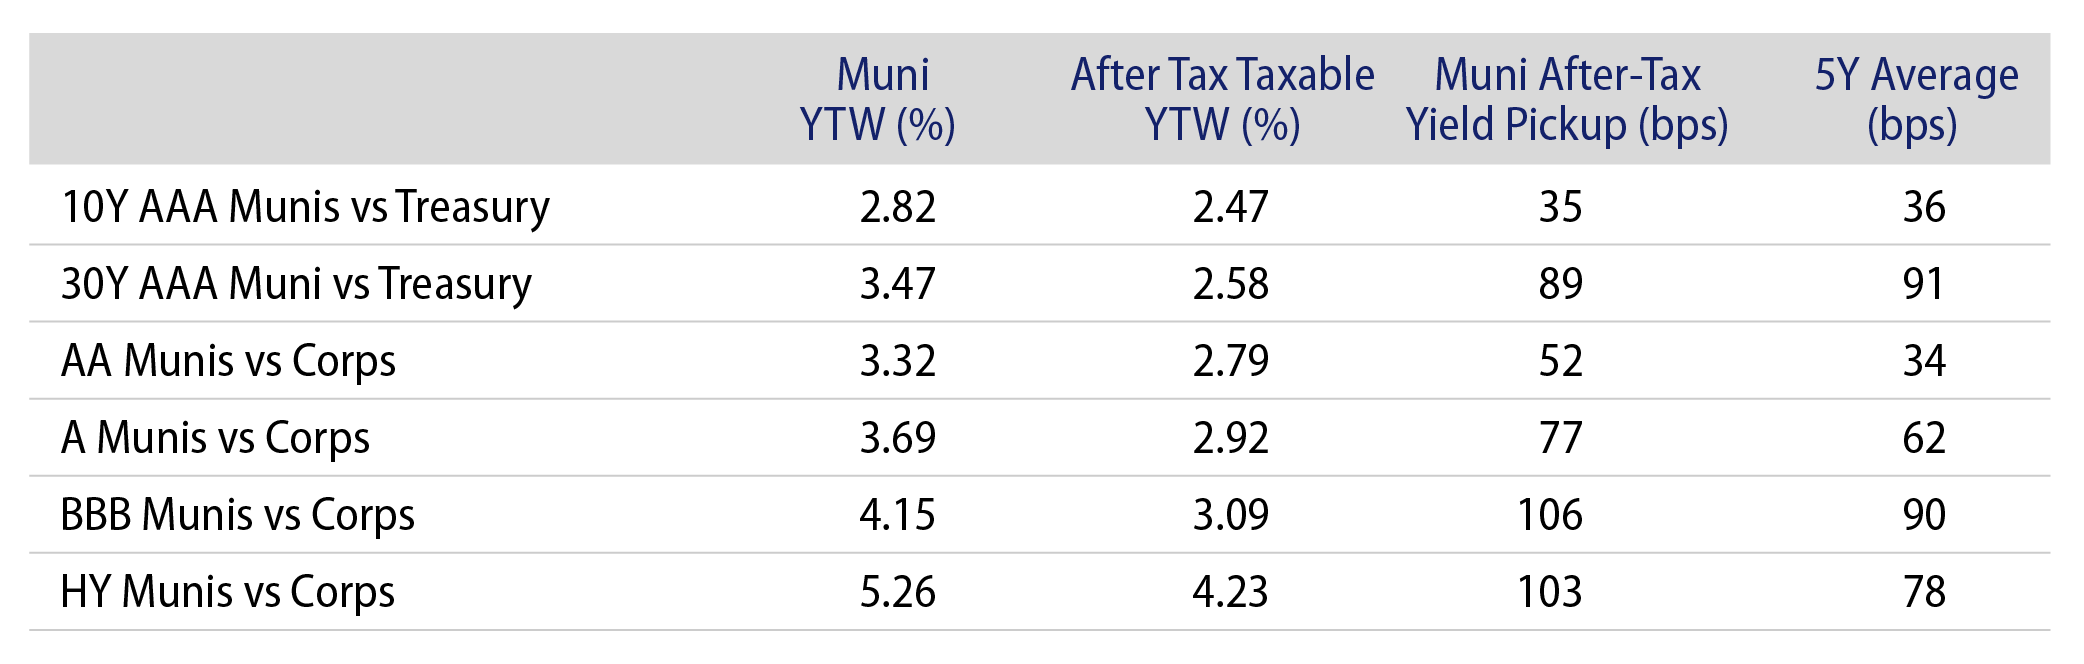
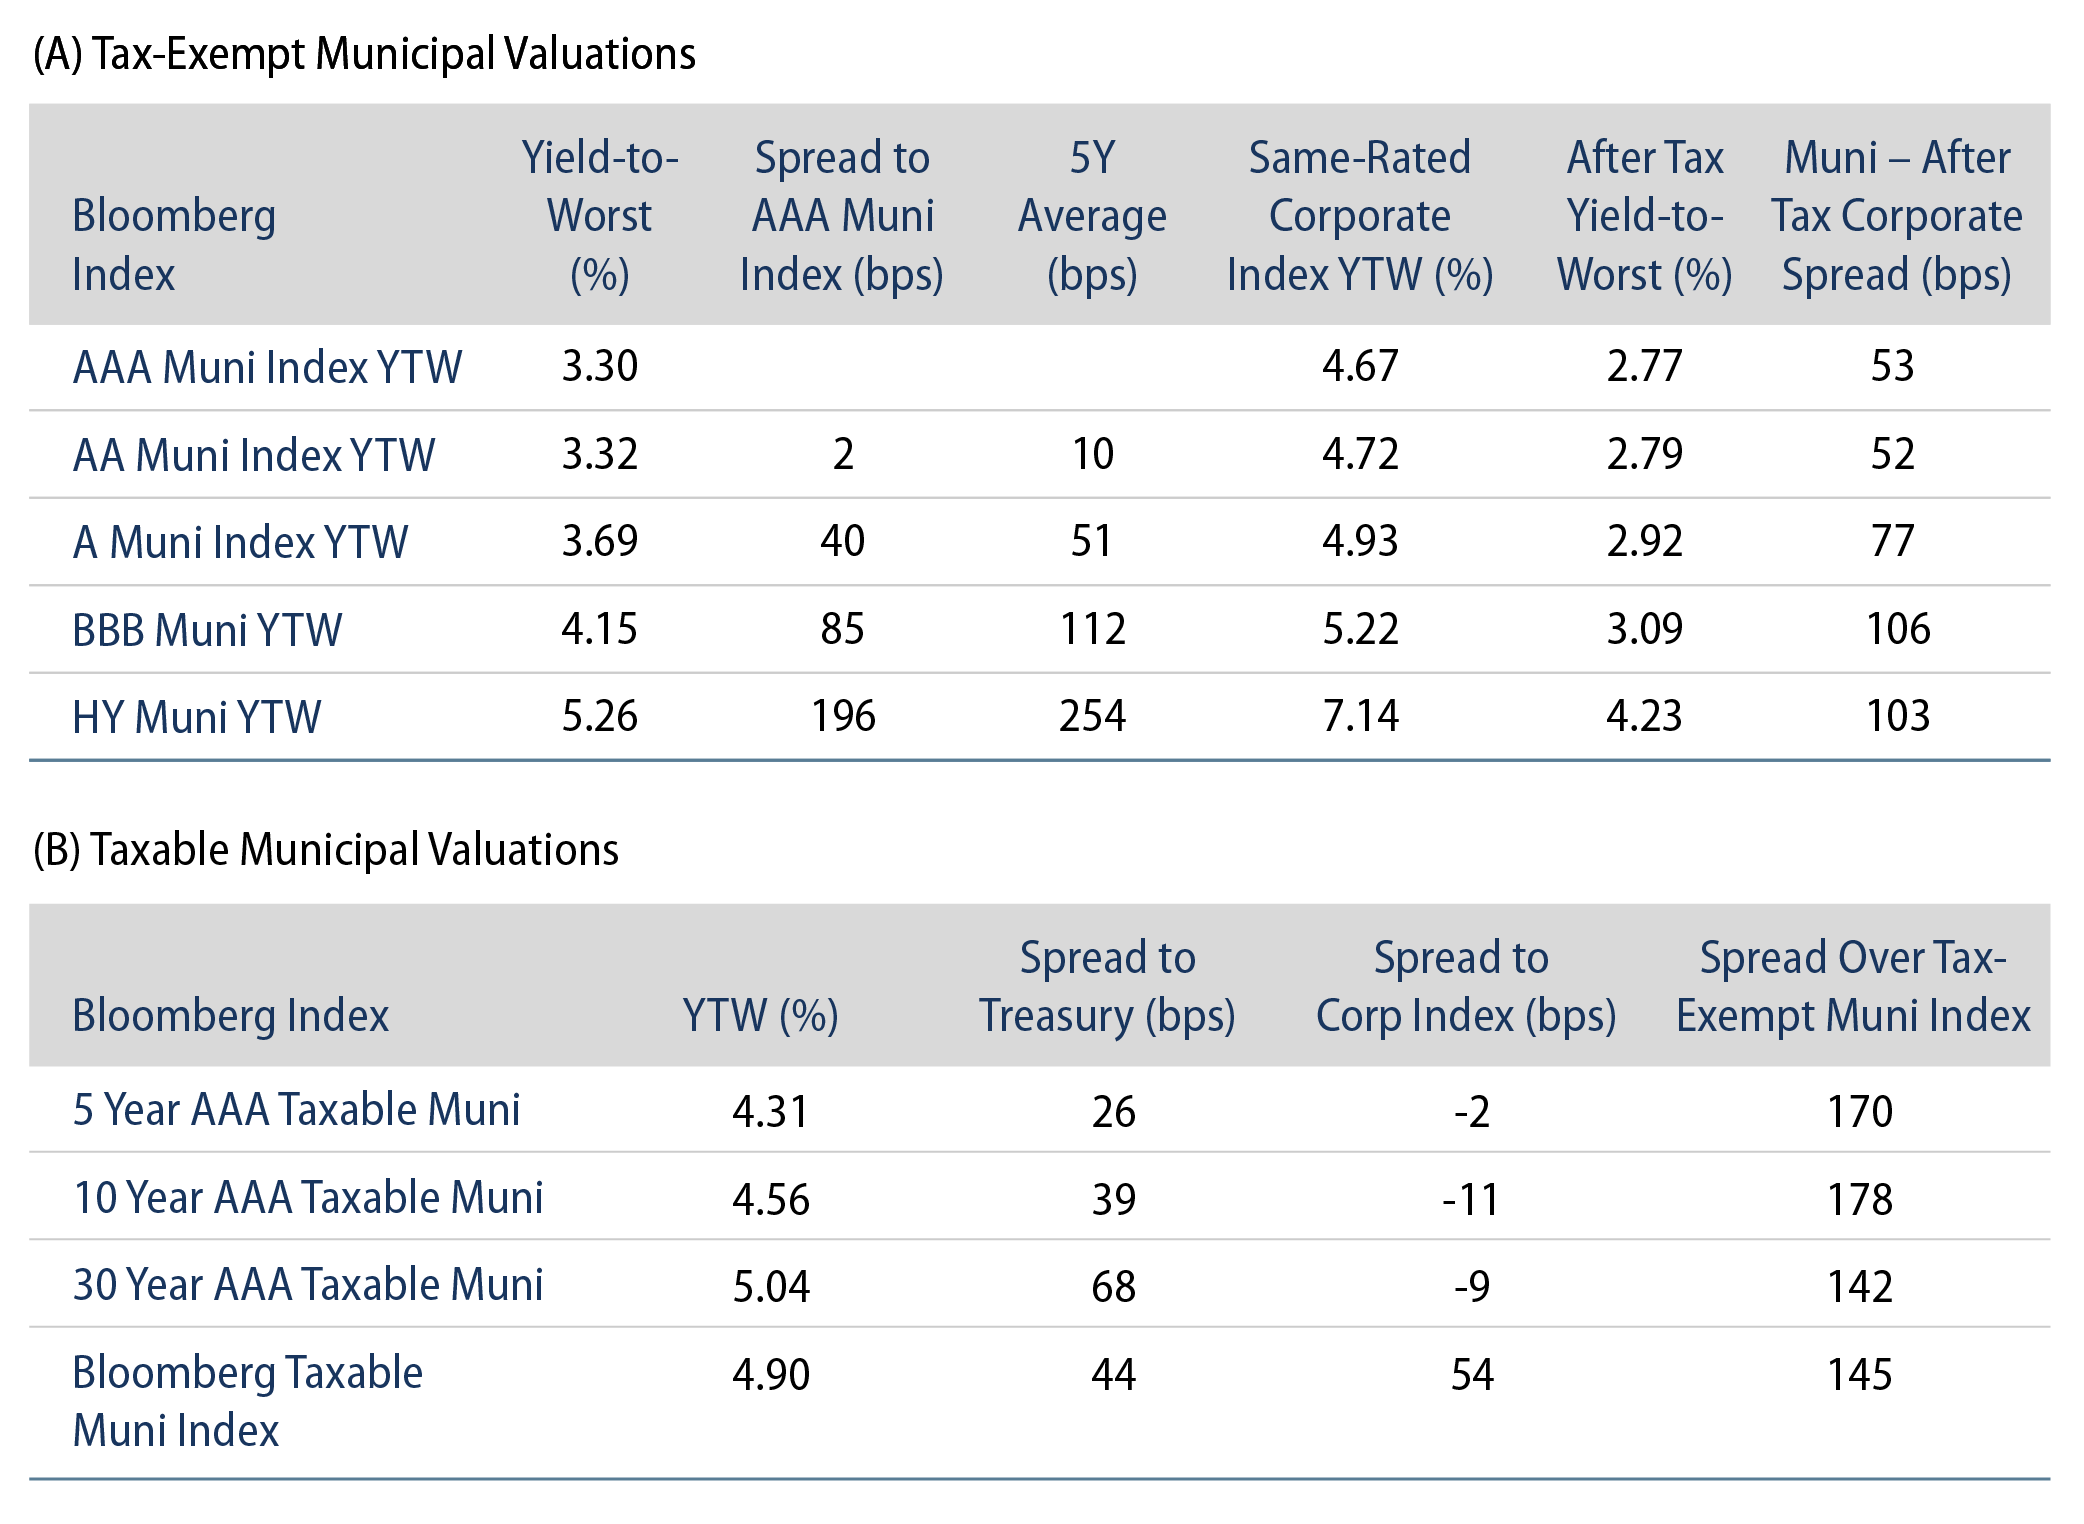
Theme #3: Munis offer attractive after-tax yield pickup versus longer-dated Treasuries and investment-grade corporate credit.

Exhibit 9: Municipal vs. Taxable Fixed-Income Yields by Quality
Municipal vs. Taxable Fixed-Income Yields by Quality
Source: Western Asset, Bloomberg. As 29 Nov 24. 10- and 30-Year comparison reflects Bloomberg Valuation Service (BVAL) AAA Muni Curve and US On-/Off-the-Run Sovereign Curve. AA Muni reflects the Bloomberg AA Muni Bond Index. A Muni reflects the Bloomberg A Muni Bond Index. BBB Muni reflects the Bloomberg BBB Muni Bond Index. HY Muni reflects the Bloomberg High Yield Muni Bond Index. AA Corp reflects the Bloomberg AA Corporate Bond Index. A Corp reflects the Bloomberg A Corporate Bond Index. BBB Corp reflects the Bloomberg BBB Corporate Bond Index. After-tax yield considers top marginal tax rate of 40.8%. Indexes are unmanaged and one cannot directly invest in them. They do not include fees, expenses or sales charges. Past performance is not an indicator or a guarantee of future results. Select the image to expand the view.

© Western Asset Management Company, LLC 2025. The information contained in these materials ("the materials") is intended for the exclusive use of the designated recipient ("the recipient"). This information is proprietary and confidential and may contain commercially sensitive information, and may not be copied, reproduced or republished, in whole or in part, without the prior written consent of Western Asset Management Company ("Western Asset").
Past performance does not predict future returns. These materials should not be deemed to be a prediction or projection of future performance. These materials are intended for investment professionals including professional clients, eligible counterparties, and qualified investors only.
These materials have been produced for illustrative and informational purposes only. These materials contain Western Asset's opinions and beliefs as of the date designated on the materials; these views are subject to change and may not reflect real-time market developments and investment views.
Third party data may be used throughout the materials, and this data is believed to be accurate to the best of Western Asset's knowledge at the time of publication, but cannot be guaranteed. These materials may also contain strategy or product awards or rankings from independent third parties or industry publications which are based on unbiased quantitative and/or qualitative information determined independently by each third party or publication. In some cases, Western Asset may subscribe to these third party's standard industry services or publications. These standard subscriptions and services are available to all asset managers and do not influence rankings or awards in any way.
Investment strategies or products discussed herein may involve a high degree of risk, including the loss of some or all capital. Investments in any products or strategies described in these materials may be volatile, and investors should have the financial ability and willingness to accept such risks.
Unless otherwise noted, investment performance contained in these materials is reflective of a strategy composite. All other strategy data and information included in these materials reflects a representative portfolio which is an account in the composite that Western Asset believes most closely reflects the current portfolio management style of the strategy. Performance is not a consideration in the selection of the representative portfolio. The characteristics of the representative portfolio shown may differ from other accounts in the composite. Information regarding the representative portfolio and the other accounts in the composite are available upon request. Statements in these materials should not be considered investment advice. References, either general or specific, to securities and/or issuers in the materials are for illustrative purposes only and are not intended to be, and should not be interpreted as, recommendation to purchase or sell such securities. Employees and/or clients of Western Asset may have a position in the securities or issuers mentioned.
These materials are not intended to provide, and should not be relied on for, accounting, legal, tax, investment or other advice. The recipient should consult its own counsel, accountant, investment, tax, and any other advisers for this advice, including economic risks and merits, related to making an investment with Western Asset. The recipient is responsible for observing the applicable laws and regulations of their country of residence.
Founded in 1971, Western Asset Management Company is a global fixed-income investment manager with offices in Pasadena, New York, London, Singapore, Tokyo, Melbourne, São Paulo, Hong Kong, and Zürich. Western Asset is a wholly owned subsidiary of Franklin Resources, Inc. but operates autonomously. Western Asset is comprised of six legal entities across the globe, each with distinct regional registrations: Western Asset Management Company, LLC, a registered Investment Adviser with the Securities and Exchange Commission; Western Asset Management Company Ltda. is regulated by Comissão de Valores Mobiliários; Western Asset Management Company Pty Ltd ABN 41 117 767 923 is the holder of the Australian Financial Services License 303160; Western Asset Management Company Pte. Ltd. Co. Reg. No. 200007692R is a holder of a Capital Markets Services License for fund management and regulated by the Monetary Authority of Singapore; Western Asset Management Company Ltd, a registered Financial Instruments Business Operator and regulated by the Financial Services Agency of Japan; and Western Asset Management Company Limited is authorised and regulated by the Financial Conduct Authority ("FCA") (FRN 145930). This communication is intended for distribution to Professional Clients only if deemed to be a financial promotion in the UK as defined by the FCA. This communication may also be intended for certain EEA countries where Western Asset has been granted permission to do so. For the current list of the approved EEA countries please contact Western Asset at +44 (0)20 7422 3000.