skip navigation
Blog

Stay up to date on timely topics and market events. Subscribe to our Blog now.

MARKETS
29 August 2023

Weekly Municipal Monitor—State & Local Payrolls Improve, Lag Pandemic Recovery

By Sam Weitzman

Stay up to date on timely topics and market events. Subscribe to our Blog now.

Municipals Posted Negative Returns Last Week

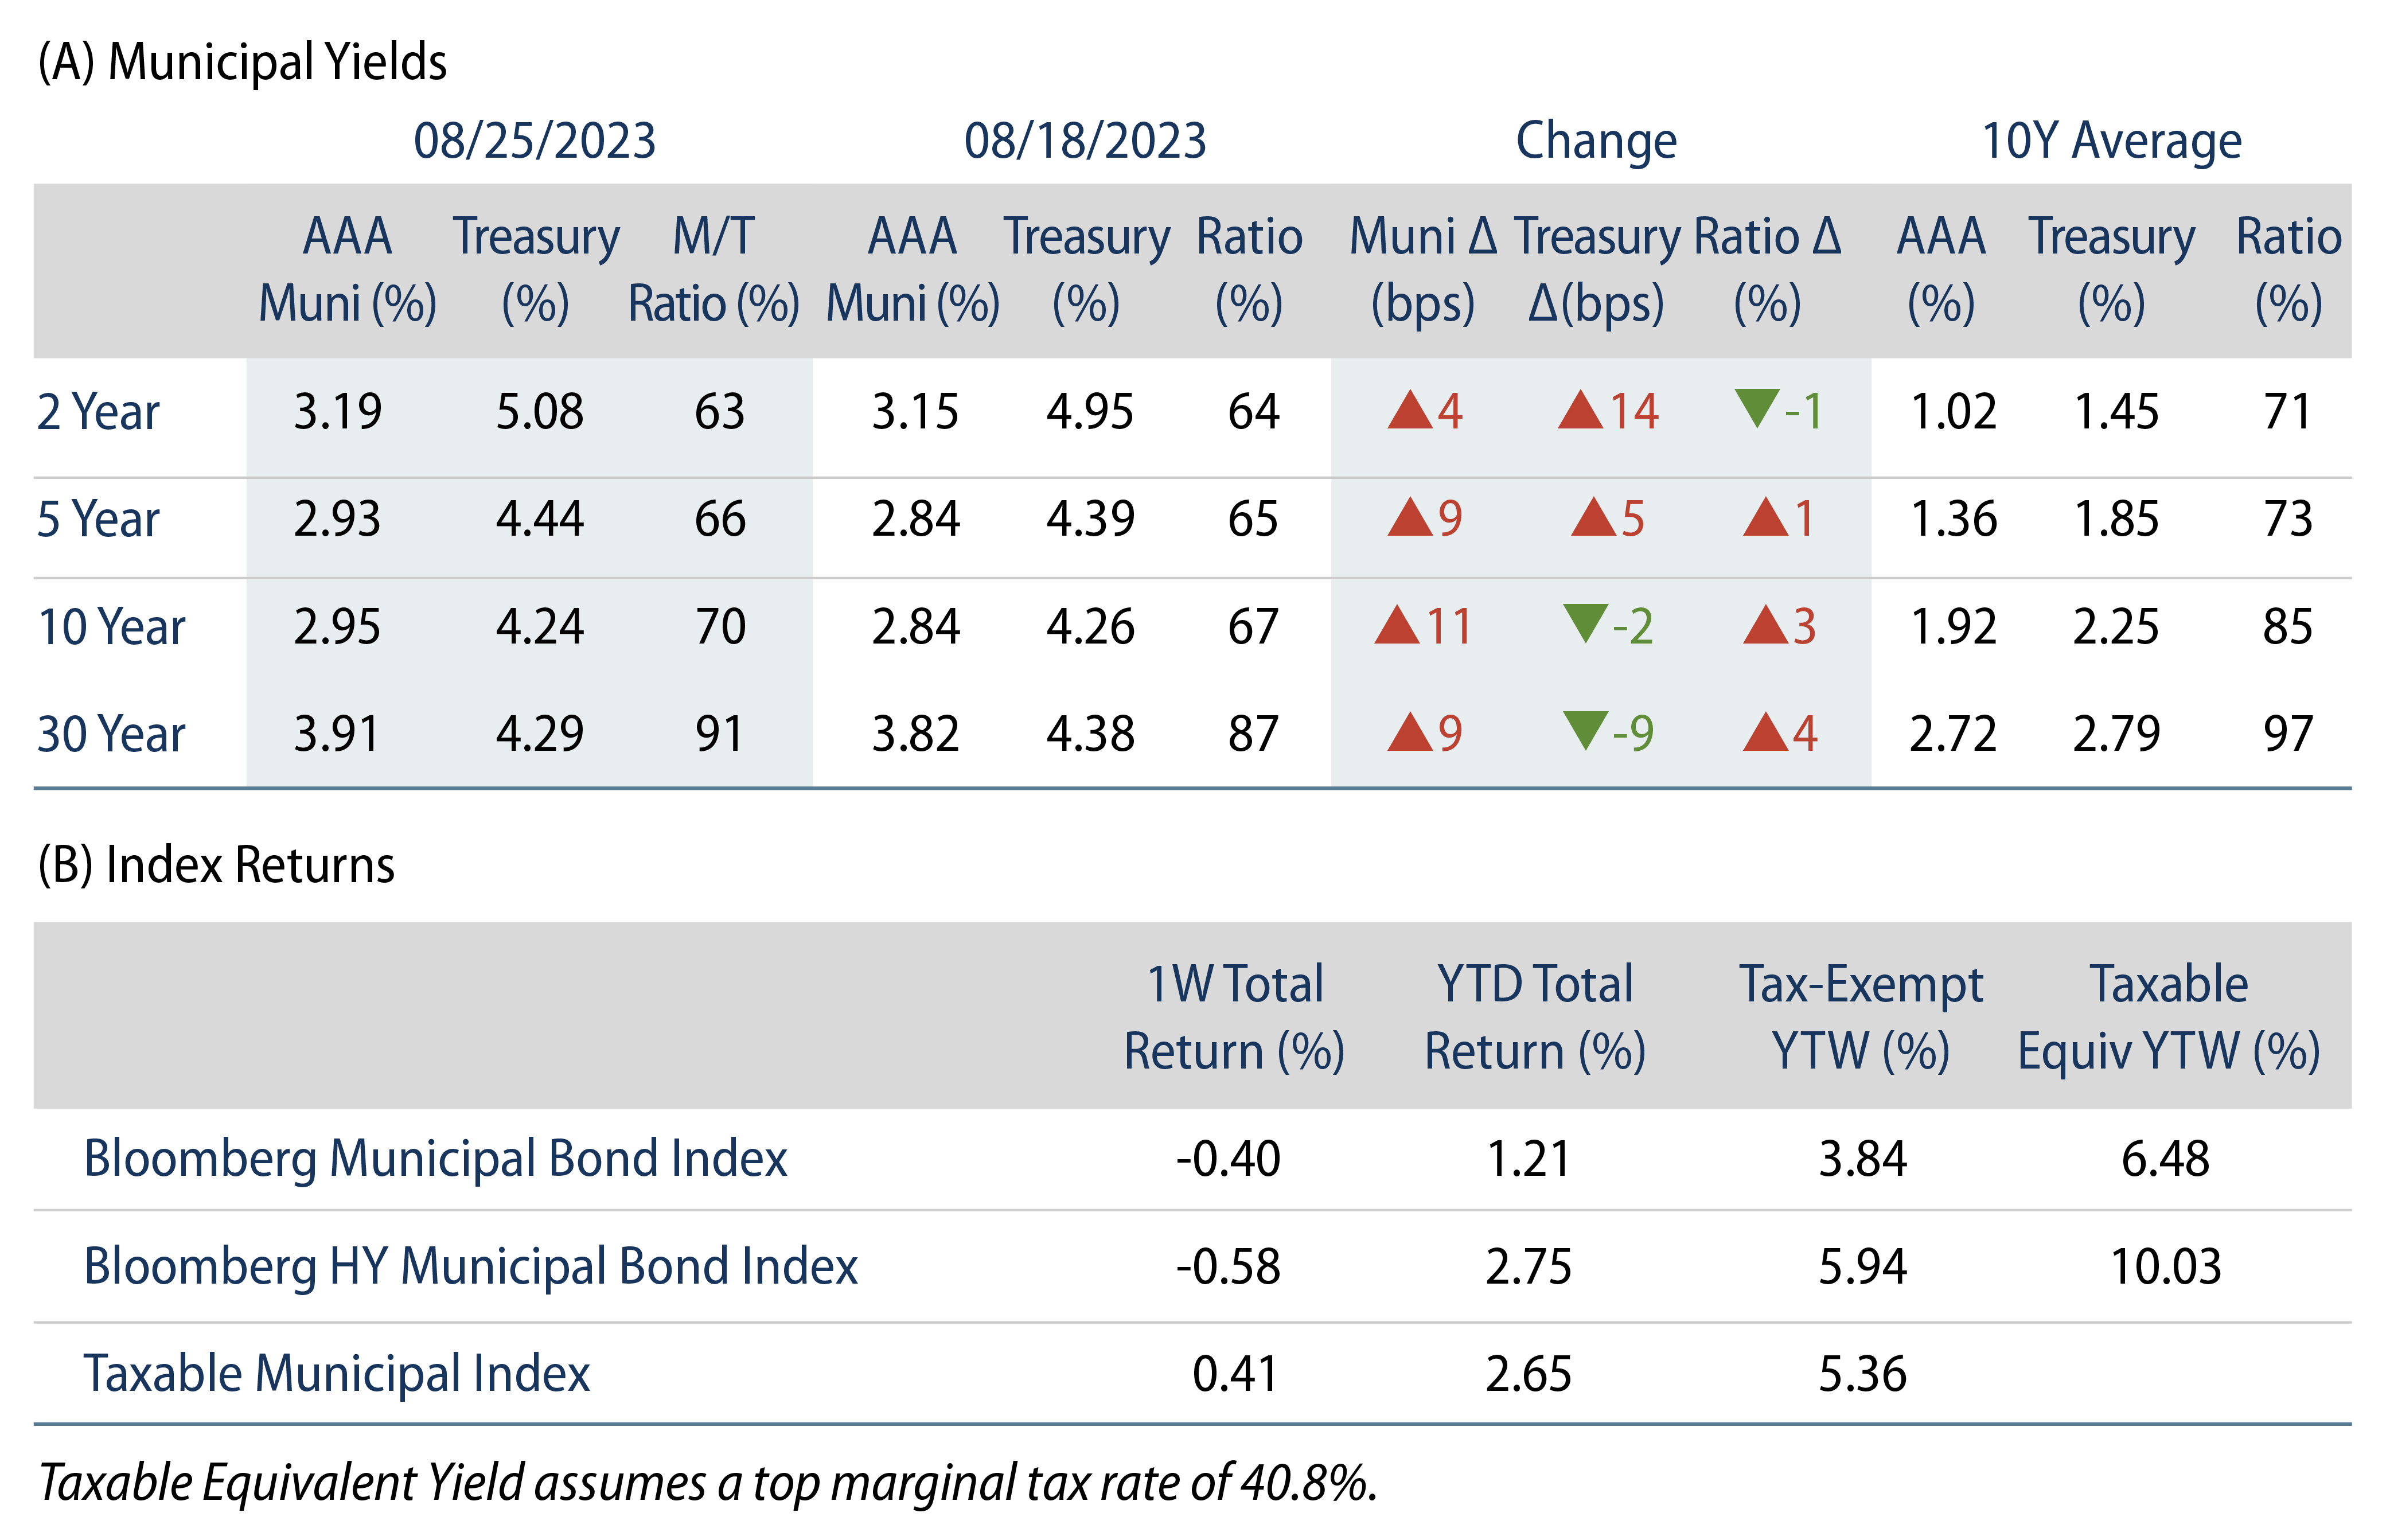
Weaker technicals were driven by fund outflows and higher supply conditions. High-grade municipal yields moved higher with US Treasuries (USTs) across the curve. Munis generally underperformed USTs, continuing to reverse outperformance seen over the summer as technicals weakened. The Bloomberg Municipal Index returned -0.40% during the week, the High Yield Muni Index returned -0.58%, and the Taxable Muni Index returned 0.41%. Ahead of the Labor Day holiday this week, we highlight the state of muni payrolls.

Municipal Mutual Funds Extended Outflows Last Week

Fund Flows: During the week ending August 23, weekly reporting municipal mutual funds recorded $534 million of net outflows, according to Lipper. Long-term funds recorded $298 million of outflows, high-yield funds recorded $28 million of inflows, and intermediate funds recorded $72 million of outflows. This week’s outflows bring year-to-date (YTD) net outflows to $8.0 billion.

Supply: The muni market recorded $9 billion of new issue volume last week, up 20% from last week. YTD issuance of $236 billion was down 8% year-over-year (YoY), with tax-exempt issuance down 1% YoY and taxable issuance down 45% YoY. This week’s calendar is expected to drop to $4 billion ahead of the holiday weekend. Large transactions include $665 million Main Street Natural Gas and $259 million City of Jacksonville (appropriation) transactions.

This Week in Munis: State & Local Payrolls Improve YTD, Lag Post-Pandemic Recovery

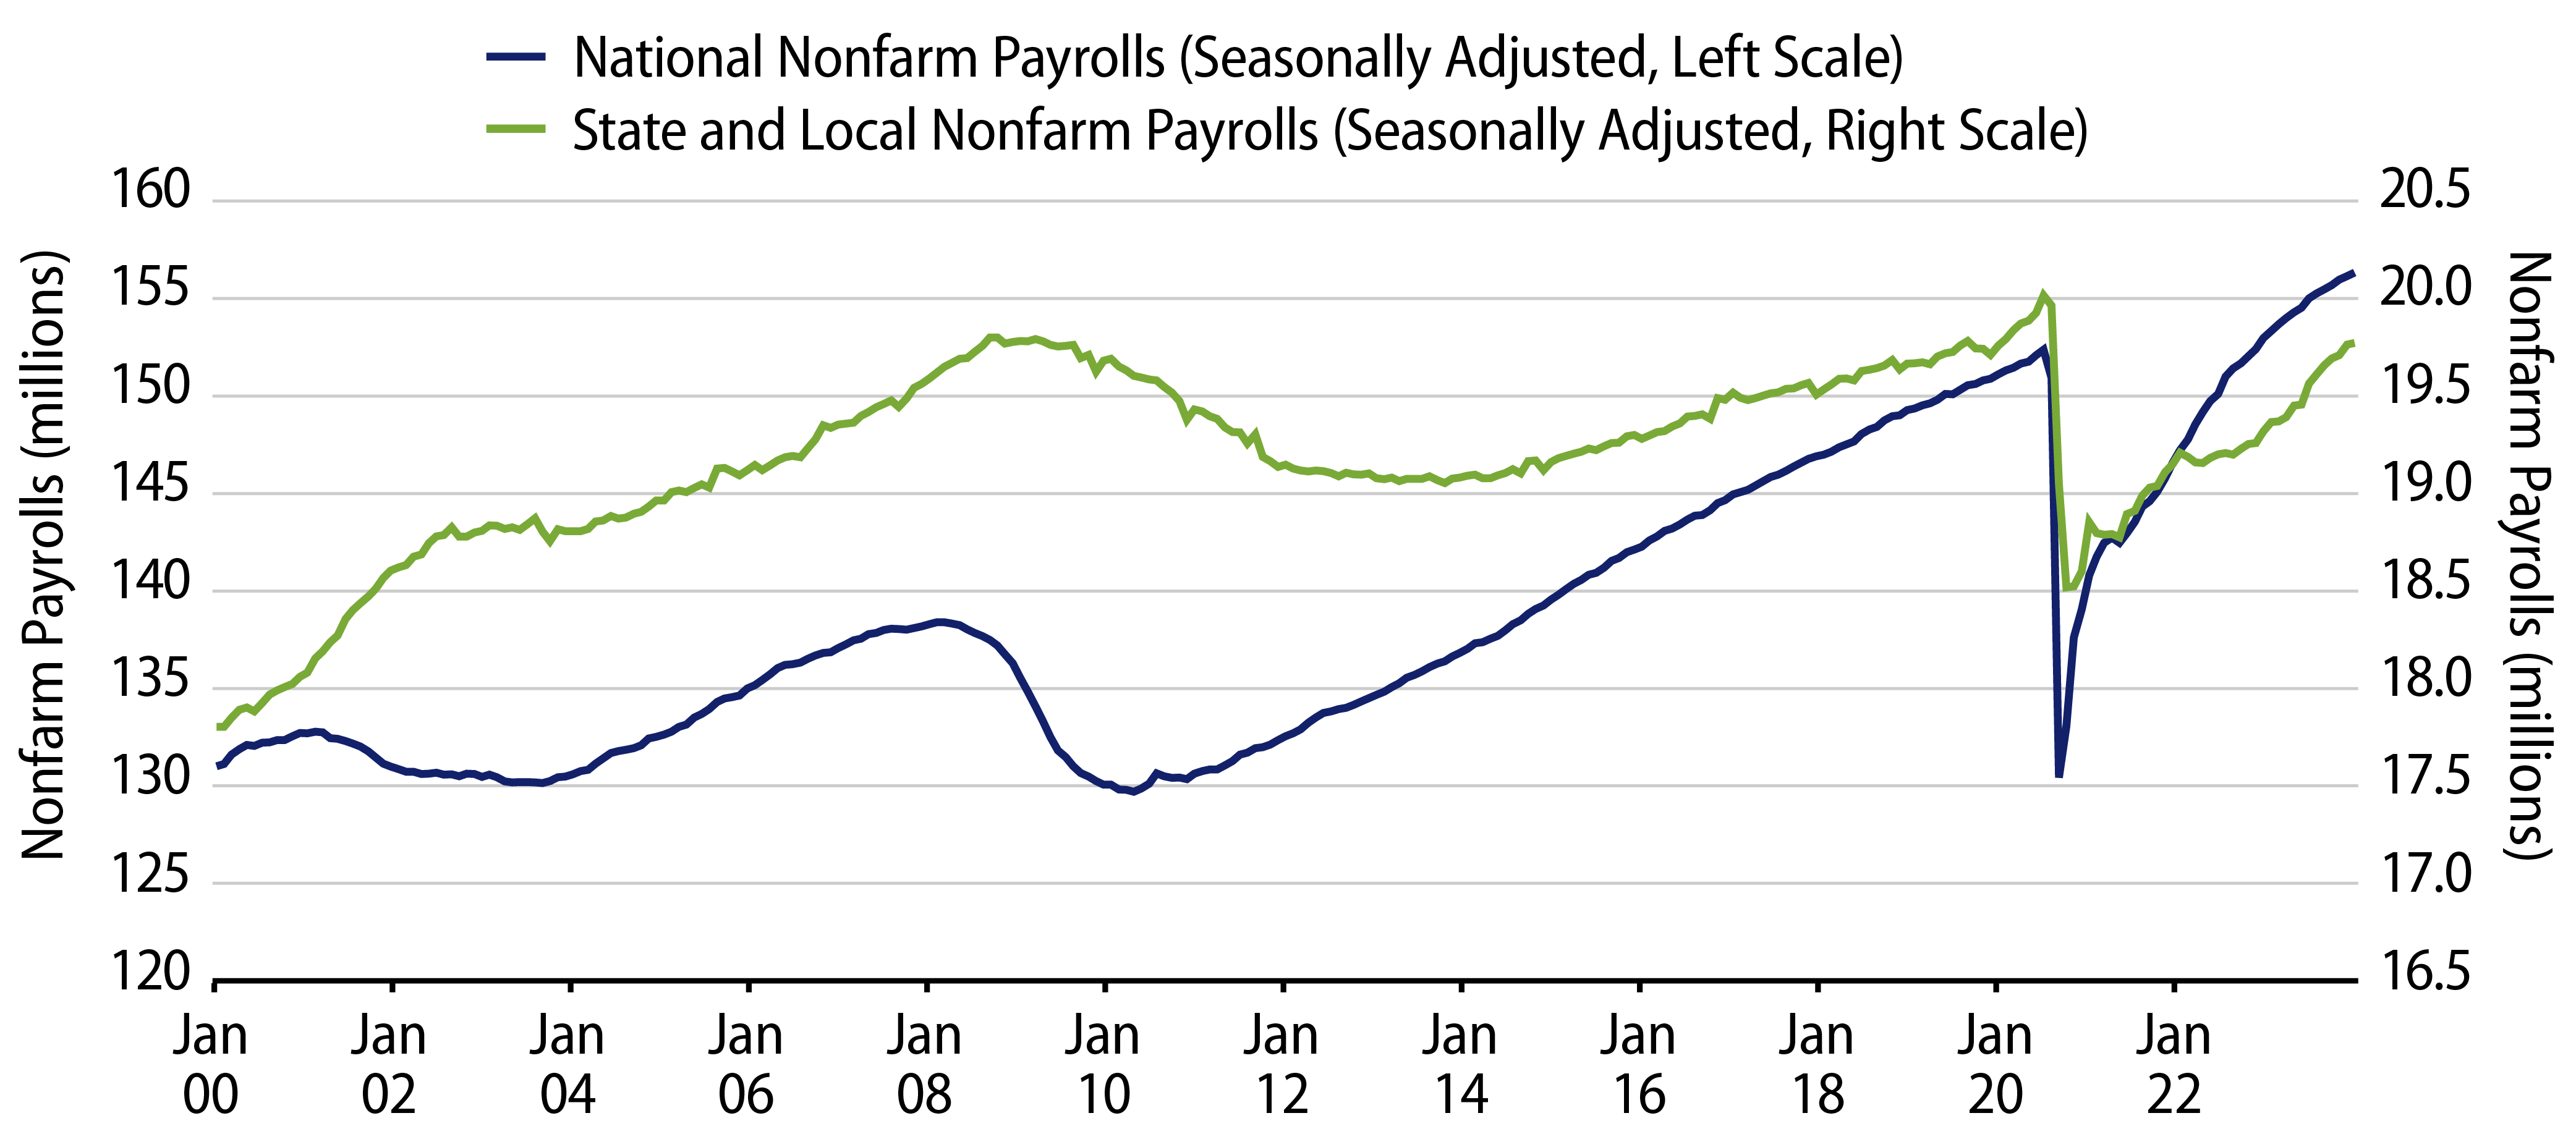
Last week the U.S. Bureau of Labor Statistics announced a -306,000 downward revision to annual payrolls through March. Despite this downward revision, national nonfarm payrolls remain 2.6% higher than the pre-pandemic peak. While national nonfarm payrolls remain well above pre-pandemic highs, state and local payrolls continue to lag pre-pandemic levels by 1.3%. This gap has closed modestly this year, as state and local payrolls have been improving (1.6%) at a greater rate than national payrolls (1.2%)

Within public sector payrolls, state and local employment remain 1.5% and 1.1% below pre-pandemic highs, respectively. While local jobs have steadily improved from the depths of the pandemic to 14.5 million, state payrolls have been more volatile and started to pick up in earnest this year, increasing 2.9% YTD compared to 1.2% growth observed from the local level.

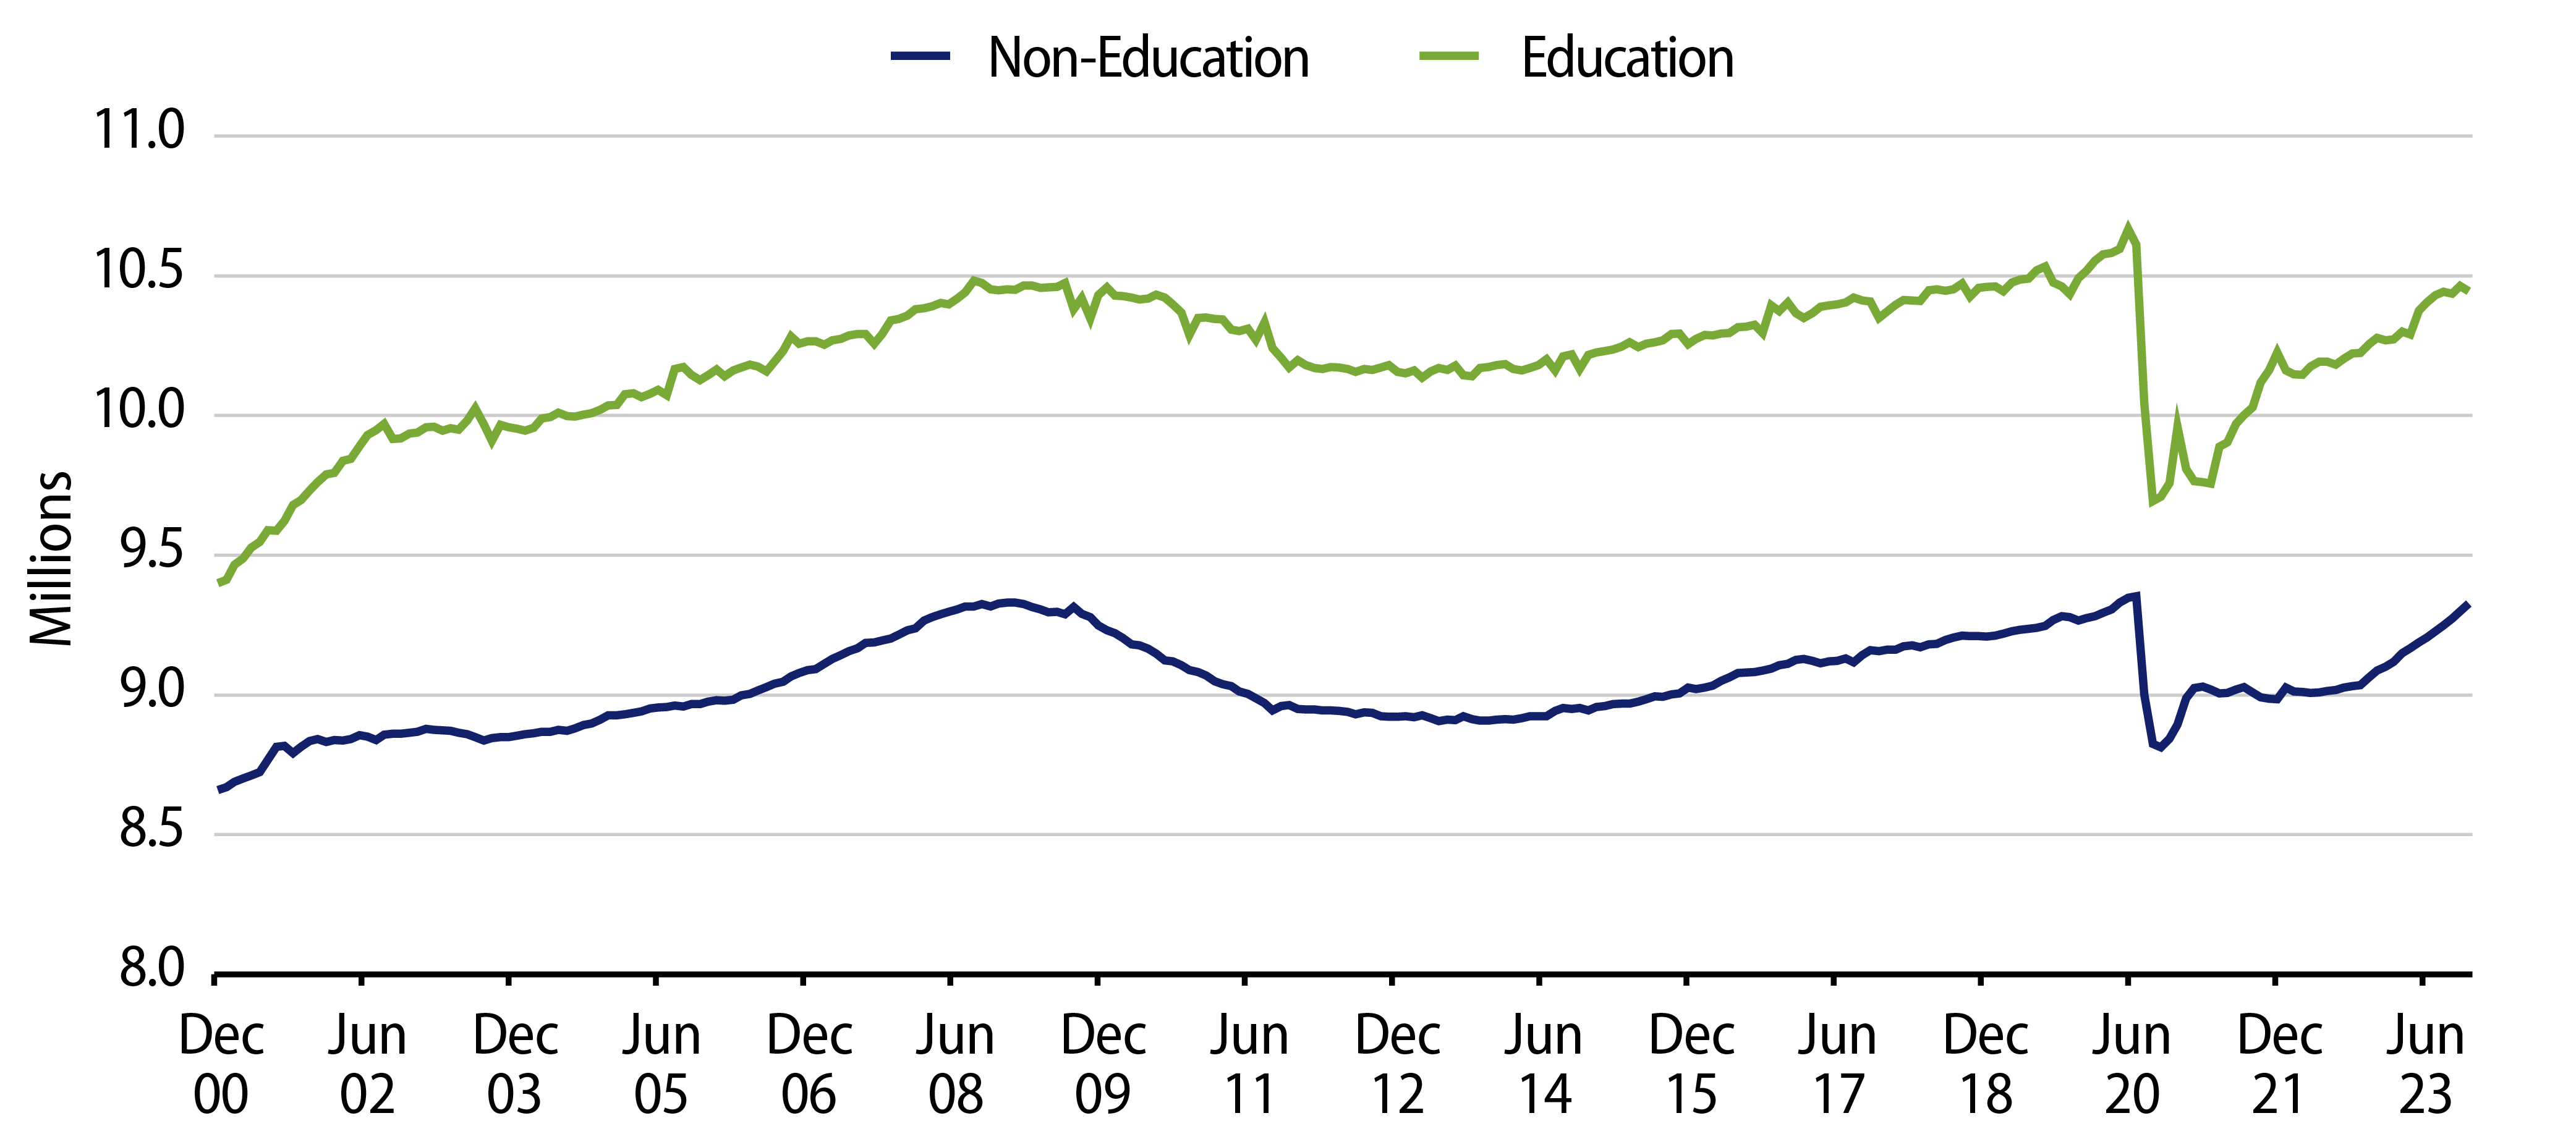
Evaluating state and local payrolls by employment type, non-education employment has nearly fully recovered from pandemic drawdowns to 9.3 million jobs, falling just 25,000 short (-0.3%) of pre-pandemic highs in July 2023. Meanwhile, the larger education payroll category reached 10.4 million in July, still 1.6% below pre-pandemic levels.

Western Asset attributes the lag in public sector payroll growth to overall labor supply challenges, as well as municipalities planning for potential revenue volatility. The demonstrated ability for state and local governments to operate at lower headcount levels while revenues peak is positive for municipal credit fundamentals, as the economy shows signs of cooling.

Exhibit 1: US Nonfarm Payrolls vs. State & Local Payrolls
Explore US Nonfarm Payrolls vs. State & Local Payrolls
Source: U.S. Bureau of Labor Statistics. As of 31 Jul 23. Select the image to expand the view.
Exhibit 2: State vs. Local Employment
Explore State vs. Local Employment
Source: U.S. Bureau of Labor Statistics. As of 31 Jul 23. Select the image to expand the view.
Exhibit 3: State & Local Employment by Type
Explore State & Local Employment by Type
Source: U.S. Bureau of Labor Statistics. As of 31 Jul 23. Select the image to expand the view.
Exhibit 4: Municipal Bond Yields and Index Returns
Explore Municipal Bond Yields and Index Returns
Source: Bloomberg. As of 25 Aug 23. Select the image to expand the view.
Exhibit 5: Tax-Exempt and Taxable Muni Valuations
Explore Tax-Exempt and Taxable Muni Valuations
Source: Bloomberg. As of 25 Aug 23. Select the image to expand the view.
© Western Asset Management Company, LLC 2024. The information contained in these materials ("the materials") is intended for the exclusive use of the designated recipient ("the recipient"). This information is proprietary and confidential and may contain commercially sensitive information, and may not be copied, reproduced or republished, in whole or in part, without the prior written consent of Western Asset Management Company ("Western Asset").
Past performance does not predict future returns. These materials should not be deemed to be a prediction or projection of future performance. These materials are intended for investment professionals including professional clients, eligible counterparties, and qualified investors only.
These materials have been produced for illustrative and informational purposes only. These materials contain Western Asset's opinions and beliefs as of the date designated on the materials; these views are subject to change and may not reflect real-time market developments and investment views.
Third party data may be used throughout the materials, and this data is believed to be accurate to the best of Western Asset's knowledge at the time of publication, but cannot be guaranteed. These materials may also contain strategy or product awards or rankings from independent third parties or industry publications which are based on unbiased quantitative and/or qualitative information determined independently by each third party or publication. In some cases, Western Asset may subscribe to these third party's standard industry services or publications. These standard subscriptions and services are available to all asset managers and do not influence rankings or awards in any way.
Investment strategies or products discussed herein may involve a high degree of risk, including the loss of some or all capital. Investments in any products or strategies described in these materials may be volatile, and investors should have the financial ability and willingness to accept such risks.
Unless otherwise noted, investment performance contained in these materials is reflective of a strategy composite. All other strategy data and information included in these materials reflects a representative portfolio which is an account in the composite that Western Asset believes most closely reflects the current portfolio management style of the strategy. Performance is not a consideration in the selection of the representative portfolio. The characteristics of the representative portfolio shown may differ from other accounts in the composite. Information regarding the representative portfolio and the other accounts in the composite are available upon request. Statements in these materials should not be considered investment advice. References, either general or specific, to securities and/or issuers in the materials are for illustrative purposes only and are not intended to be, and should not be interpreted as, recommendation to purchase or sell such securities. Employees and/or clients of Western Asset may have a position in the securities or issuers mentioned.
These materials are not intended to provide, and should not be relied on for, accounting, legal, tax, investment or other advice. The recipient should consult its own counsel, accountant, investment, tax, and any other advisers for this advice, including economic risks and merits, related to making an investment with Western Asset. The recipient is responsible for observing the applicable laws and regulations of their country of residence.
Founded in 1971, Western Asset Management Company is a global fixed-income investment manager with offices in Pasadena, New York, London, Singapore, Tokyo, Melbourne, São Paulo, Hong Kong, and Zürich. Western Asset is a wholly owned subsidiary of Franklin Resources, Inc. but operates autonomously. Western Asset is comprised of six legal entities across the globe, each with distinct regional registrations: Western Asset Management Company, LLC, a registered Investment Adviser with the Securities and Exchange Commission; Western Asset Management Company Distribuidora de Títulos e Valores Mobiliários Limitada is authorized and regulated by Comissão de Valores Mobiliários and Brazilian Central Bank; Western Asset Management Company Pty Ltd ABN 41 117 767 923 is the holder of the Australian Financial Services License 303160; Western Asset Management Company Pte. Ltd. Co. Reg. No. 200007692R is a holder of a Capital Markets Services License for fund management and regulated by the Monetary Authority of Singapore; Western Asset Management Company Ltd, a registered Financial Instruments Business Operator and regulated by the Financial Services Agency of Japan; and Western Asset Management Company Limited is authorised and regulated by the Financial Conduct Authority ("FCA") (FRN 145930). This communication is intended for distribution to Professional Clients only if deemed to be a financial promotion in the UK as defined by the FCA. This communication may also be intended for certain EEA countries where Western Asset has been granted permission to do so. For the current list of the approved EEA countries please contact Western Asset at +44 (0)20 7422 3000.