skip navigation
Blog

Stay up to date on timely topics and market events. Subscribe to our Blog now.

MARKETS
24 May 2022

Weekly Municipal Monitor—Relative Value Emerges

By Robert Amodeo, CFA, Rolf E. Lundelius, PhD, Sam Weitzman

Stay up to date on timely topics and market events. Subscribe to our Blog now.

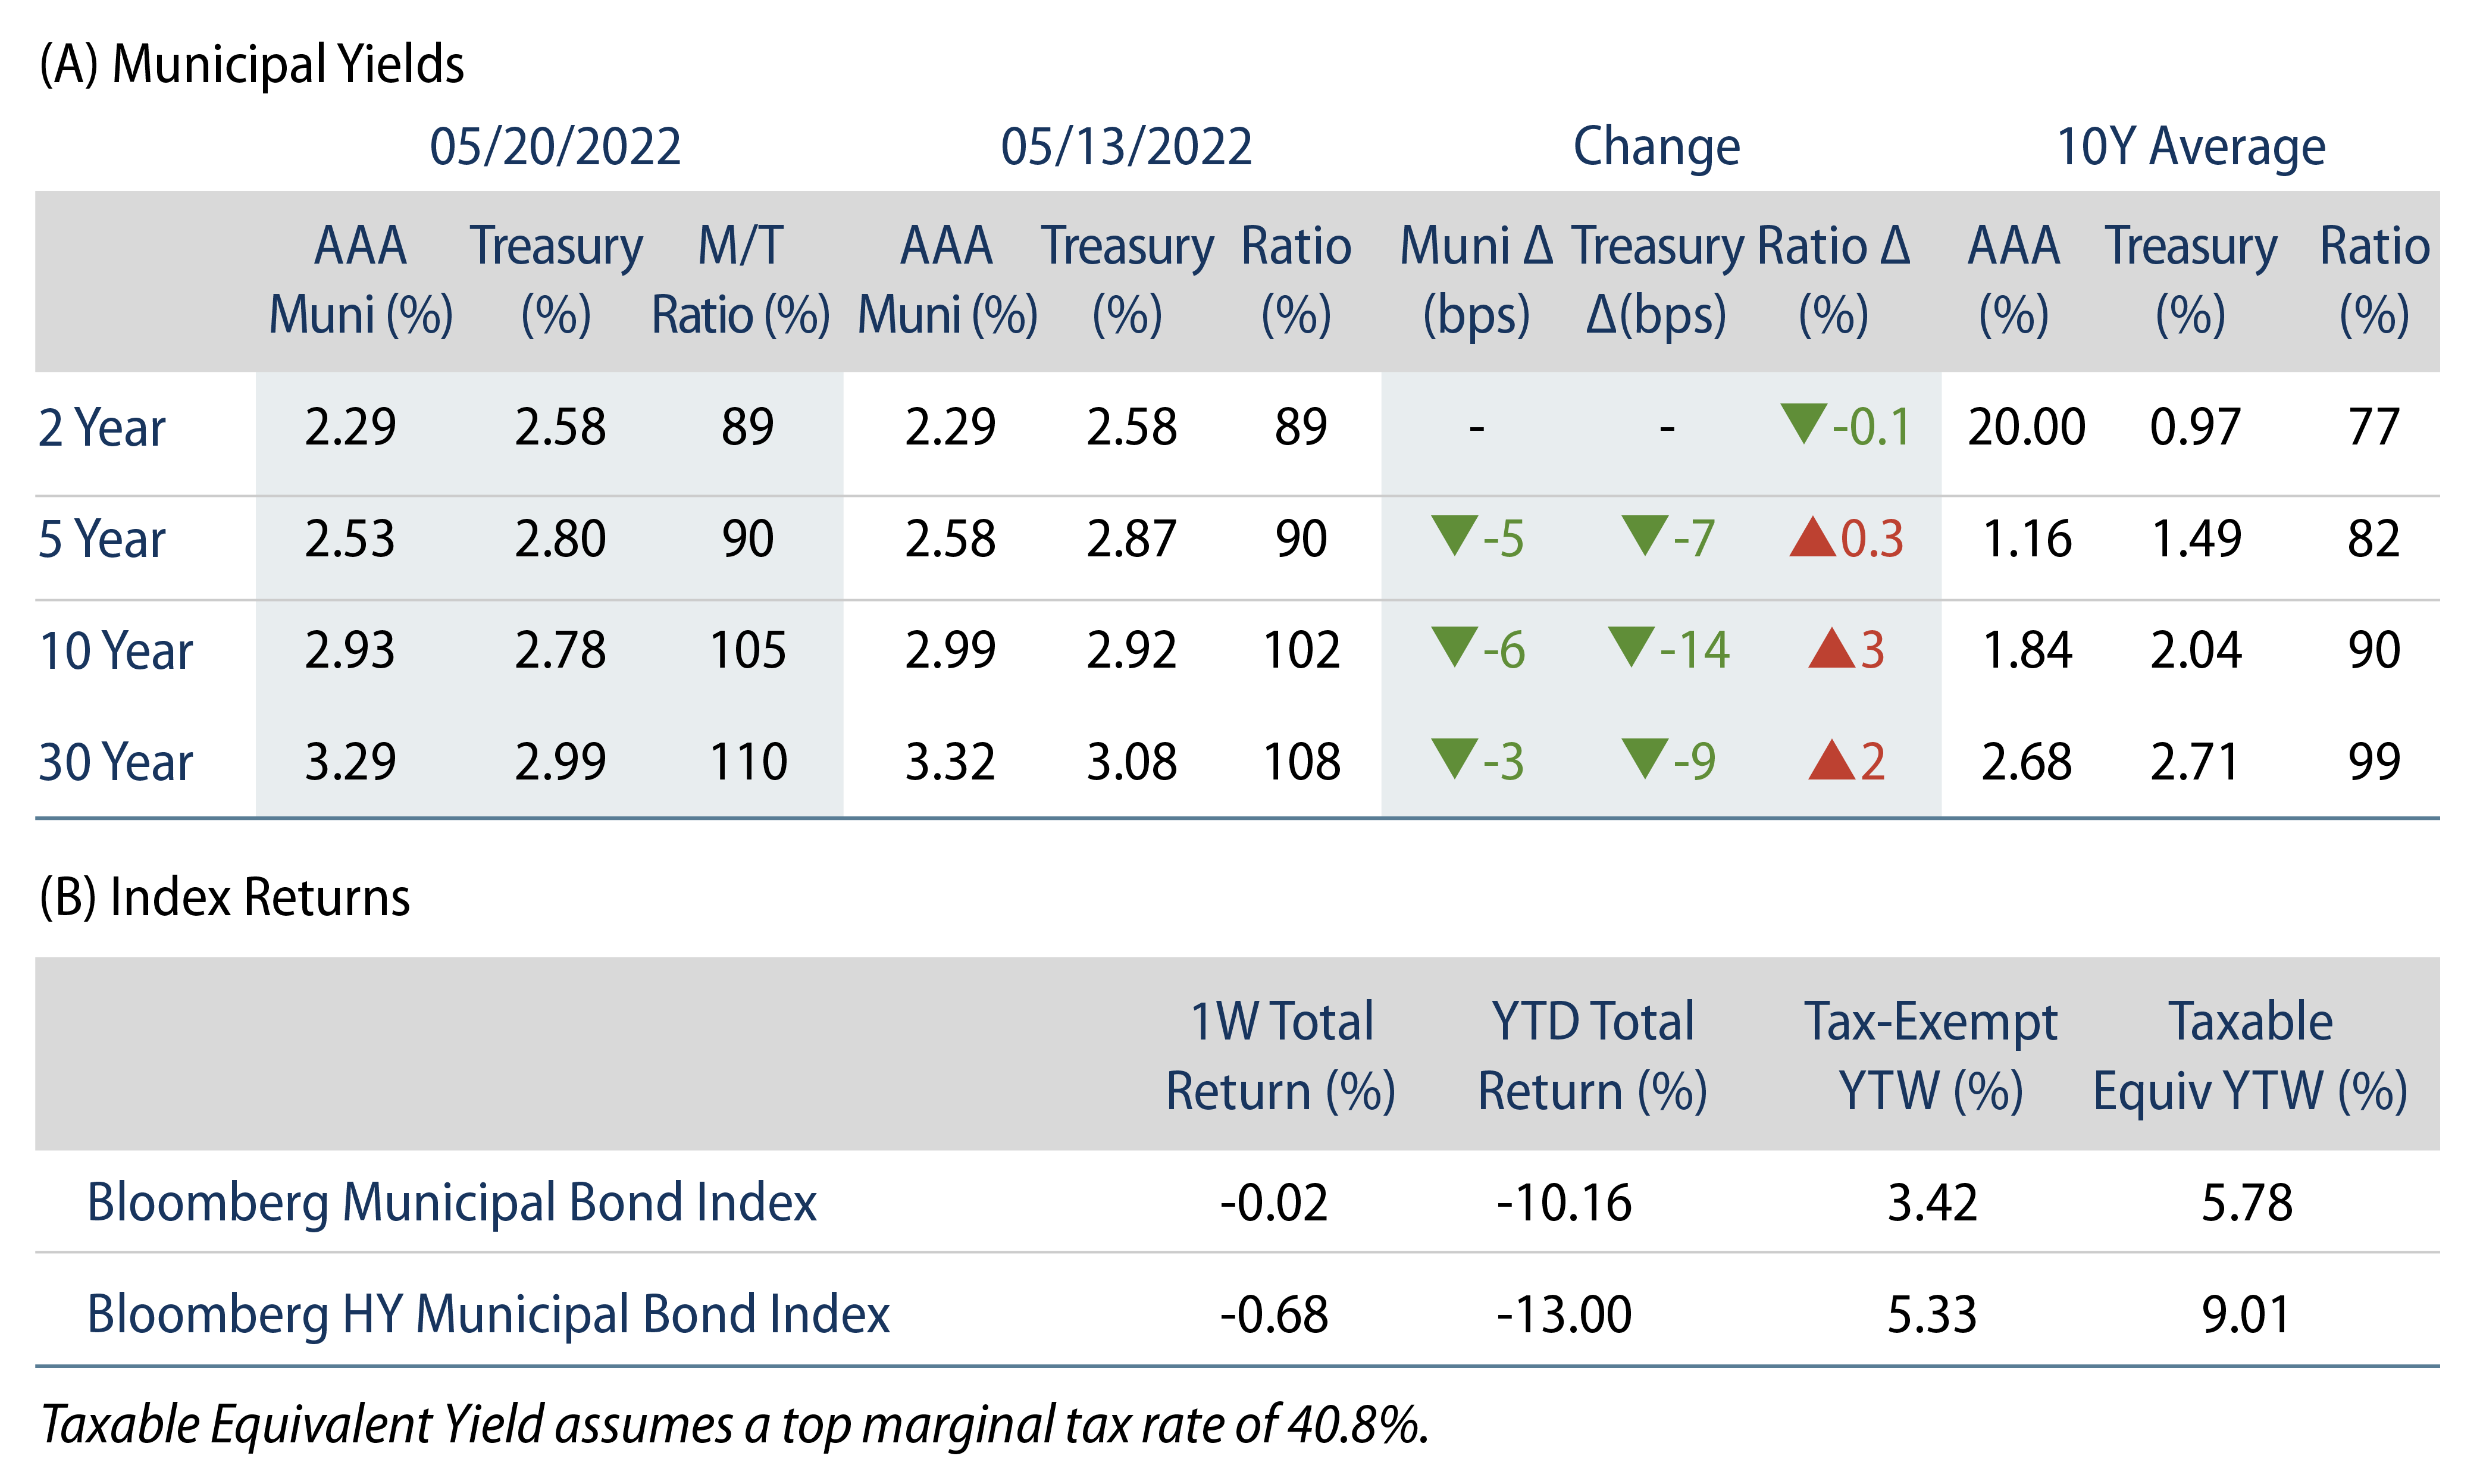
High-Grade Municipal Yields Declined During the Week

Muni yields trailed Treasuries lower last week, but major municipal indices posted negative total returns on spread widening. Munis underperformed the Treasury rally, resulting in Municipal/Treasury ratios exceeding 110% in 30-years. High-grade municipal yields moved 3-6 bps lower across the curve. Meanwhile, municipal mutual funds recorded a 19th consecutive week of net outflows. The Bloomberg Municipal Index returned -0.02%, while the HY Muni Index returned -0.68% as credit spreads widened. This week we highlight and evaluate tax-exempt relative value that has emerged amid underperformance so far year to date (YTD).

Weak Technicals Remain, Driven by Fund Outflows

Fund Flows: During the week ending May 18, weekly reporting municipal mutual funds recorded $2.7 billion of outflows, according to Lipper. Long-term funds recorded $2.3 billion of outflows, high-yield funds recorded $743 million of outflows and intermediate funds recorded $375 million of outflows. The week’s fund outflows extend the current outflow streak to 19 consecutive weeks, and contribute to $59 billion of YTD net outflows.

Supply: The muni market recorded $9.4 billion of new-issue volume, down 37% from the prior week. Total YTD issuance of $166 billion is 5% higher than last year’s levels, with tax-exempt issuance trending 15% higher year-over-year (YoY) and taxable issuance trending 26% lower YoY. This week’s new-issue calendar is expected to decline to $4 billion. Largest deals include $1.1 billion state of Connecticut and $268 million Katy Independent School District transactions.

This Week in Munis: Relative Value Emerges

As municipals continue to underperform other high-grade fixed-income sectors YTD, this week we highlight the relative value proposition that has emerged for income seekers subject to tax rates.

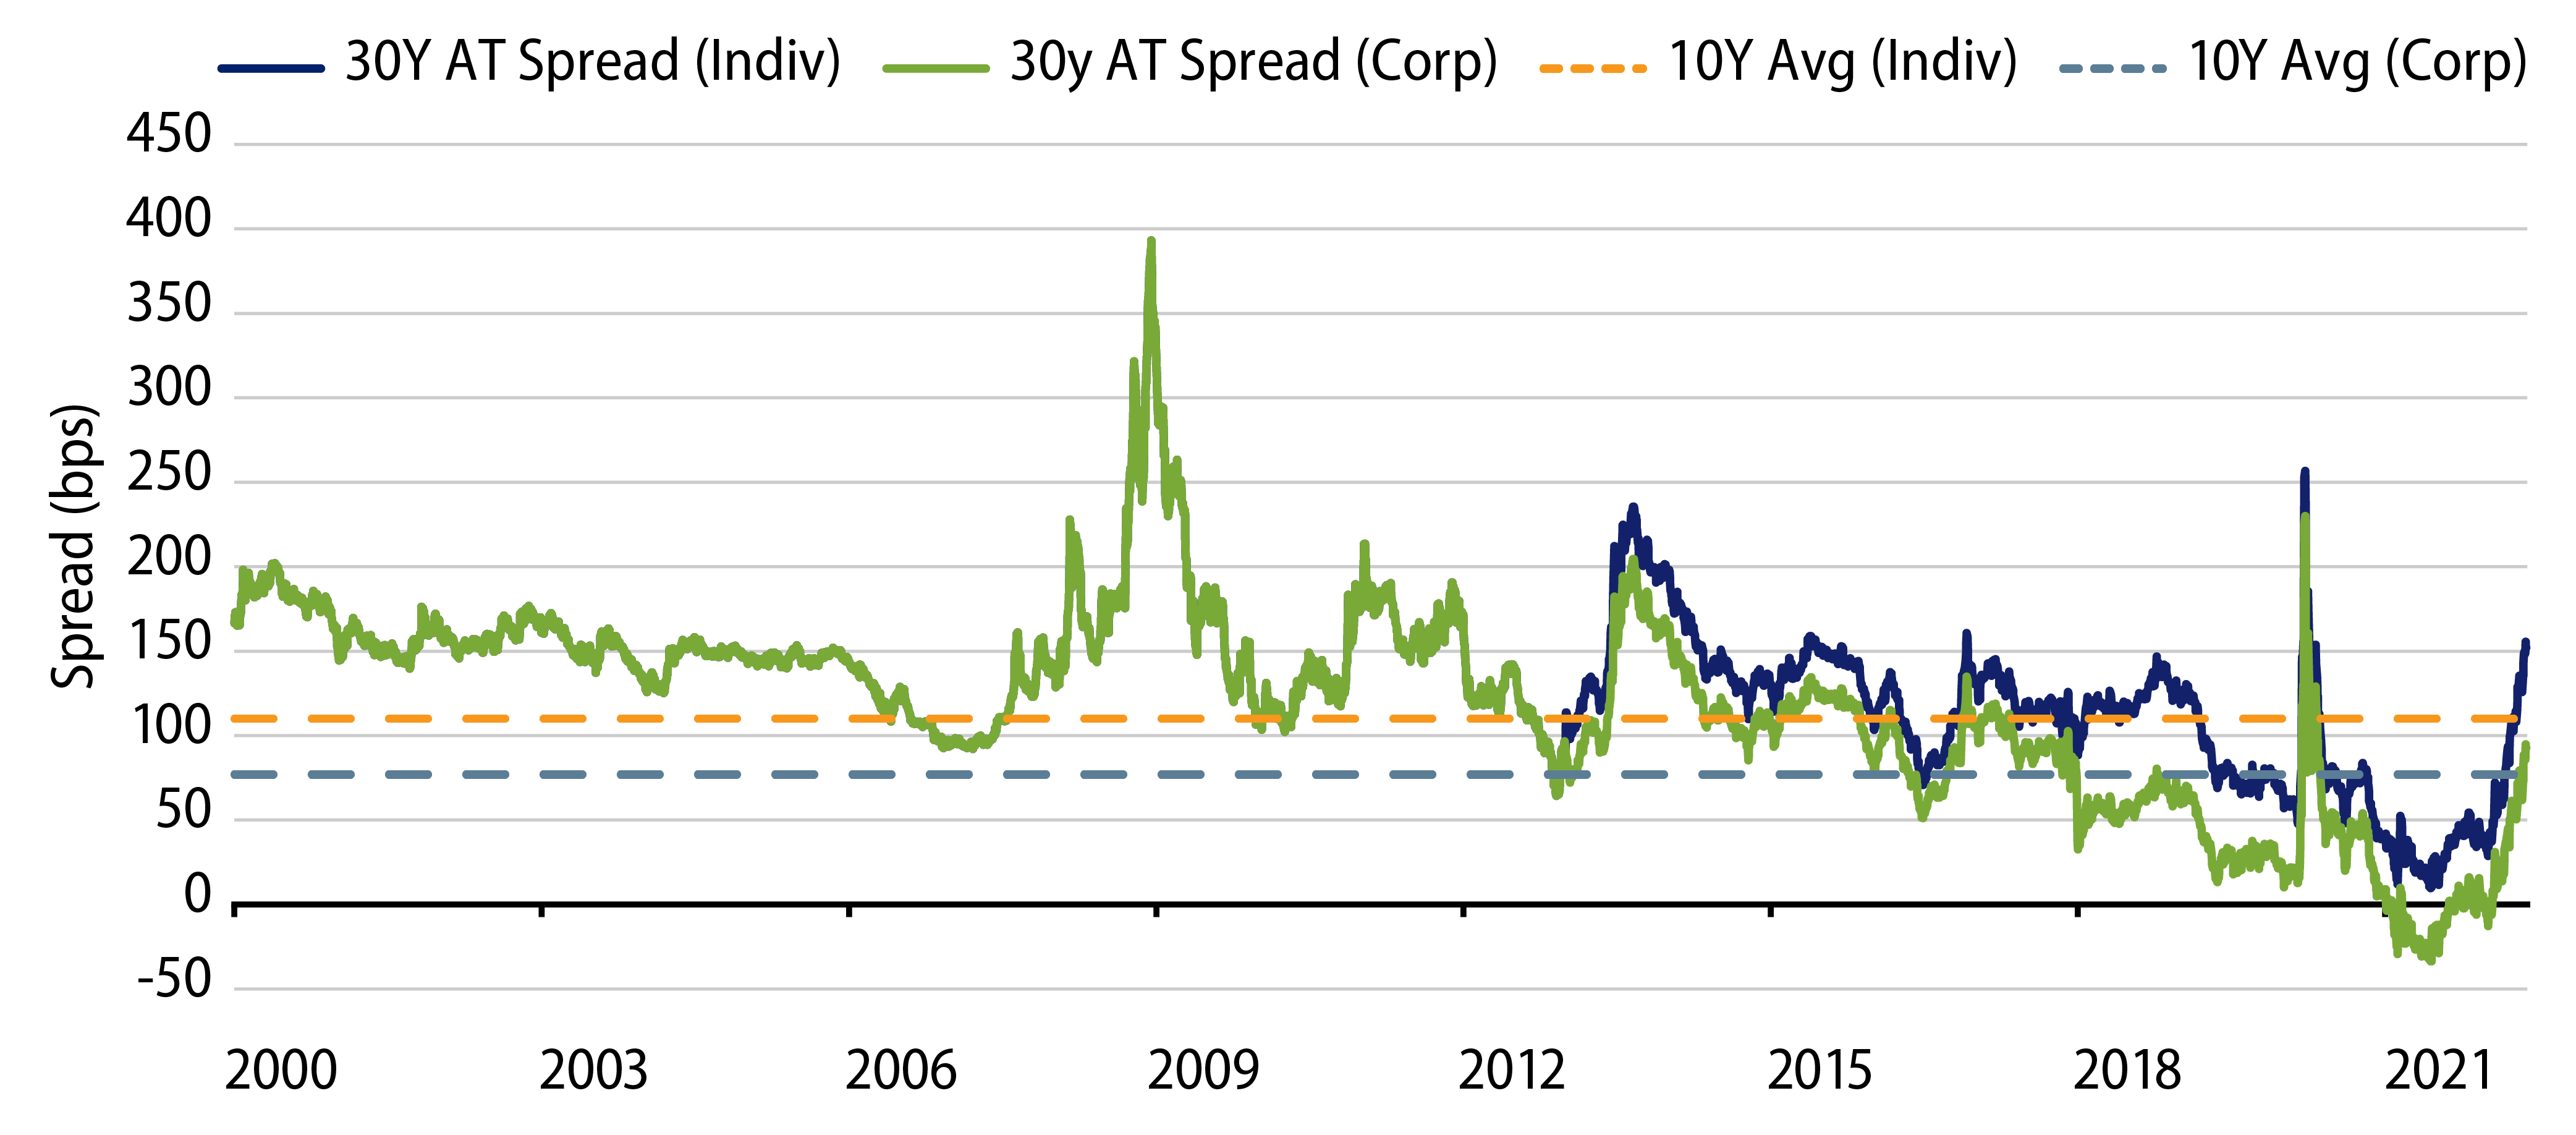
AAA Municipals Versus Treasuries. Perhaps the most referenced cross-asset relative value metric within the municipal market is the Municipal/Treasury ratio. As a fixed-income manager serving clients with a variety of tax rates, Western Asset also references the spread of the AAA Muni yield vs. the comparably structured Treasury yield after taxes, considering a variety of client tax rates (Exhibit 1). Notably in 2021, strong municipal outperformance drove after-tax relative value of munis vs. Treasuries to negative levels for the first time. Amid the volatility and the muni underperformance we observed thus far this year, 10- and 30- year Municipal to after-tax Treasury spreads have risen to the highest level since the 2020 pandemic drawdown period, and now exceed 10-year average levels. All else equal, an individual subject to the highest marginal tax bracket would receive an after-tax yield benefit of 150 bps by choosing a 30-year municipal vs. a comparable 30-year Treasury security.

Exhibit 1: 30-Year Muni-Treasury After-Tax Spread
Explore 30-Year Muni-Treasury After-Tax Spread
Source: Thomson Reuters MMD (Muni Yield), Bloomberg, Western Asset (Treasury Yield); considering the top marginal corporate and individual federal tax rates. As of 19 May 22. Select the image to expand the view.

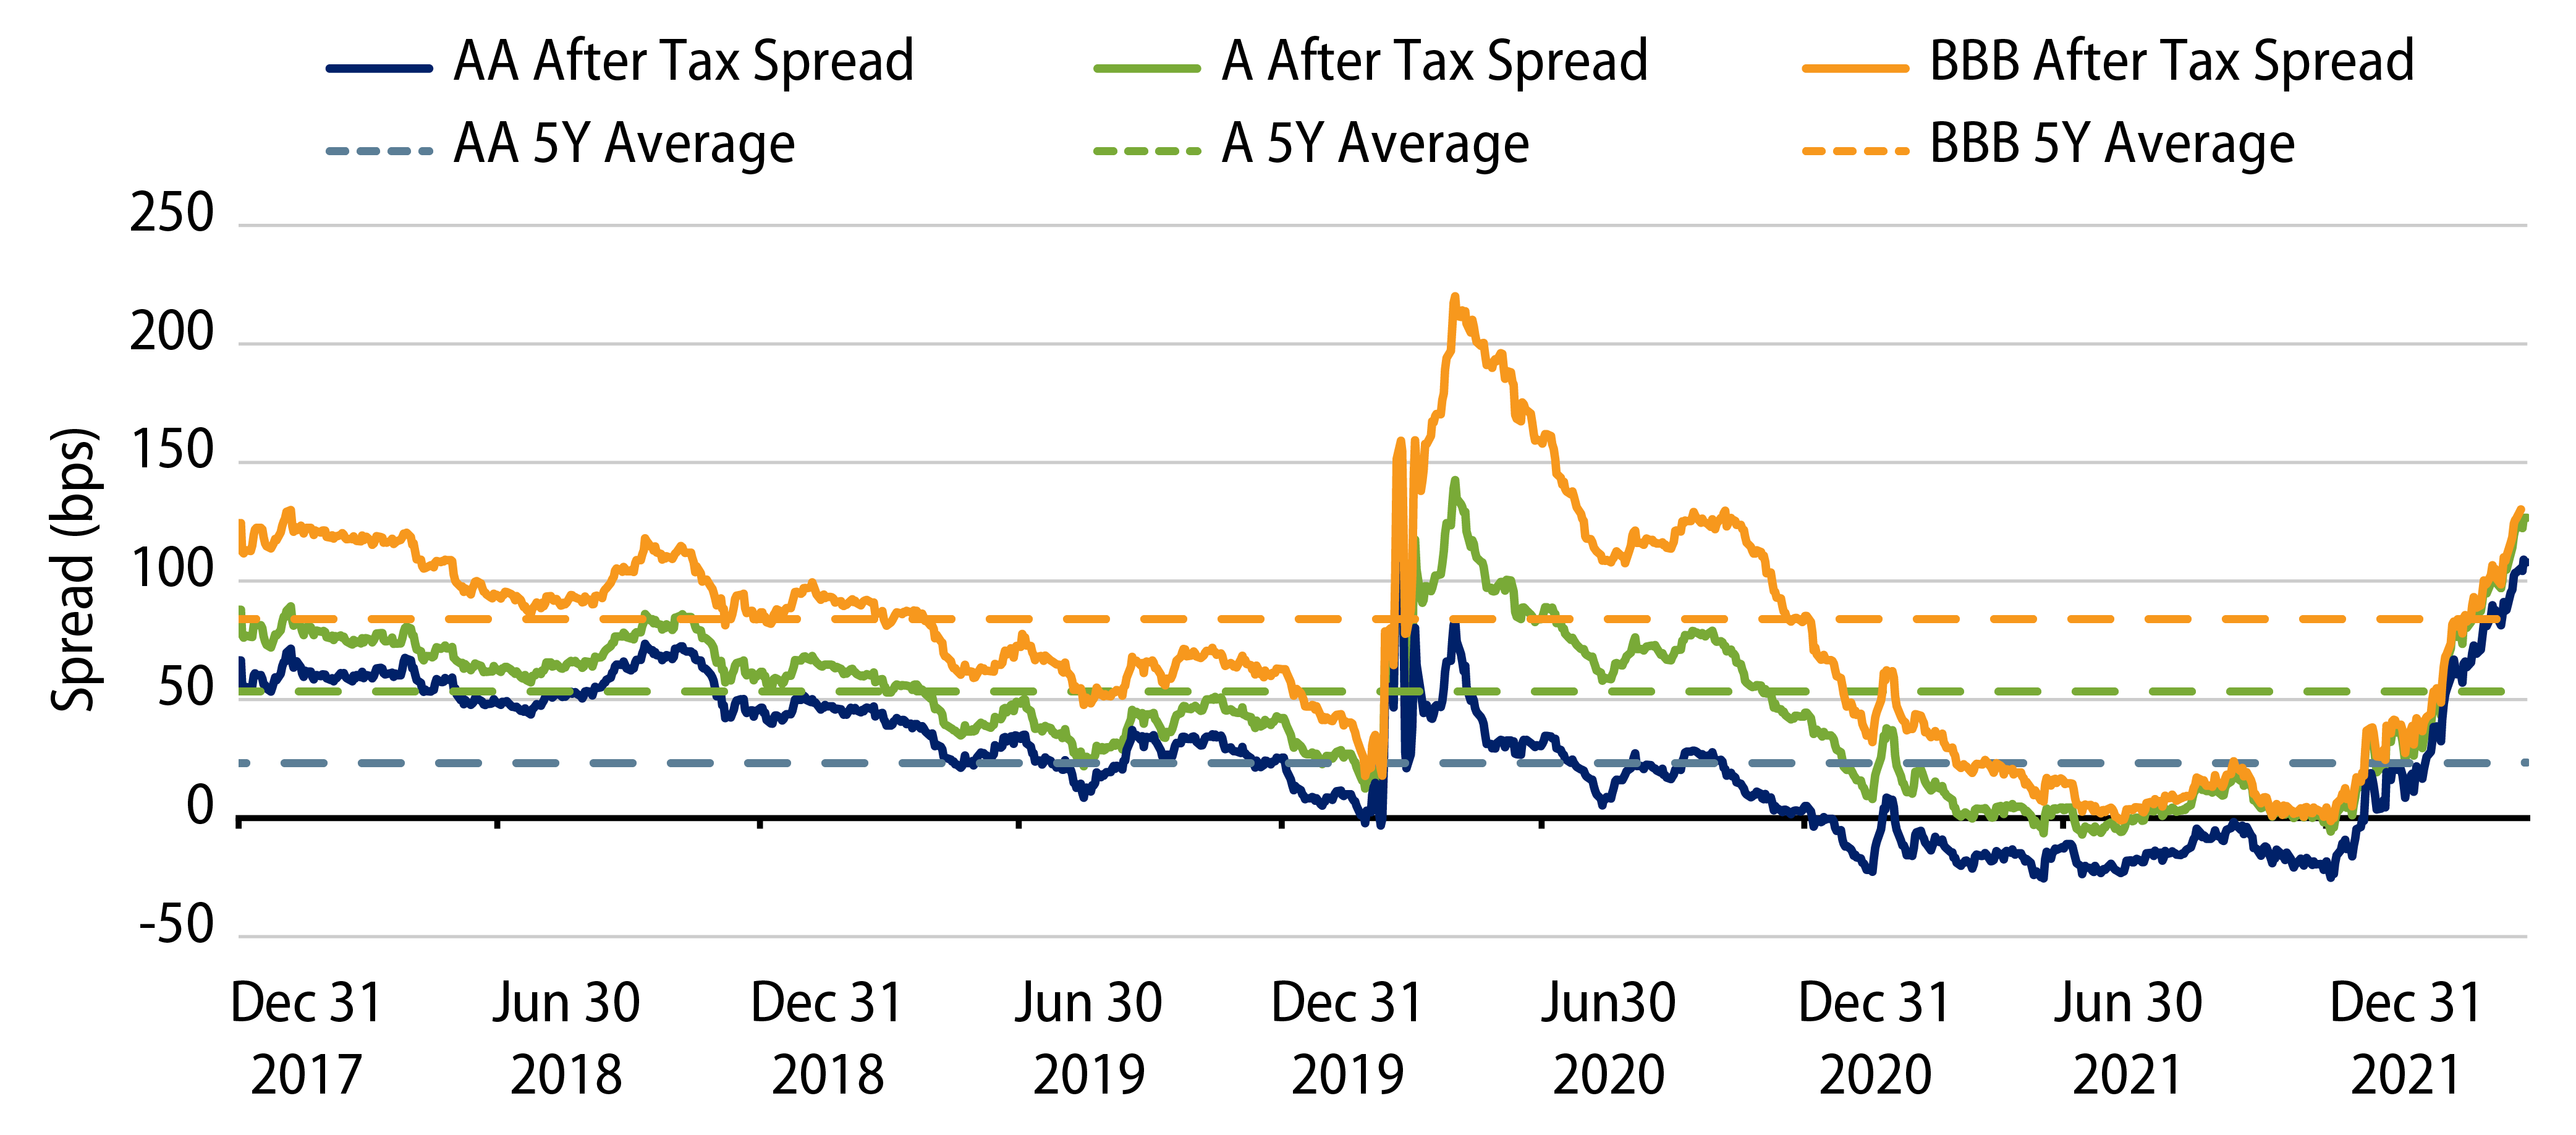
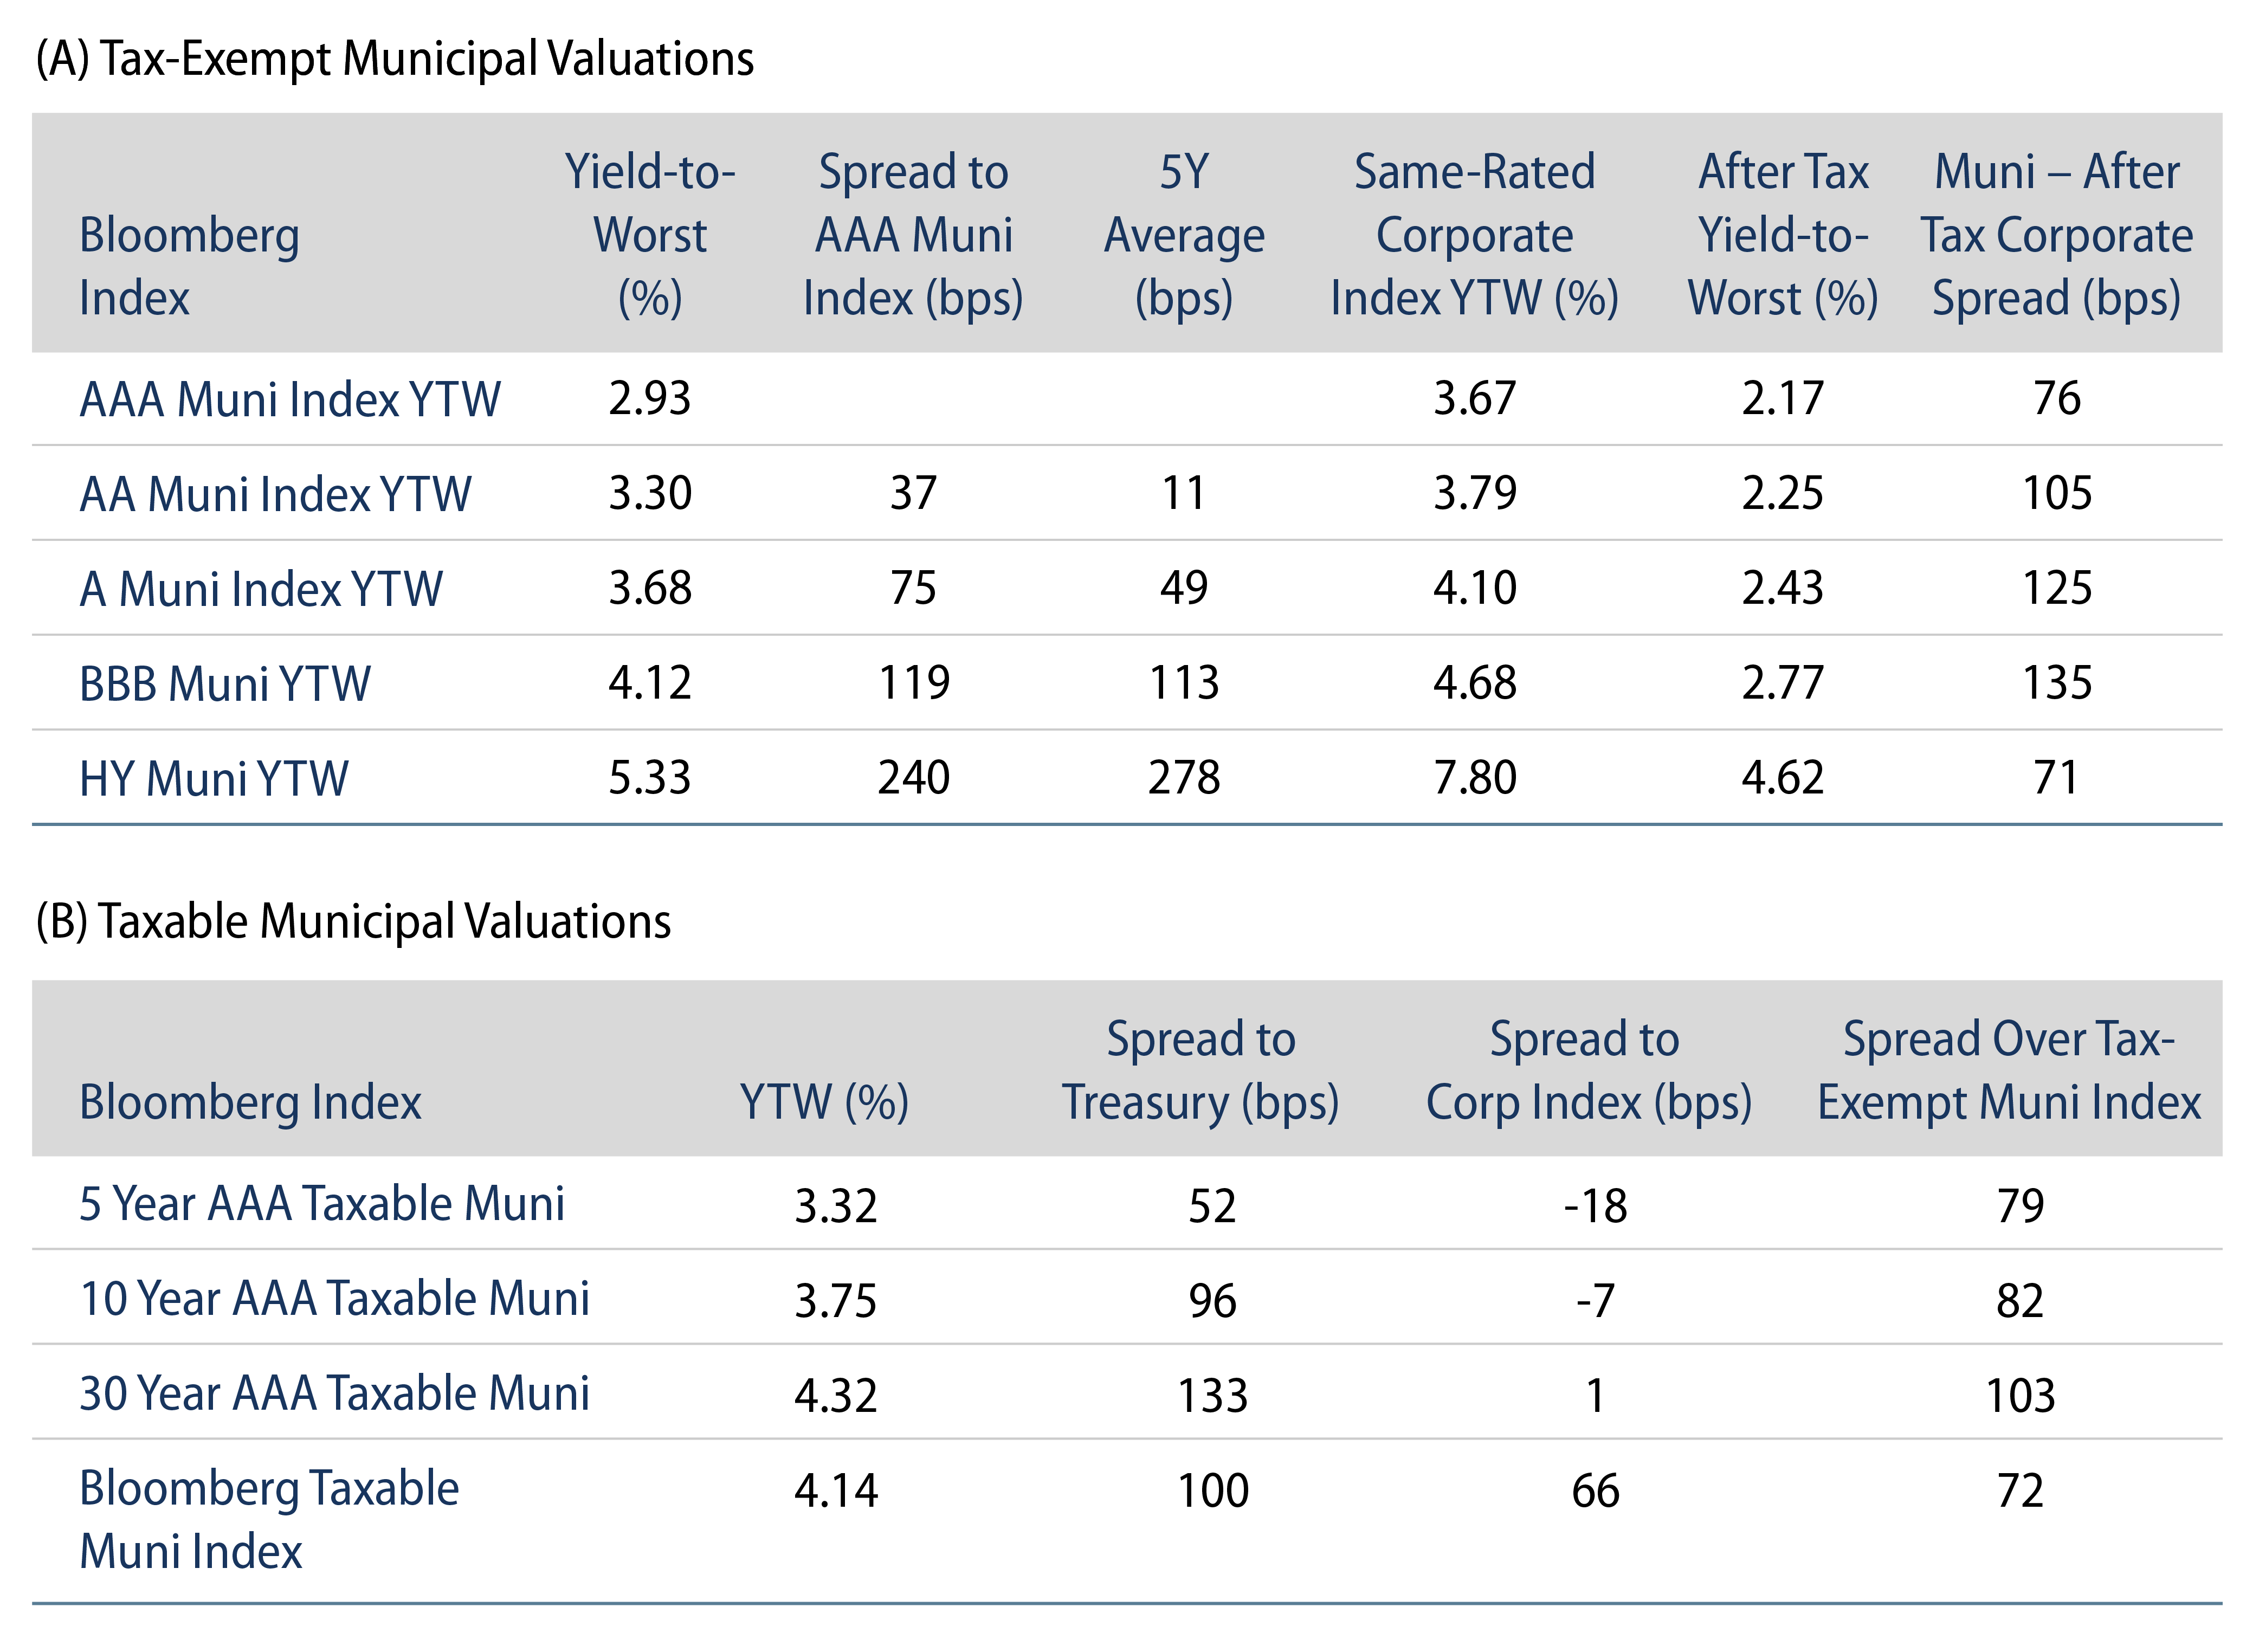
Municipals Versus Corporates. The relative value of the credit-oriented segment of the municipal market can be assessed against like-quality rated cohorts of taxable markets. Exhibit 2 demonstrates the spread between the AA, A and BBB Bloomberg municipal yields versus the respective Bloomberg corporate index. Over the past decade, the tax-exempt structure of the municipal market has provided 23-84 bps of average incremental after-tax yield versus the respective Bloomberg corporate index. At the end of 2021, for the first time, municipal-to-after tax corporate spreads reached negative levels across investment-grade credit cohorts, implying that a taxpayer in the highest marginal tax rate would be better off on an after-tax yield basis in the taxable asset class. This year’s volatility and muni underperformance has since increased the after-tax spread back to positive levels, and well above historical averages.

Exhibit 2: Investment-Grade Munis—After-Tax Corporate Spreads
Explore Investment-Grade Munis—After-Tax Corporate Spreads
Source: Bloomberg, Western Asset; considering the top marginal corporate and individual federal tax rates. As of 19 May 22. Select the image to expand the view.

The relative value proposition versus corporates was certainly apparent in the market last week at the issuer level as Duke Energy, an issuer that accesses tax-exempt and taxable municipal markets, priced a new tax-exempt issue in the municipal market at a 4.25% tax-exempt yield-to-worst, higher than the similarly structured taxable yield of 4.17%. For an individual taxpayer in the top tax bracket, the relative value of the same-obligor municipal security represents an after-tax yield pick-up of 178 bps.

The path of inflation and interest rates is uncertain, which can continue to challenge valuations across asset classes. However, when considering YTD municipal underperformance compared to taxable assets, municipals screen increasingly attractive for income-seeking individuals and corporations subject to federal income taxes. In a market that is searching for demand to return to the asset class, this relative value proposition is just one factor that can attract both individual and institutional crossover buyers.

Exhibit 3: Municipal Bond Yields and Index Return
Explore Municipal Bond Yields and Index Return
Source: Bloomberg. As of 20 May 22. Select the image to expand the view.
Exhibit 4: Tax-Exempt and Taxable Muni Valuations
Explore Tax-Exempt and Taxable Muni Valuations
Source: Bloomberg. As of 20 May 22. Select the image to expand the view.
© Western Asset Management Company, LLC 2024. The information contained in these materials ("the materials") is intended for the exclusive use of the designated recipient ("the recipient"). This information is proprietary and confidential and may contain commercially sensitive information, and may not be copied, reproduced or republished, in whole or in part, without the prior written consent of Western Asset Management Company ("Western Asset").
Past performance does not predict future returns. These materials should not be deemed to be a prediction or projection of future performance. These materials are intended for investment professionals including professional clients, eligible counterparties, and qualified investors only.
These materials have been produced for illustrative and informational purposes only. These materials contain Western Asset's opinions and beliefs as of the date designated on the materials; these views are subject to change and may not reflect real-time market developments and investment views.
Third party data may be used throughout the materials, and this data is believed to be accurate to the best of Western Asset's knowledge at the time of publication, but cannot be guaranteed. These materials may also contain strategy or product awards or rankings from independent third parties or industry publications which are based on unbiased quantitative and/or qualitative information determined independently by each third party or publication. In some cases, Western Asset may subscribe to these third party's standard industry services or publications. These standard subscriptions and services are available to all asset managers and do not influence rankings or awards in any way.
Investment strategies or products discussed herein may involve a high degree of risk, including the loss of some or all capital. Investments in any products or strategies described in these materials may be volatile, and investors should have the financial ability and willingness to accept such risks.
Unless otherwise noted, investment performance contained in these materials is reflective of a strategy composite. All other strategy data and information included in these materials reflects a representative portfolio which is an account in the composite that Western Asset believes most closely reflects the current portfolio management style of the strategy. Performance is not a consideration in the selection of the representative portfolio. The characteristics of the representative portfolio shown may differ from other accounts in the composite. Information regarding the representative portfolio and the other accounts in the composite are available upon request. Statements in these materials should not be considered investment advice. References, either general or specific, to securities and/or issuers in the materials are for illustrative purposes only and are not intended to be, and should not be interpreted as, recommendation to purchase or sell such securities. Employees and/or clients of Western Asset may have a position in the securities or issuers mentioned.
These materials are not intended to provide, and should not be relied on for, accounting, legal, tax, investment or other advice. The recipient should consult its own counsel, accountant, investment, tax, and any other advisers for this advice, including economic risks and merits, related to making an investment with Western Asset. The recipient is responsible for observing the applicable laws and regulations of their country of residence.
Founded in 1971, Western Asset Management Company is a global fixed-income investment manager with offices in Pasadena, New York, London, Singapore, Tokyo, Melbourne, São Paulo, Hong Kong, and Zürich. Western Asset is a wholly owned subsidiary of Franklin Resources, Inc. but operates autonomously. Western Asset is comprised of six legal entities across the globe, each with distinct regional registrations: Western Asset Management Company, LLC, a registered Investment Adviser with the Securities and Exchange Commission; Western Asset Management Company Distribuidora de Títulos e Valores Mobiliários Limitada is authorized and regulated by Comissão de Valores Mobiliários and Brazilian Central Bank; Western Asset Management Company Pty Ltd ABN 41 117 767 923 is the holder of the Australian Financial Services License 303160; Western Asset Management Company Pte. Ltd. Co. Reg. No. 200007692R is a holder of a Capital Markets Services License for fund management and regulated by the Monetary Authority of Singapore; Western Asset Management Company Ltd, a registered Financial Instruments Business Operator and regulated by the Financial Services Agency of Japan; and Western Asset Management Company Limited is authorised and regulated by the Financial Conduct Authority ("FCA") (FRN 145930). This communication is intended for distribution to Professional Clients only if deemed to be a financial promotion in the UK as defined by the FCA. This communication may also be intended for certain EEA countries where Western Asset has been granted permission to do so. For the current list of the approved EEA countries please contact Western Asset at +44 (0)20 7422 3000.