skip navigation
Blog

Stay up to date on timely topics and market events. Subscribe to our Blog now.

MARKETS
17 May 2022

Weekly Municipal Monitor—Putting YTD Performance in Context

By Rolf E. Lundelius, PhD

Stay up to date on timely topics and market events. Subscribe to our Blog now.

Municipals Recorded Negative Returns

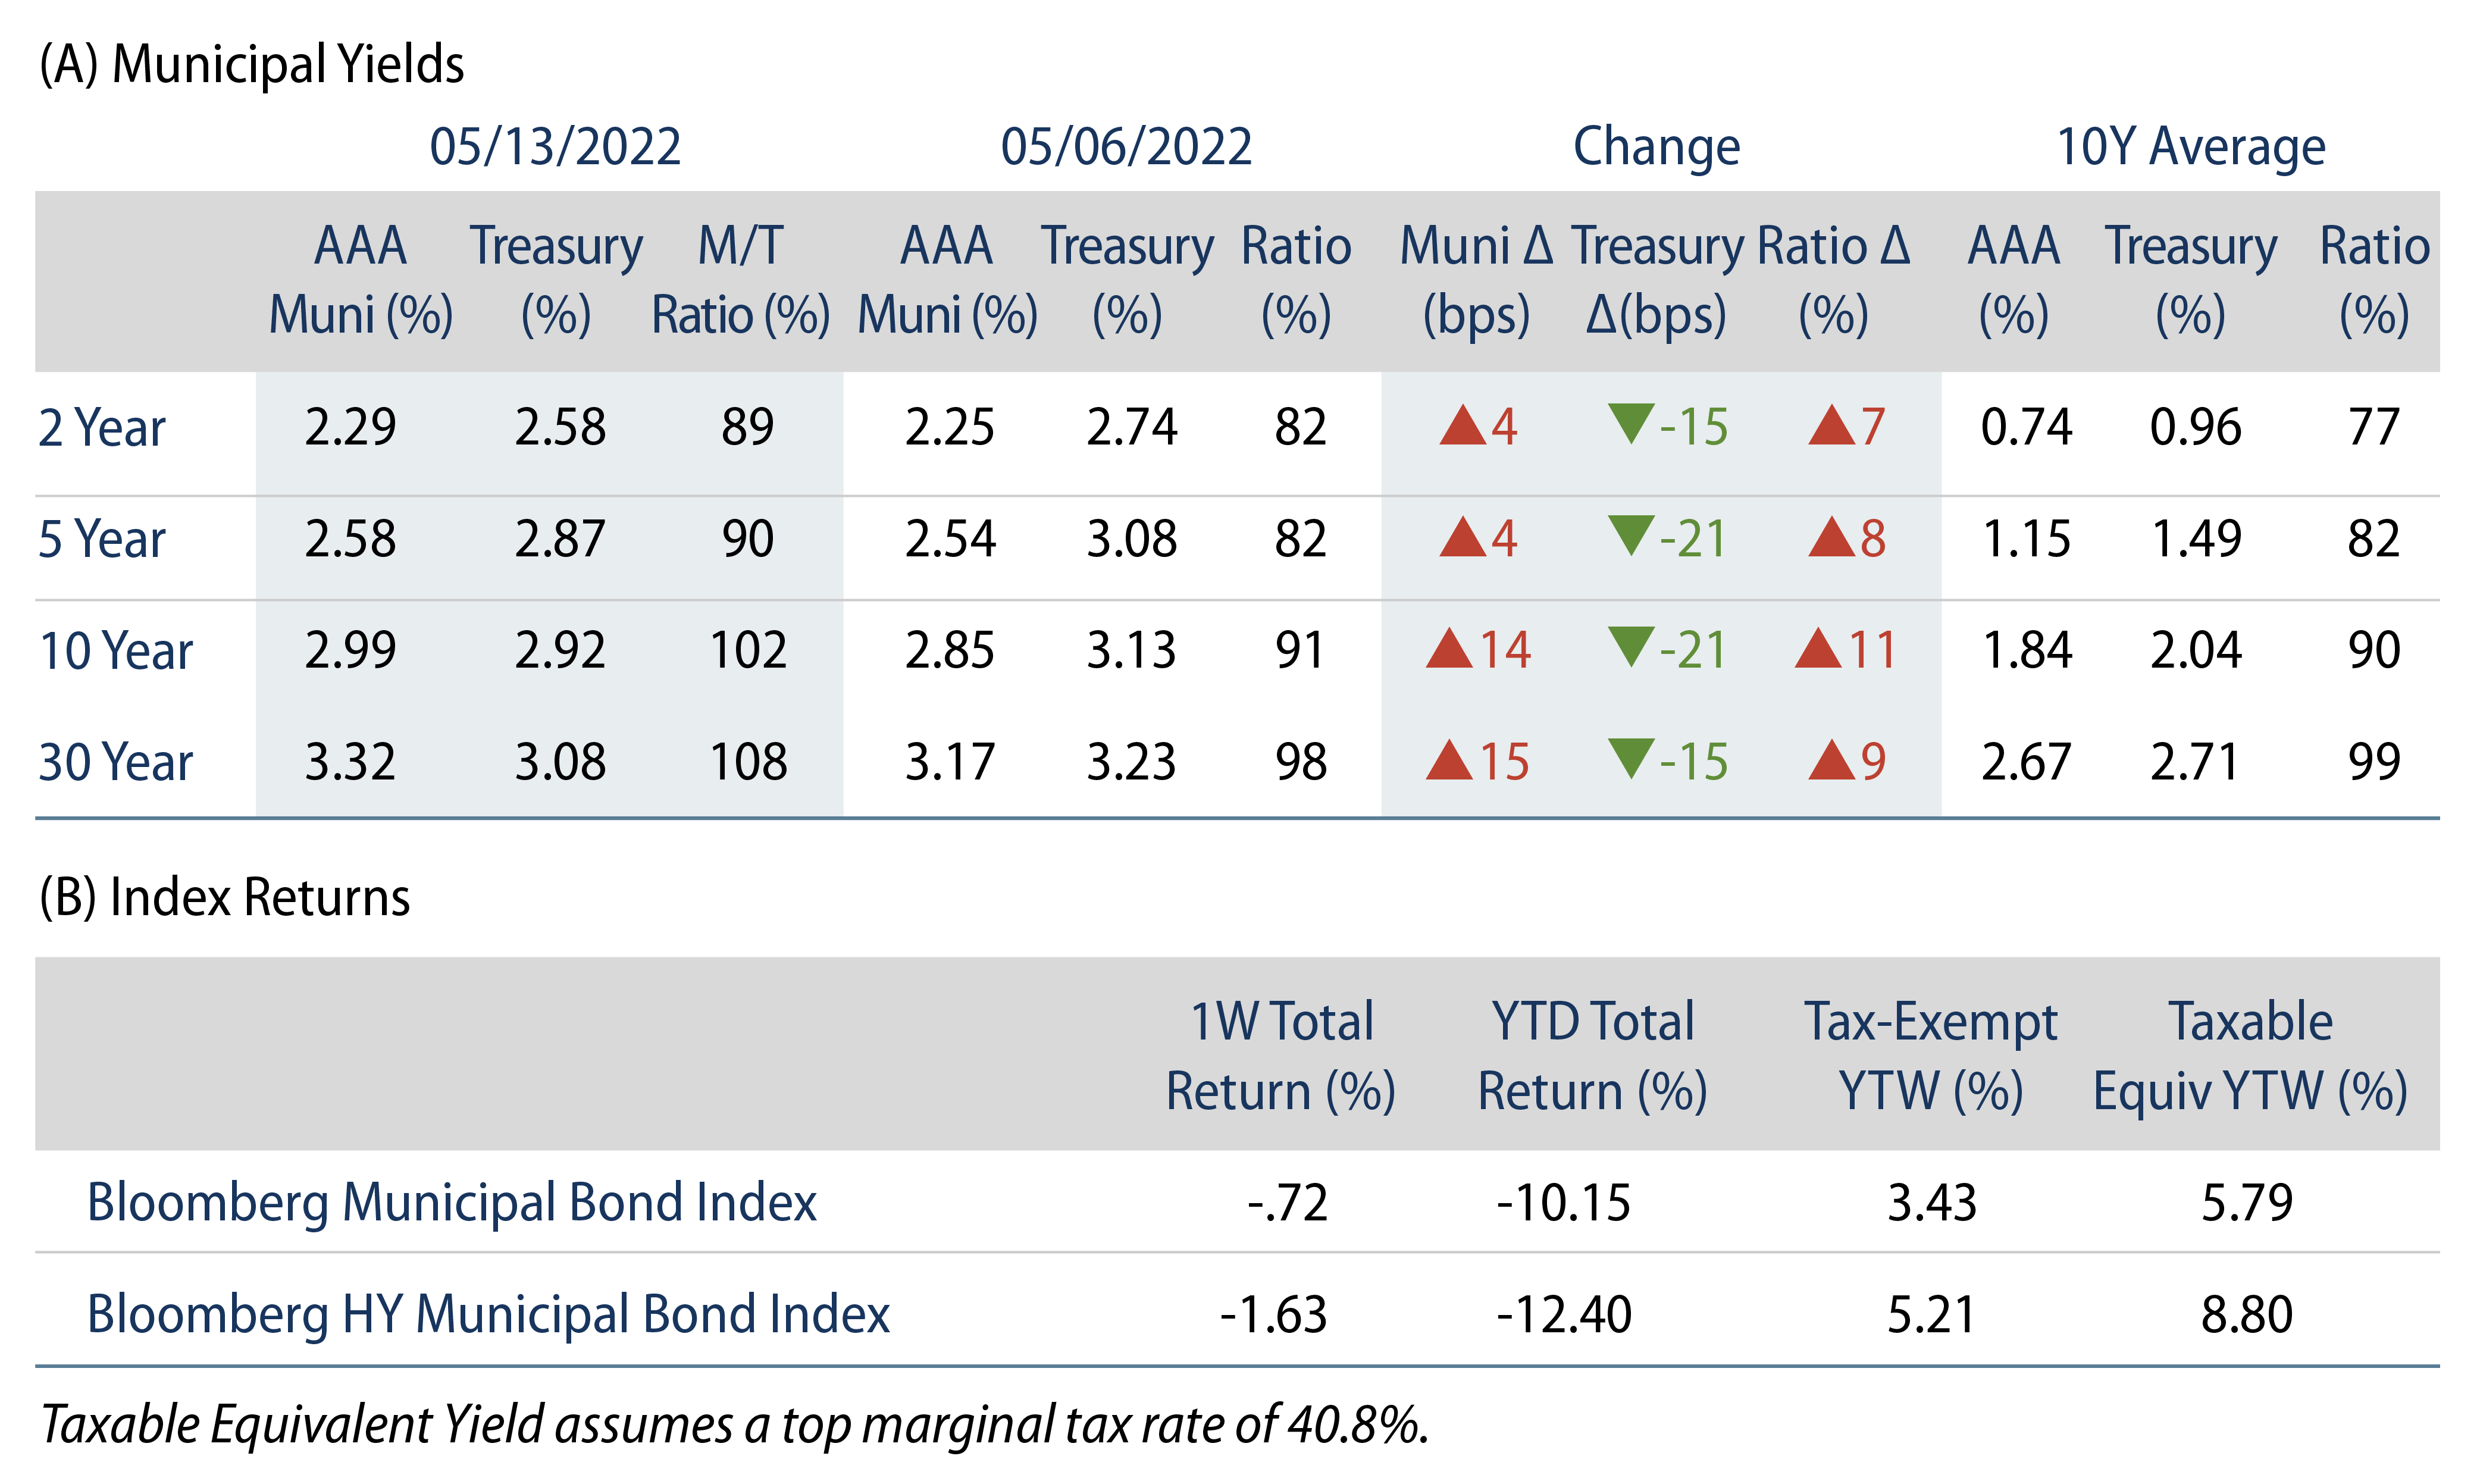
Negative muni returns continued last week despite a Treasury rally. Munis significantly underperformed the Treasury rally, resulting in Municipal/Treasury ratios exceeding 100% in 10- and 30-years. High-grade municipal yields moved 4-15 basis points (bps) higher across the curve as Municipal fund outflows persisted for an 18th consecutive week. The Bloomberg Municipal Index returned -0.72%, while the HY Muni Index returned -1.63%. This week we highlight and evaluate year-to-date (YTD) performance in the context of relative valuation and structural factors.

Municipal Technicals Remained Weak Amid Persistent Outflows and Elevated Supply

Fund Flows: During the week ending May 11, weekly reporting municipal mutual funds recorded $2.4 billion of outflows, according to Lipper. Long-term funds recorded $1.5 billion of outflows, high-yield funds recorded $825 million of outflows and intermediate funds recorded $656 million of outflows. The week’s fund outflows extend the current outflow streak to 18 consecutive weeks, and contribute to $55 billion of YTD net outflows.

Supply: The muni market recorded $15 billion of new-issue volume, up over 3x from the prior week. Total YTD issuance of $156 billion is 3% higher from last year’s levels, with tax-exempt issuance trending 13% higher year-over-year (YoY) and taxable issuance trending 25% lower YoY. This week’s new-issue calendar is expected to decline to $5 billion. Largest deals include $1.7 billion State of Illinois and $468 million Gilbert Water Resources Municipal Property Corporation transactions.

This Week in Munis: Putting YTD Performance in Context

This year’s global market downturn has led to an unpleasant surprise for municipal investors that often view their municipal allocation as a ballast. However, from a quantitative perspective, the poor performance of municipals can be explained by their underlying risk factors, and is not reflective of credit concerns or an unexplained dislocation in the municipal market.

Exhibit 1: Municipal vs. Treasury Aggregate Returns
Explore Municipal vs. Treasury Aggregate Returns
Source: Bloomberg. As of 13 May 22. Select the image to expand the view.

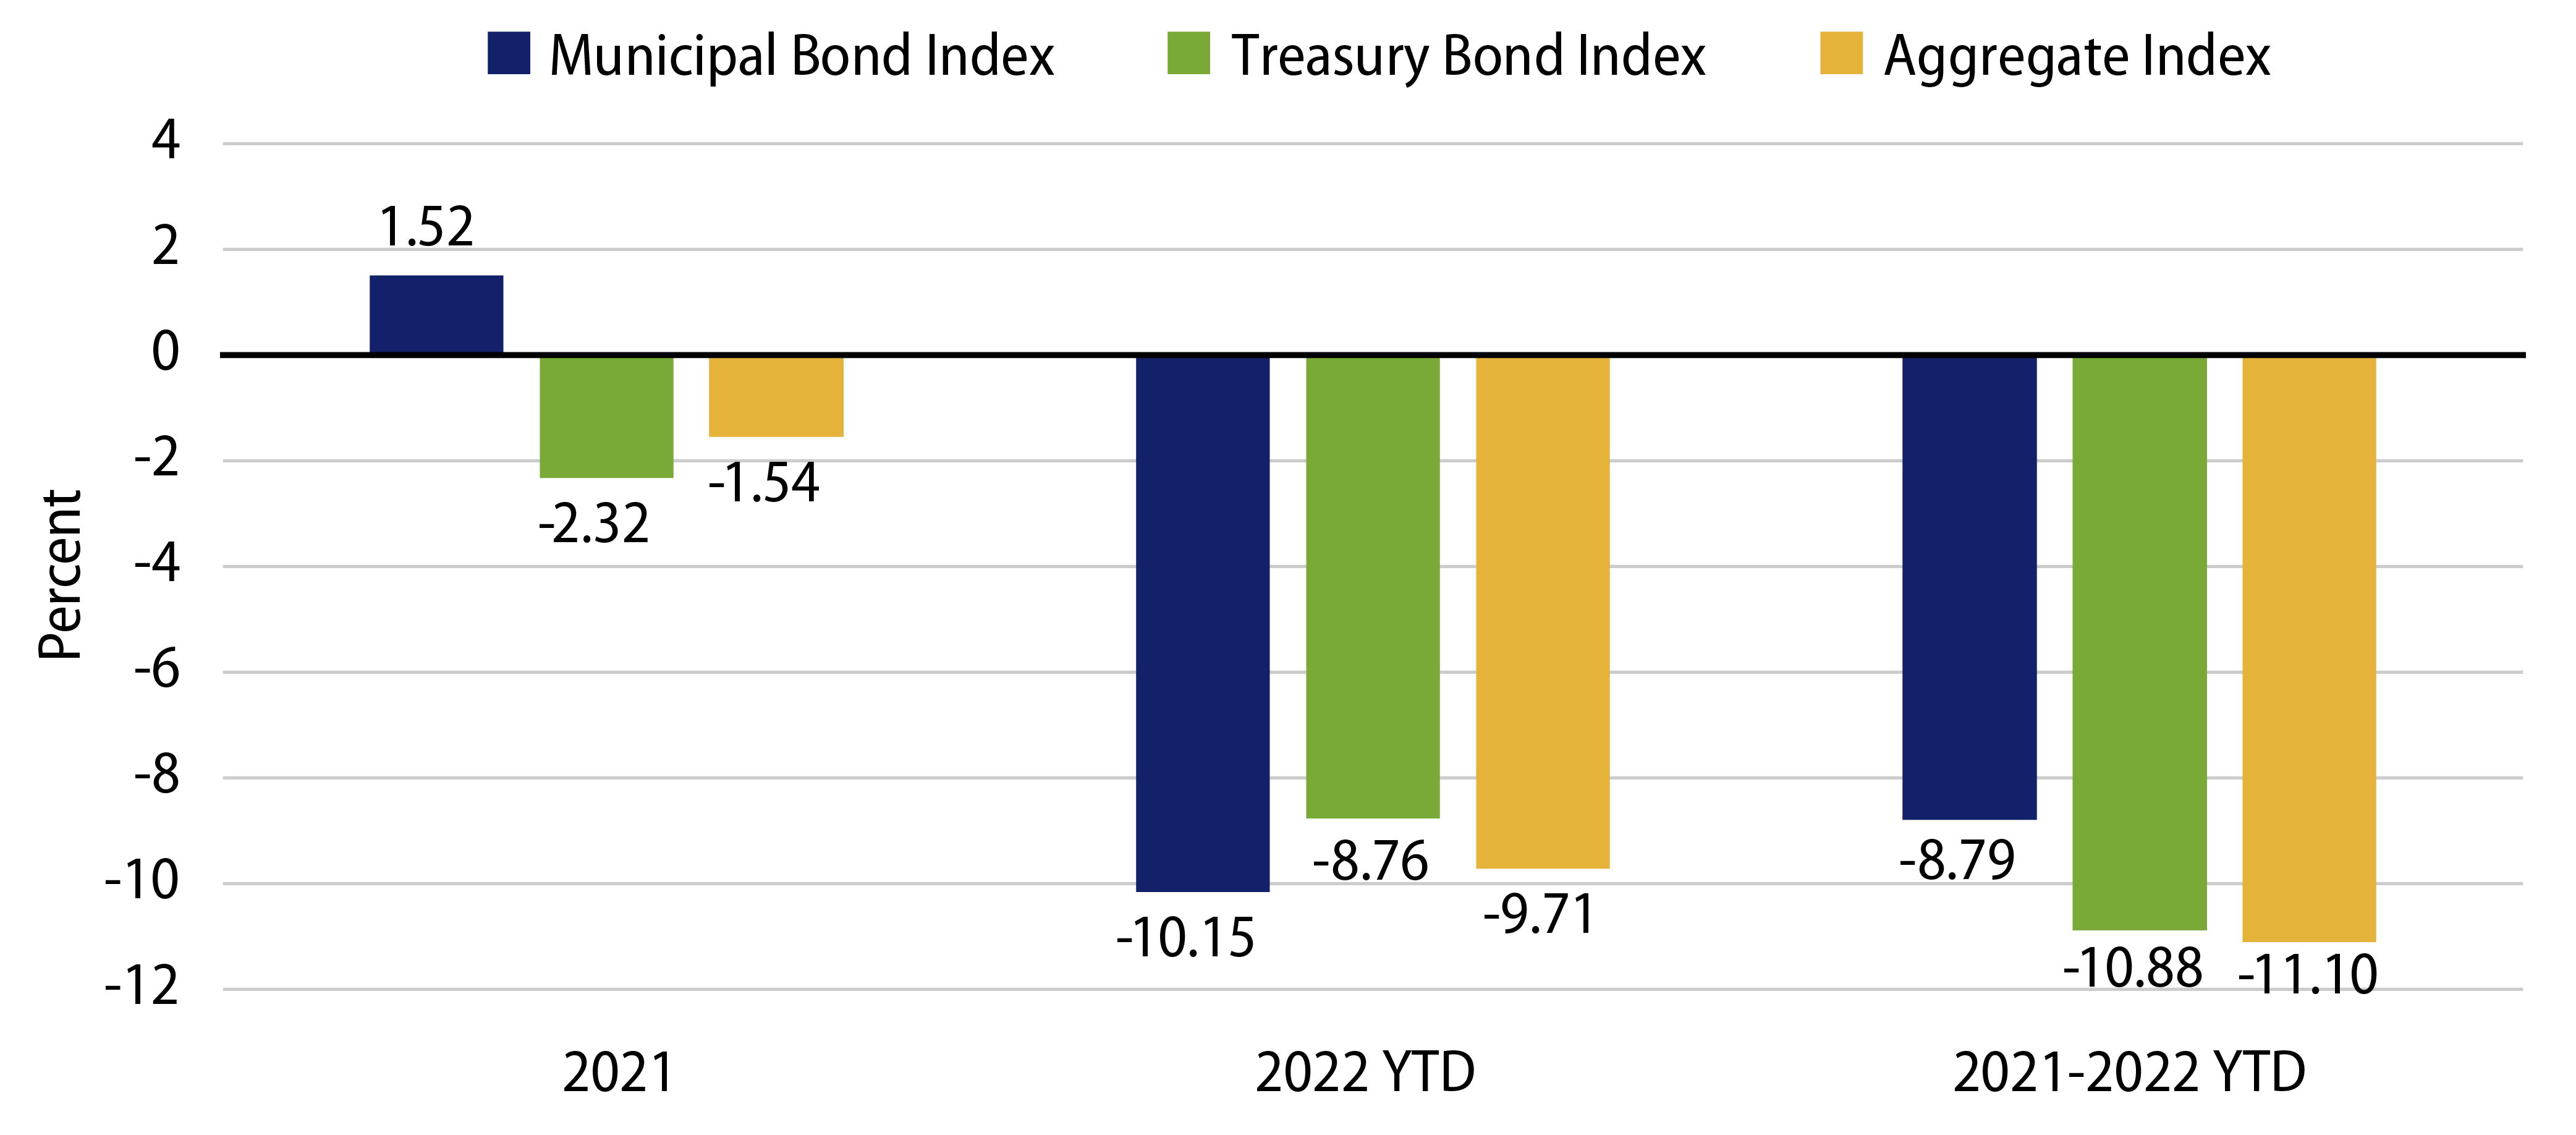
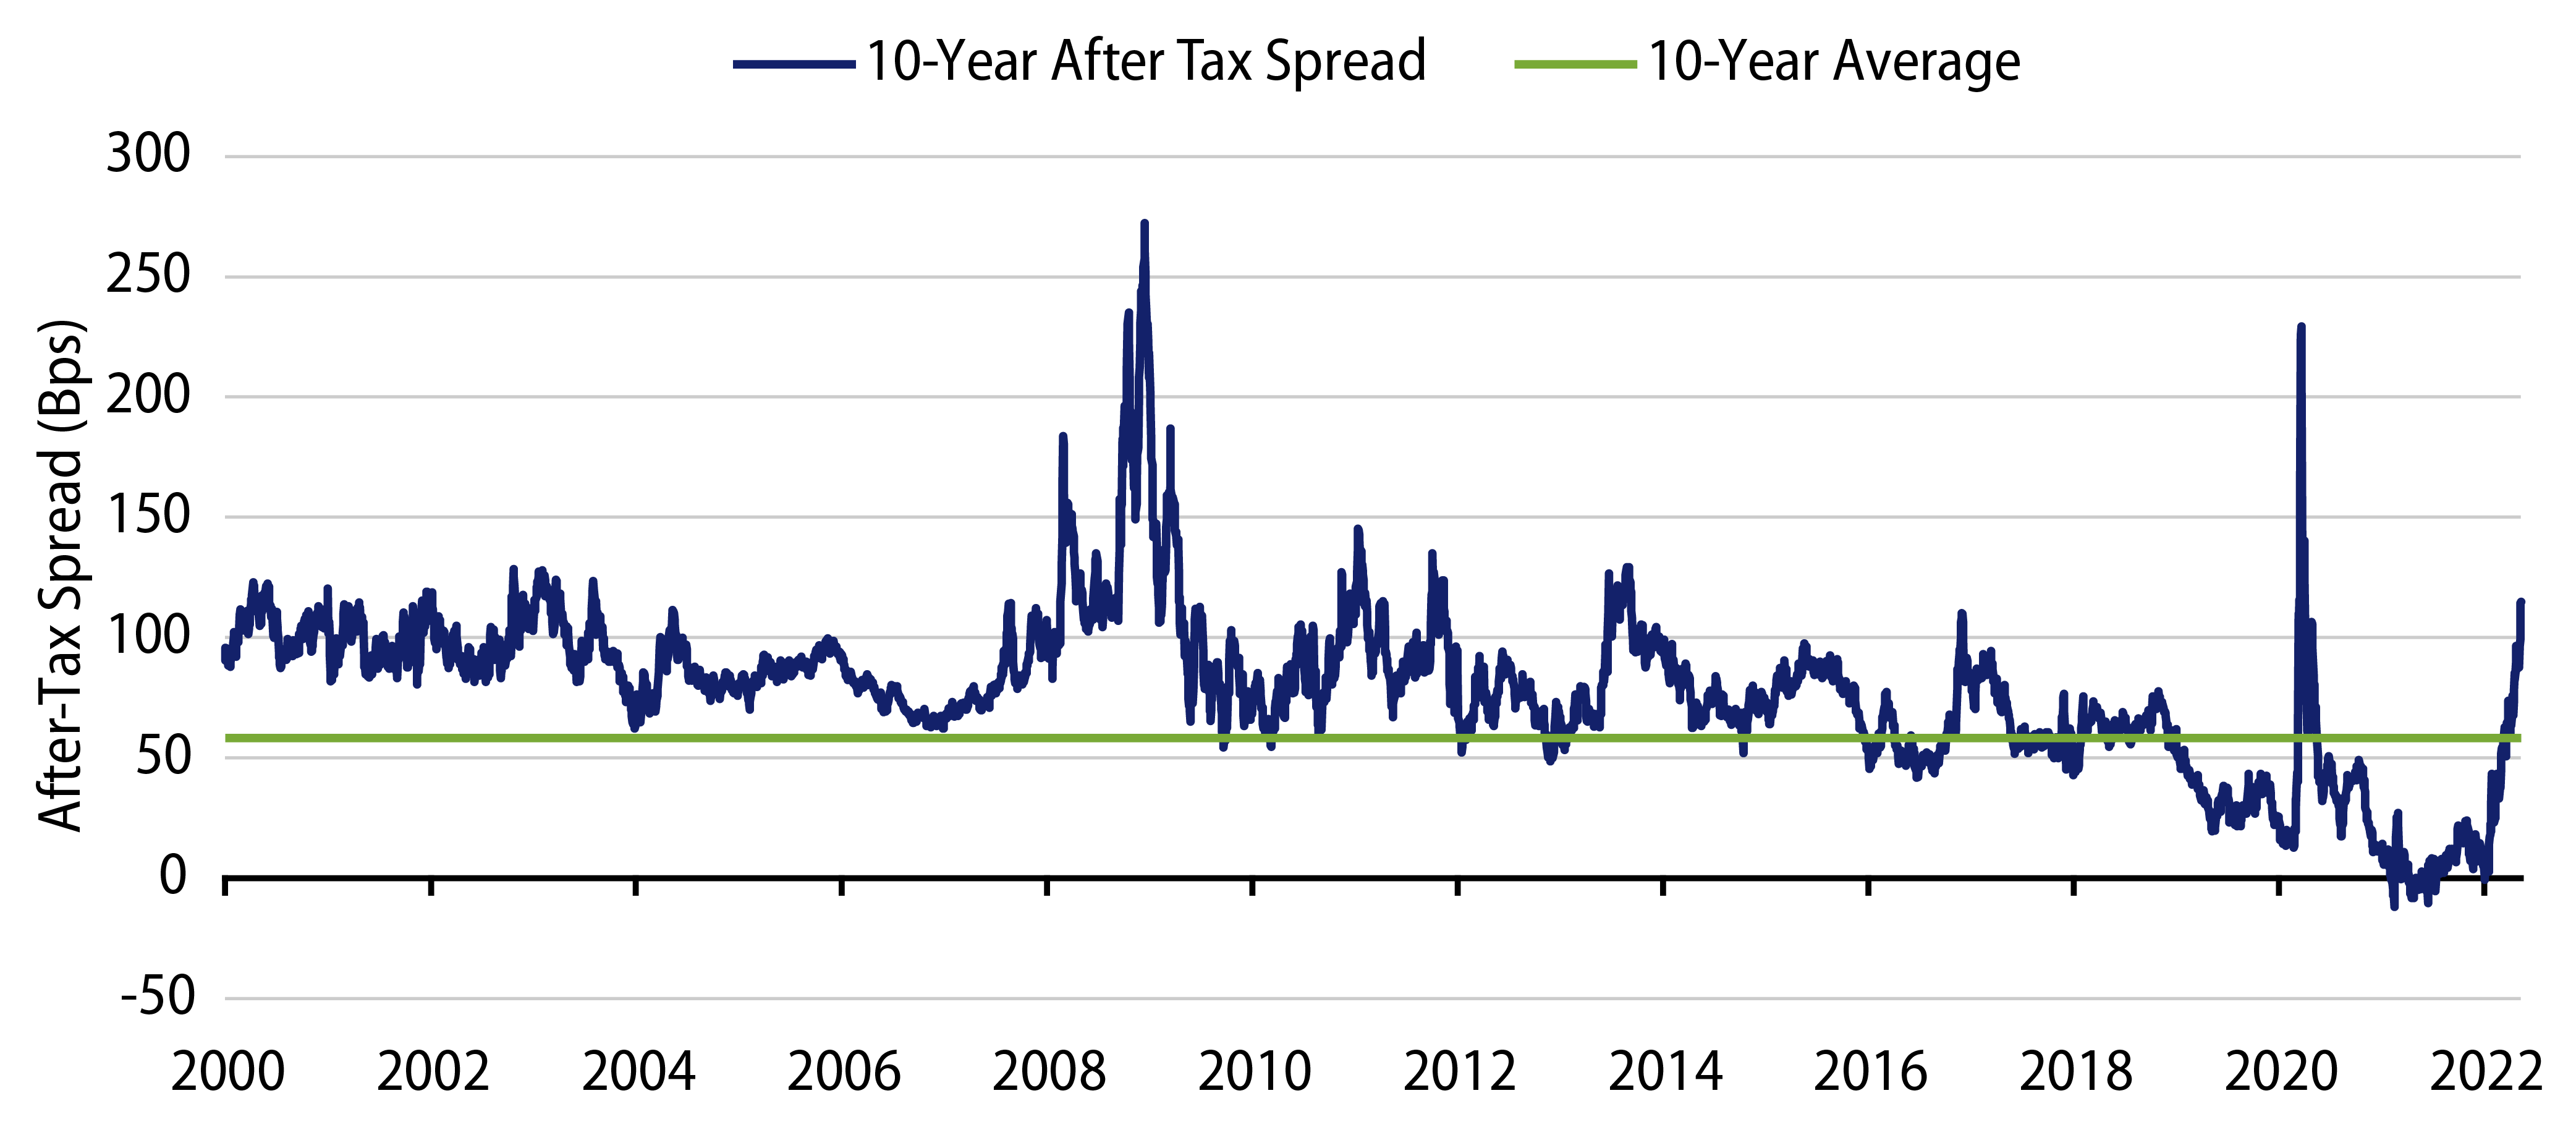
The Bloomberg Municipal Bond Index YTD return of -10.15% underperformed the Bloomberg Treasury Index and the broader Bloomberg Aggregate Index YTD returns of -8.76% and -9.71%, respectively. However, extending the holding period to the beginning of 2020, the Municipal Index has outperformed Treasury and the Aggregate indices by 209 and 232 bps, respectively (not considering the tax-benefit of municipal income). This could imply that at least a portion of the YTD negative performance can be attributed to a reversion to more normal valuations following significant outperformance of the asset class in 2021, which had driven Municipal/Treasury ratios to record lows, and municipal versus after-tax Treasury spreads to negative levels for the first time.

Exhibit 2: 10-year AAA Munis—After-Tax Treasury Spread
Explore 10-year AAA Munis—After-Tax Treasury Spread
Source: Thomson Reuters, Bloomberg, Western Asset. As of 13 May 22. After-Tax Spread assumes the top federal marginal tax rate applied to the Treasury Yield. Select the image to expand the view.

Municipal underperformance YTD can also be explained by the large proportion of callable bonds that comprise the muni market. Callable bonds provide higher duration-adjusted yields to investors when rate volatility is low. However, when rates rise, the negative price action of a callable bond is exacerbated by a simultaneous lengthening of duration, leading to significant price sensitivity to rising rates. In 2022, municipal indices experienced duration extension as rates increased, with the duration of the Bloomberg Municipal Index increasing one year and the duration of the Bloomberg Long Municipal Index lengthening by 3.4 years. The losses associated with this structure have been painful, but they could be attributed to the increased price sensitivity of rate movements in a rising-rate environment.

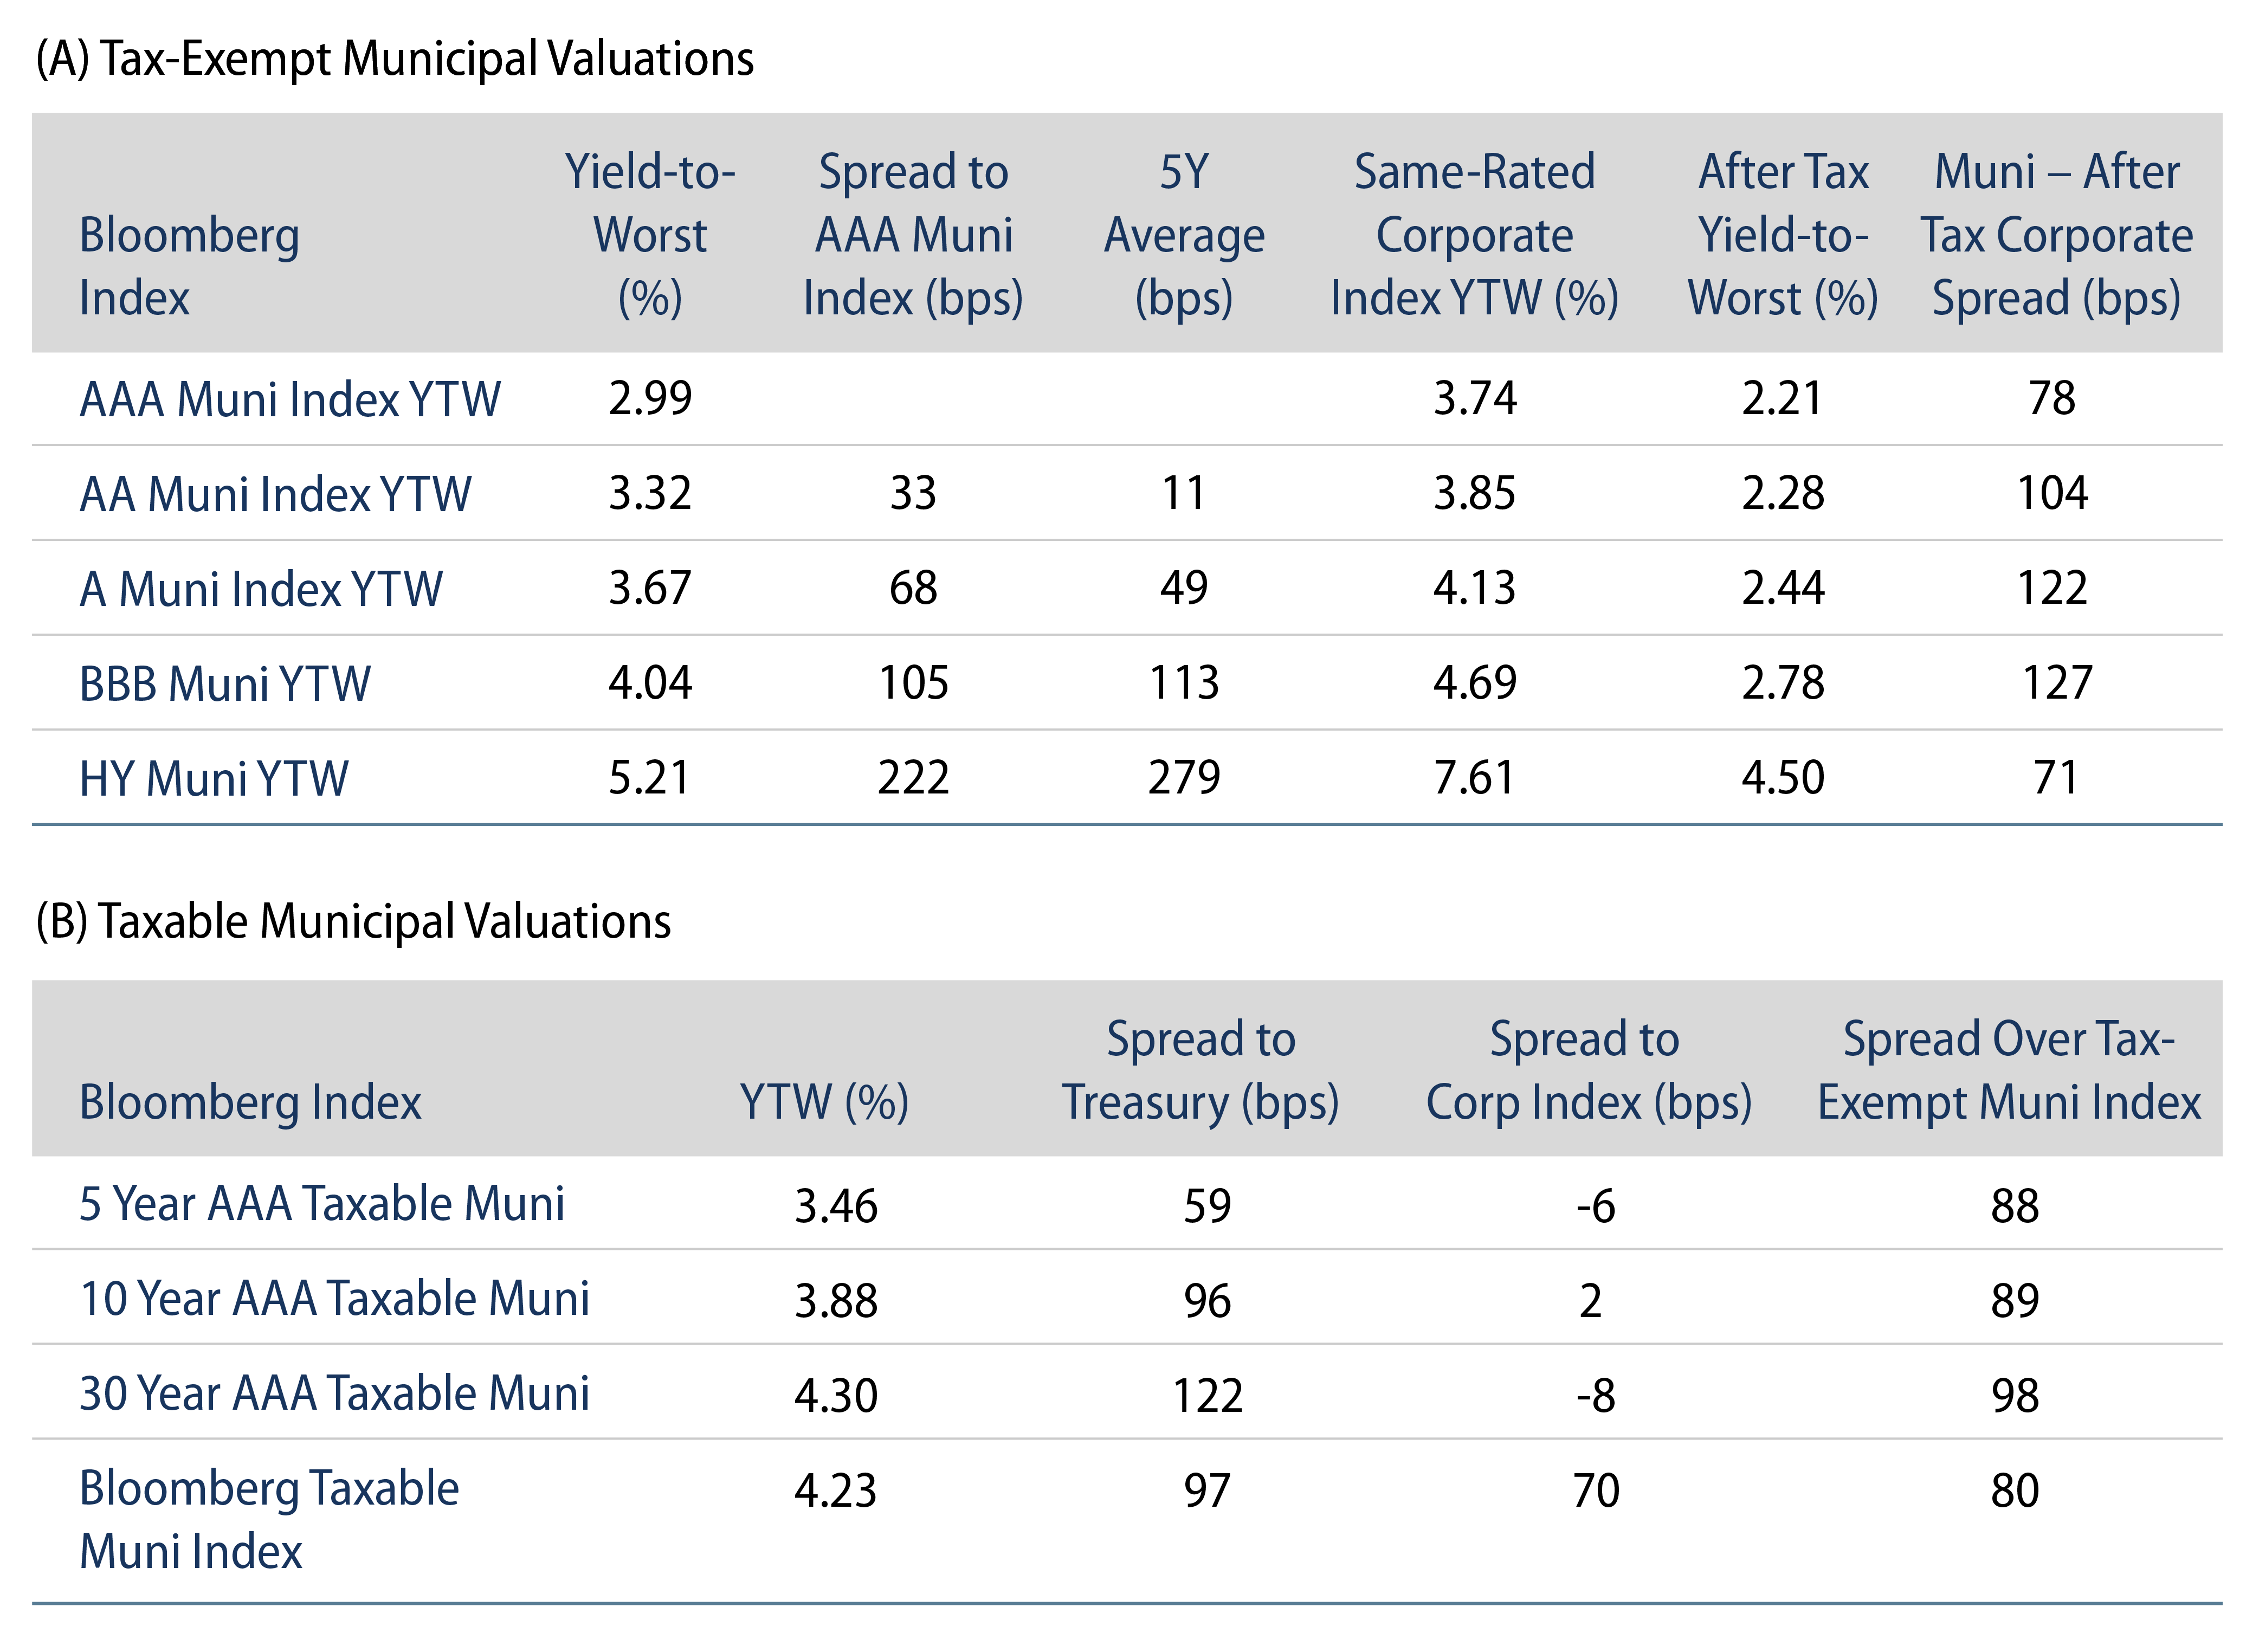
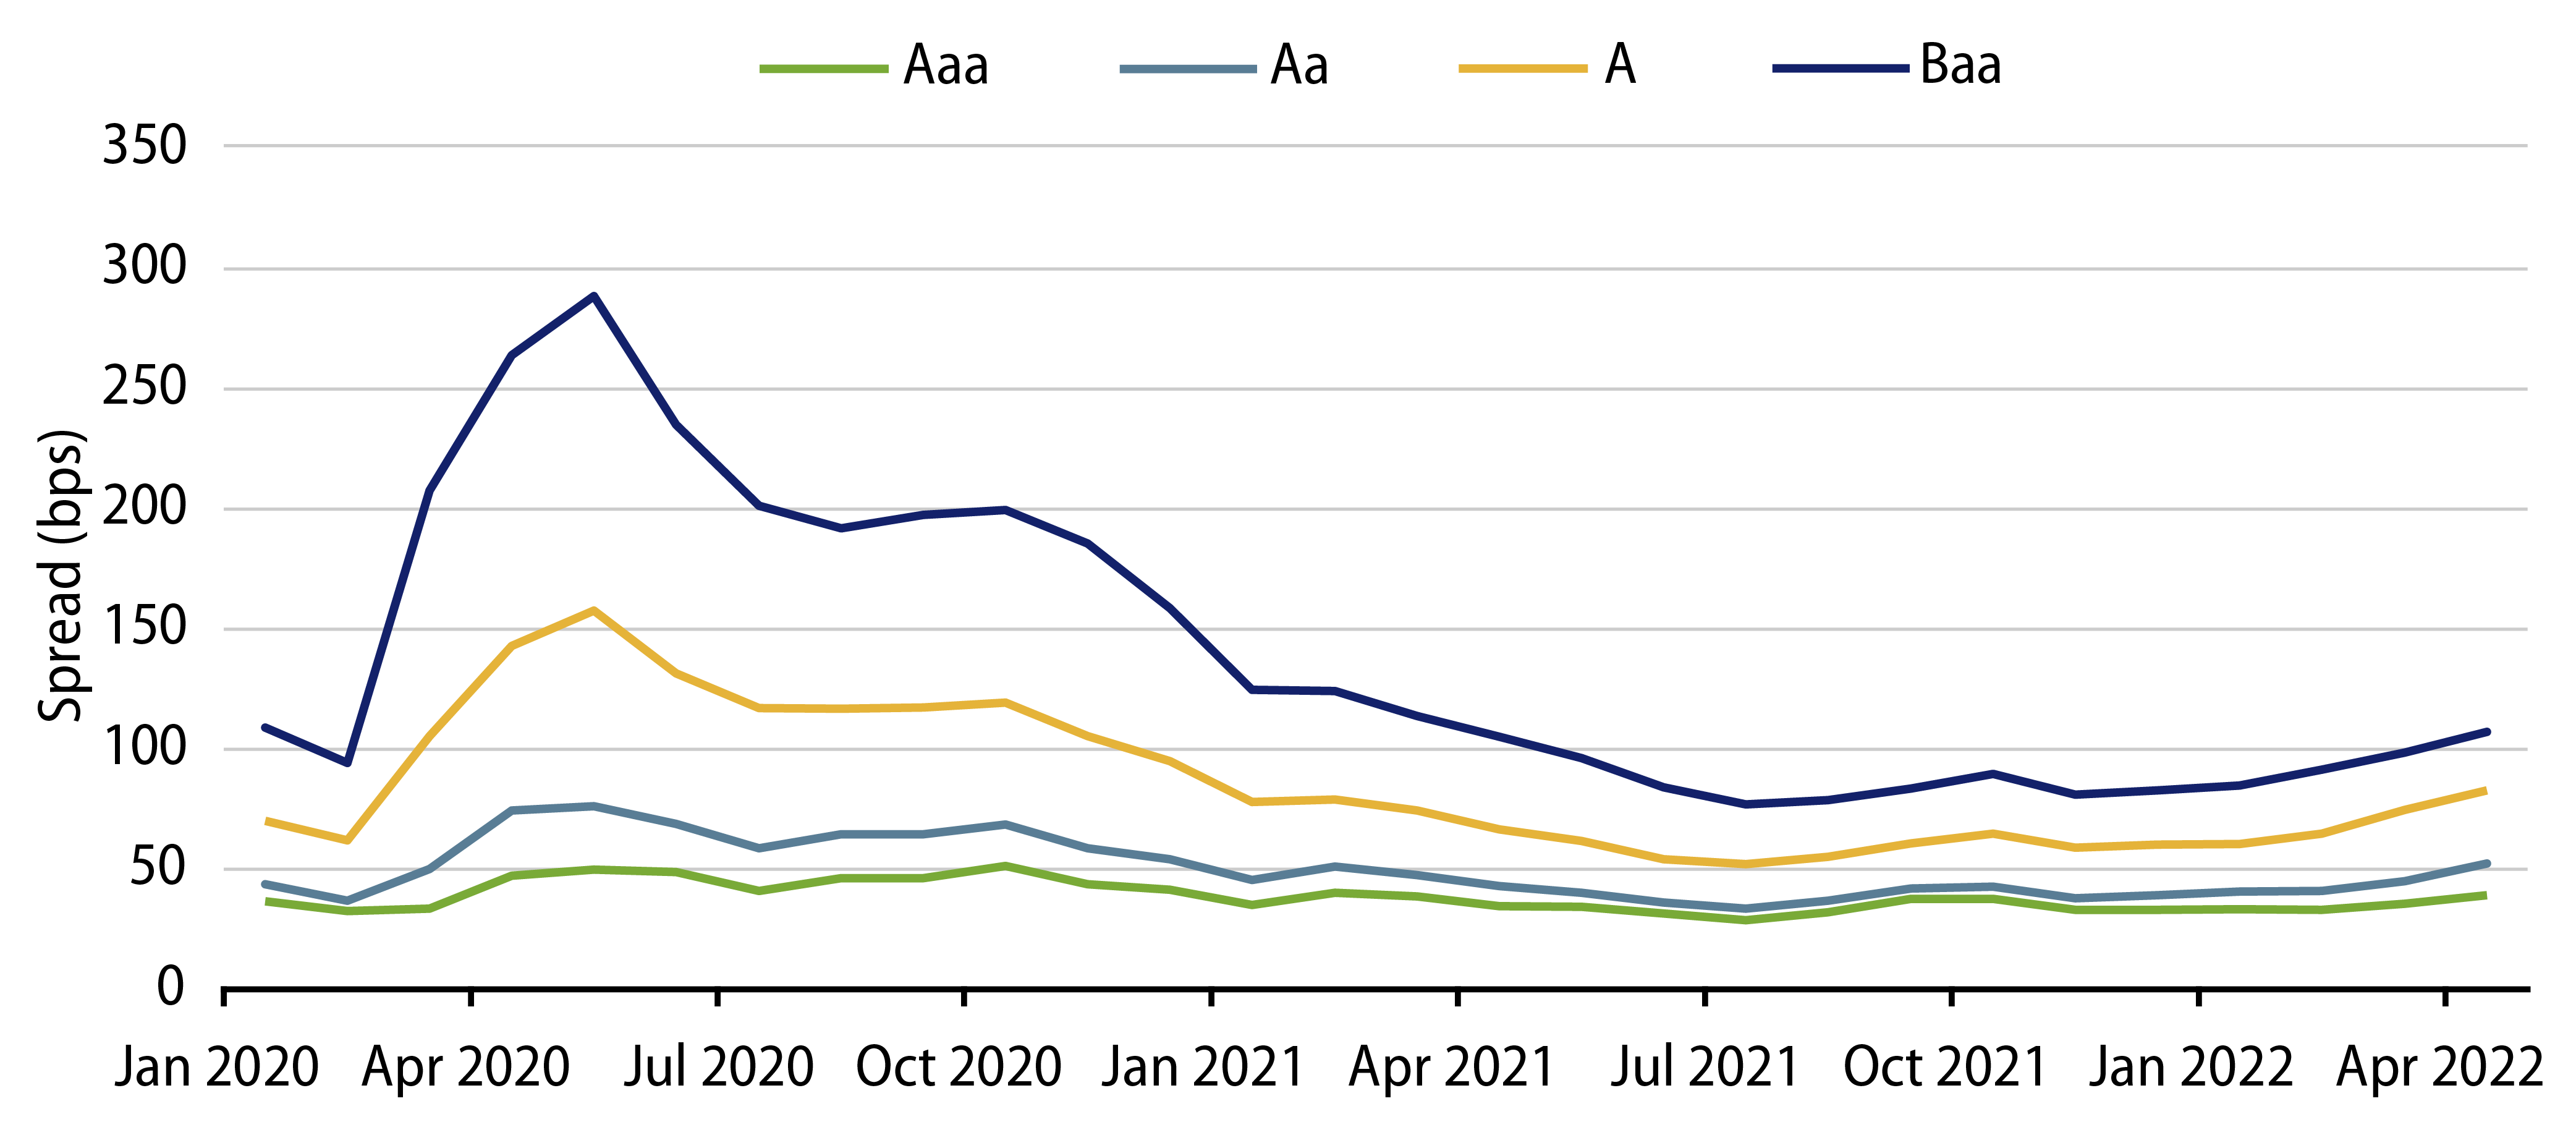
From a credit standpoint, in recent weeks we highlighted the stark contrast between negative municipal returns and strong credit conditions. Credit spreads support the relatively strong credit environment in the municipal market, as very little of the market’s woes can be attributed to the market’s avoidance of lower-credit bonds. Exhibit 3 shows that credit spreads within the Municipal Index have widened only modestly amid the current market volatility.

Exhibit 3: Municipal Credit Spreads
Explore Municipal Credit Spreads
Source: Bloomberg, Western Asset. As of 30 Apr 22. Spreads reflect the Bloomberg quality municipal index spread versus the AAA Callable Municipal Curve. Select the image to expand the view.

No asset class is immune to the global volatility that we are currently experiencing. Highly volatile periods in the past have often revealed new and negative information about certain asset classes. This seems not to be the case with municipal bonds in this current turbulent environment. While overall market volatility can be unpredictable, from a quantitative standpoint, municipal bonds have for the most part behaved predictably considering the interest rate moves, along with the embedded duration, structural and credit factors that an active manager such as Western Asset evaluates on a daily basis.

Exhibit 4: Municipal Bond Yields and Index Return
Explore Municipal Bond Yields and Index Return
Source: Bloomberg. As of 13 May 22. Select the image to expand the view.
Exhibit 5: Tax-Exempt and Taxable Muni Valuations
Explore Tax-Exempt and Taxable Muni Valuations
Source: Bloomberg. As of 13 May 22. Select the image to expand the view.
© Western Asset Management Company, LLC 2024. The information contained in these materials ("the materials") is intended for the exclusive use of the designated recipient ("the recipient"). This information is proprietary and confidential and may contain commercially sensitive information, and may not be copied, reproduced or republished, in whole or in part, without the prior written consent of Western Asset Management Company ("Western Asset").
Past performance does not predict future returns. These materials should not be deemed to be a prediction or projection of future performance. These materials are intended for investment professionals including professional clients, eligible counterparties, and qualified investors only.
These materials have been produced for illustrative and informational purposes only. These materials contain Western Asset's opinions and beliefs as of the date designated on the materials; these views are subject to change and may not reflect real-time market developments and investment views.
Third party data may be used throughout the materials, and this data is believed to be accurate to the best of Western Asset's knowledge at the time of publication, but cannot be guaranteed. These materials may also contain strategy or product awards or rankings from independent third parties or industry publications which are based on unbiased quantitative and/or qualitative information determined independently by each third party or publication. In some cases, Western Asset may subscribe to these third party's standard industry services or publications. These standard subscriptions and services are available to all asset managers and do not influence rankings or awards in any way.
Investment strategies or products discussed herein may involve a high degree of risk, including the loss of some or all capital. Investments in any products or strategies described in these materials may be volatile, and investors should have the financial ability and willingness to accept such risks.
Unless otherwise noted, investment performance contained in these materials is reflective of a strategy composite. All other strategy data and information included in these materials reflects a representative portfolio which is an account in the composite that Western Asset believes most closely reflects the current portfolio management style of the strategy. Performance is not a consideration in the selection of the representative portfolio. The characteristics of the representative portfolio shown may differ from other accounts in the composite. Information regarding the representative portfolio and the other accounts in the composite are available upon request. Statements in these materials should not be considered investment advice. References, either general or specific, to securities and/or issuers in the materials are for illustrative purposes only and are not intended to be, and should not be interpreted as, recommendation to purchase or sell such securities. Employees and/or clients of Western Asset may have a position in the securities or issuers mentioned.
These materials are not intended to provide, and should not be relied on for, accounting, legal, tax, investment or other advice. The recipient should consult its own counsel, accountant, investment, tax, and any other advisers for this advice, including economic risks and merits, related to making an investment with Western Asset. The recipient is responsible for observing the applicable laws and regulations of their country of residence.
Founded in 1971, Western Asset Management Company is a global fixed-income investment manager with offices in Pasadena, New York, London, Singapore, Tokyo, Melbourne, São Paulo, Hong Kong, and Zürich. Western Asset is a wholly owned subsidiary of Franklin Resources, Inc. but operates autonomously. Western Asset is comprised of six legal entities across the globe, each with distinct regional registrations: Western Asset Management Company, LLC, a registered Investment Adviser with the Securities and Exchange Commission; Western Asset Management Company Distribuidora de Títulos e Valores Mobiliários Limitada is authorized and regulated by Comissão de Valores Mobiliários and Brazilian Central Bank; Western Asset Management Company Pty Ltd ABN 41 117 767 923 is the holder of the Australian Financial Services License 303160; Western Asset Management Company Pte. Ltd. Co. Reg. No. 200007692R is a holder of a Capital Markets Services License for fund management and regulated by the Monetary Authority of Singapore; Western Asset Management Company Ltd, a registered Financial Instruments Business Operator and regulated by the Financial Services Agency of Japan; and Western Asset Management Company Limited is authorised and regulated by the Financial Conduct Authority ("FCA") (FRN 145930). This communication is intended for distribution to Professional Clients only if deemed to be a financial promotion in the UK as defined by the FCA. This communication may also be intended for certain EEA countries where Western Asset has been granted permission to do so. For the current list of the approved EEA countries please contact Western Asset at +44 (0)20 7422 3000.