skip navigation
Blog

Stay up to date on timely topics and market events. Subscribe to our Blog now.

MARKETS
12 October 2021

Weekly Municipal Monitor—Pension Progress

By Thea Okin, Sam Weitzman

Stay up to date on timely topics and market events. Subscribe to our Blog now.

Municipals Posted a Third Consecutive Week of Negative Returns

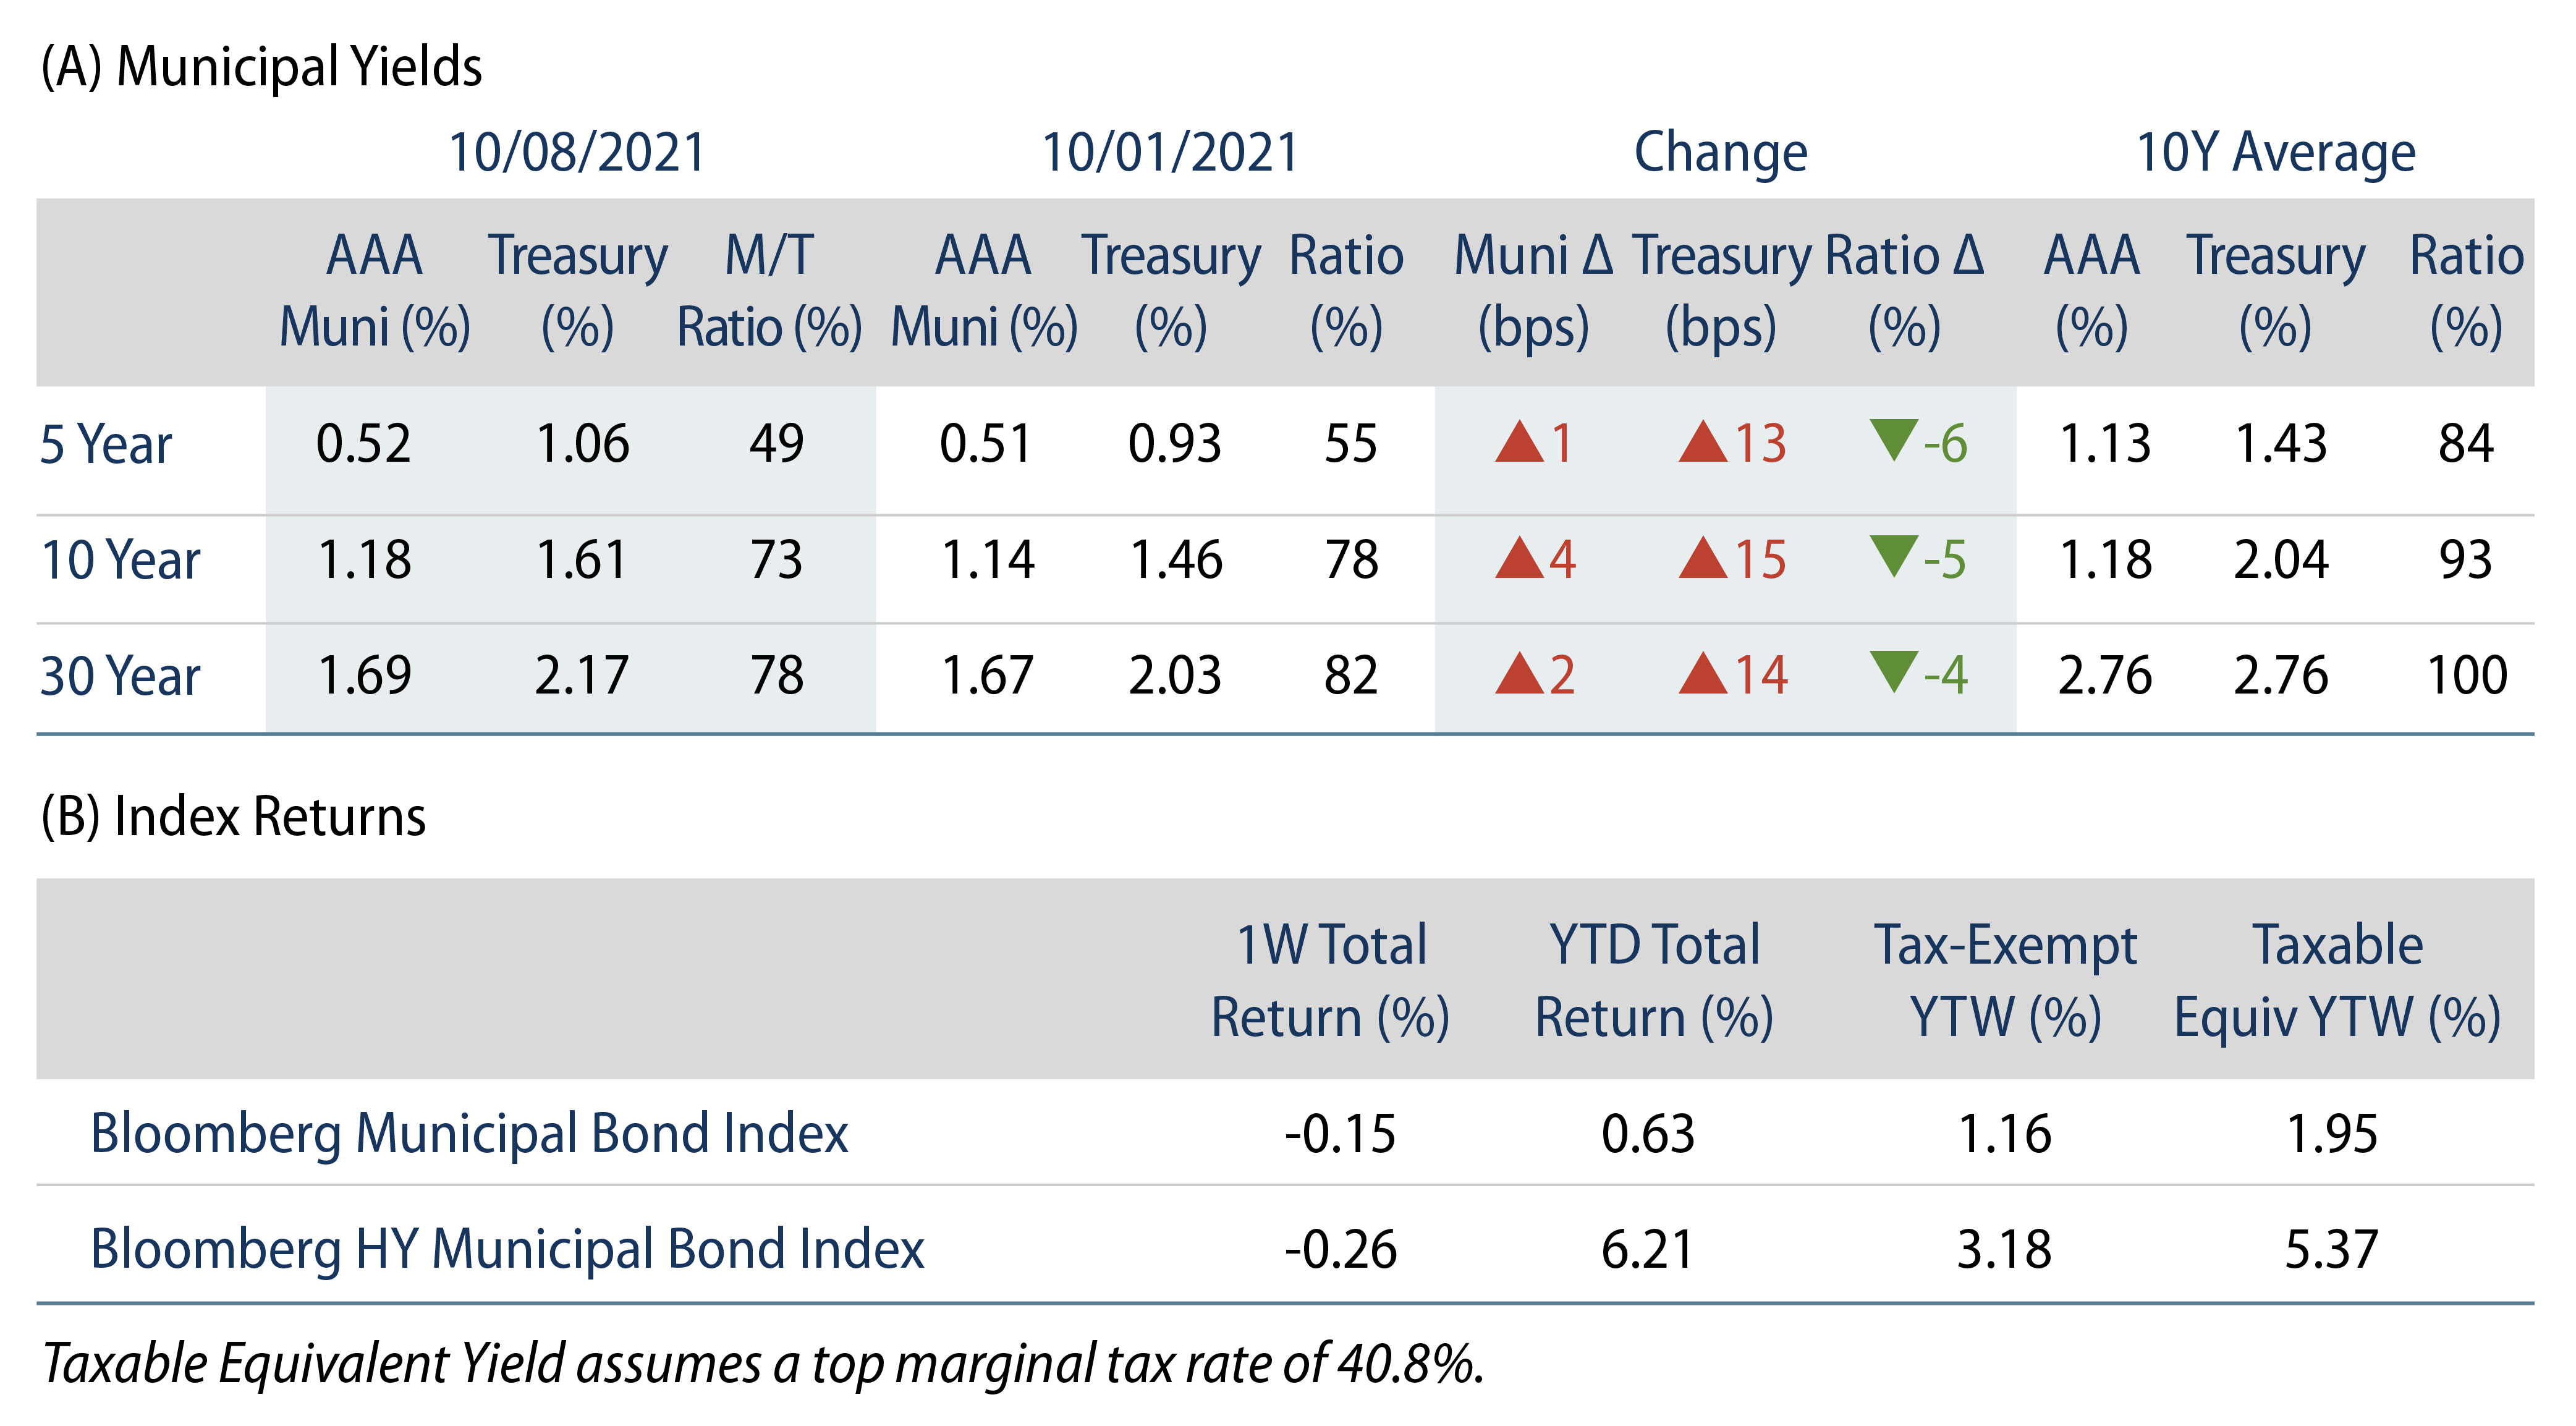
US muni yields increased 1 to 4 bps across the curve. Municipals outperformed the Treasury selloff as ratios grinded 4% to 6% lower. The Bloomberg Municipal Index returned -0.15% while the HY Muni Index returned -0.26%. Muni fund inflows continued to decelerate as long-term and high-yield funds experienced outflows. This week we provide an update on the state of state and local pensions.

Fund Flows Decelerate as Long-Term and High-Yield Categories Report Outflows

Fund Flows: During the week ending October 8, municipal mutual funds recorded $37 million of net inflows. Long-term funds recorded $173 million of outflows, high-yield funds recorded $460 million of outflows and intermediate funds recorded $223 million of inflows. Municipal mutual funds have now recorded inflows 72 of the last 73 weeks, extending the record inflow cycle to $150.5 billion, with year-to-date (YTD) net inflows also maintaining a record pace of $89 billion.

Supply: The muni market recorded $11 billion of new-issue volume during the week, down 7% from the prior week. Total issuance YTD of $358 billion is 3% higher from last year’s levels, with tax-exempt issuance trending 12% higher year-over-year (YoY) and taxable issuance trending 18% lower YoY. This week’s new-issue calendar is expected to decline to $4.2 billion of new issuance, given the holiday-shortened week. The largest deals include $750 million Main Street Natural Gas and $366 million Texas Water Development Board transactions.

This Week in Munis—Pension Progress

Municipal pension funding has been a well-documented credit concern over the past decade. According to the Federal Reserve Flow of Funds data, unfunded state and local pension liabilities doubled after the GFC to $3 trillion, then continued to grind higher to $4 trillion through the beginning of 2020, as underperforming market returns, underwhelming contributions and revisions to aggressive actuarial assumptions all contributed toward rising net pension liabilities. Pension concerns came back to the forefront when the COVID-19 pandemic emerged in March of 2020 and the S&P fell 34%. Total unfunded pension liabilities climbed to $4.75 trillion and those credits with underfunded pensions underperformed the broader municipal market.

Exhibit 1: Unfunded State and Local Pension Liabilities
Unfunded State and Local Pension Liabilities
Source: Bloomberg, Federal Reserve. As of 30 Jun 21. Select the image to expand the view.

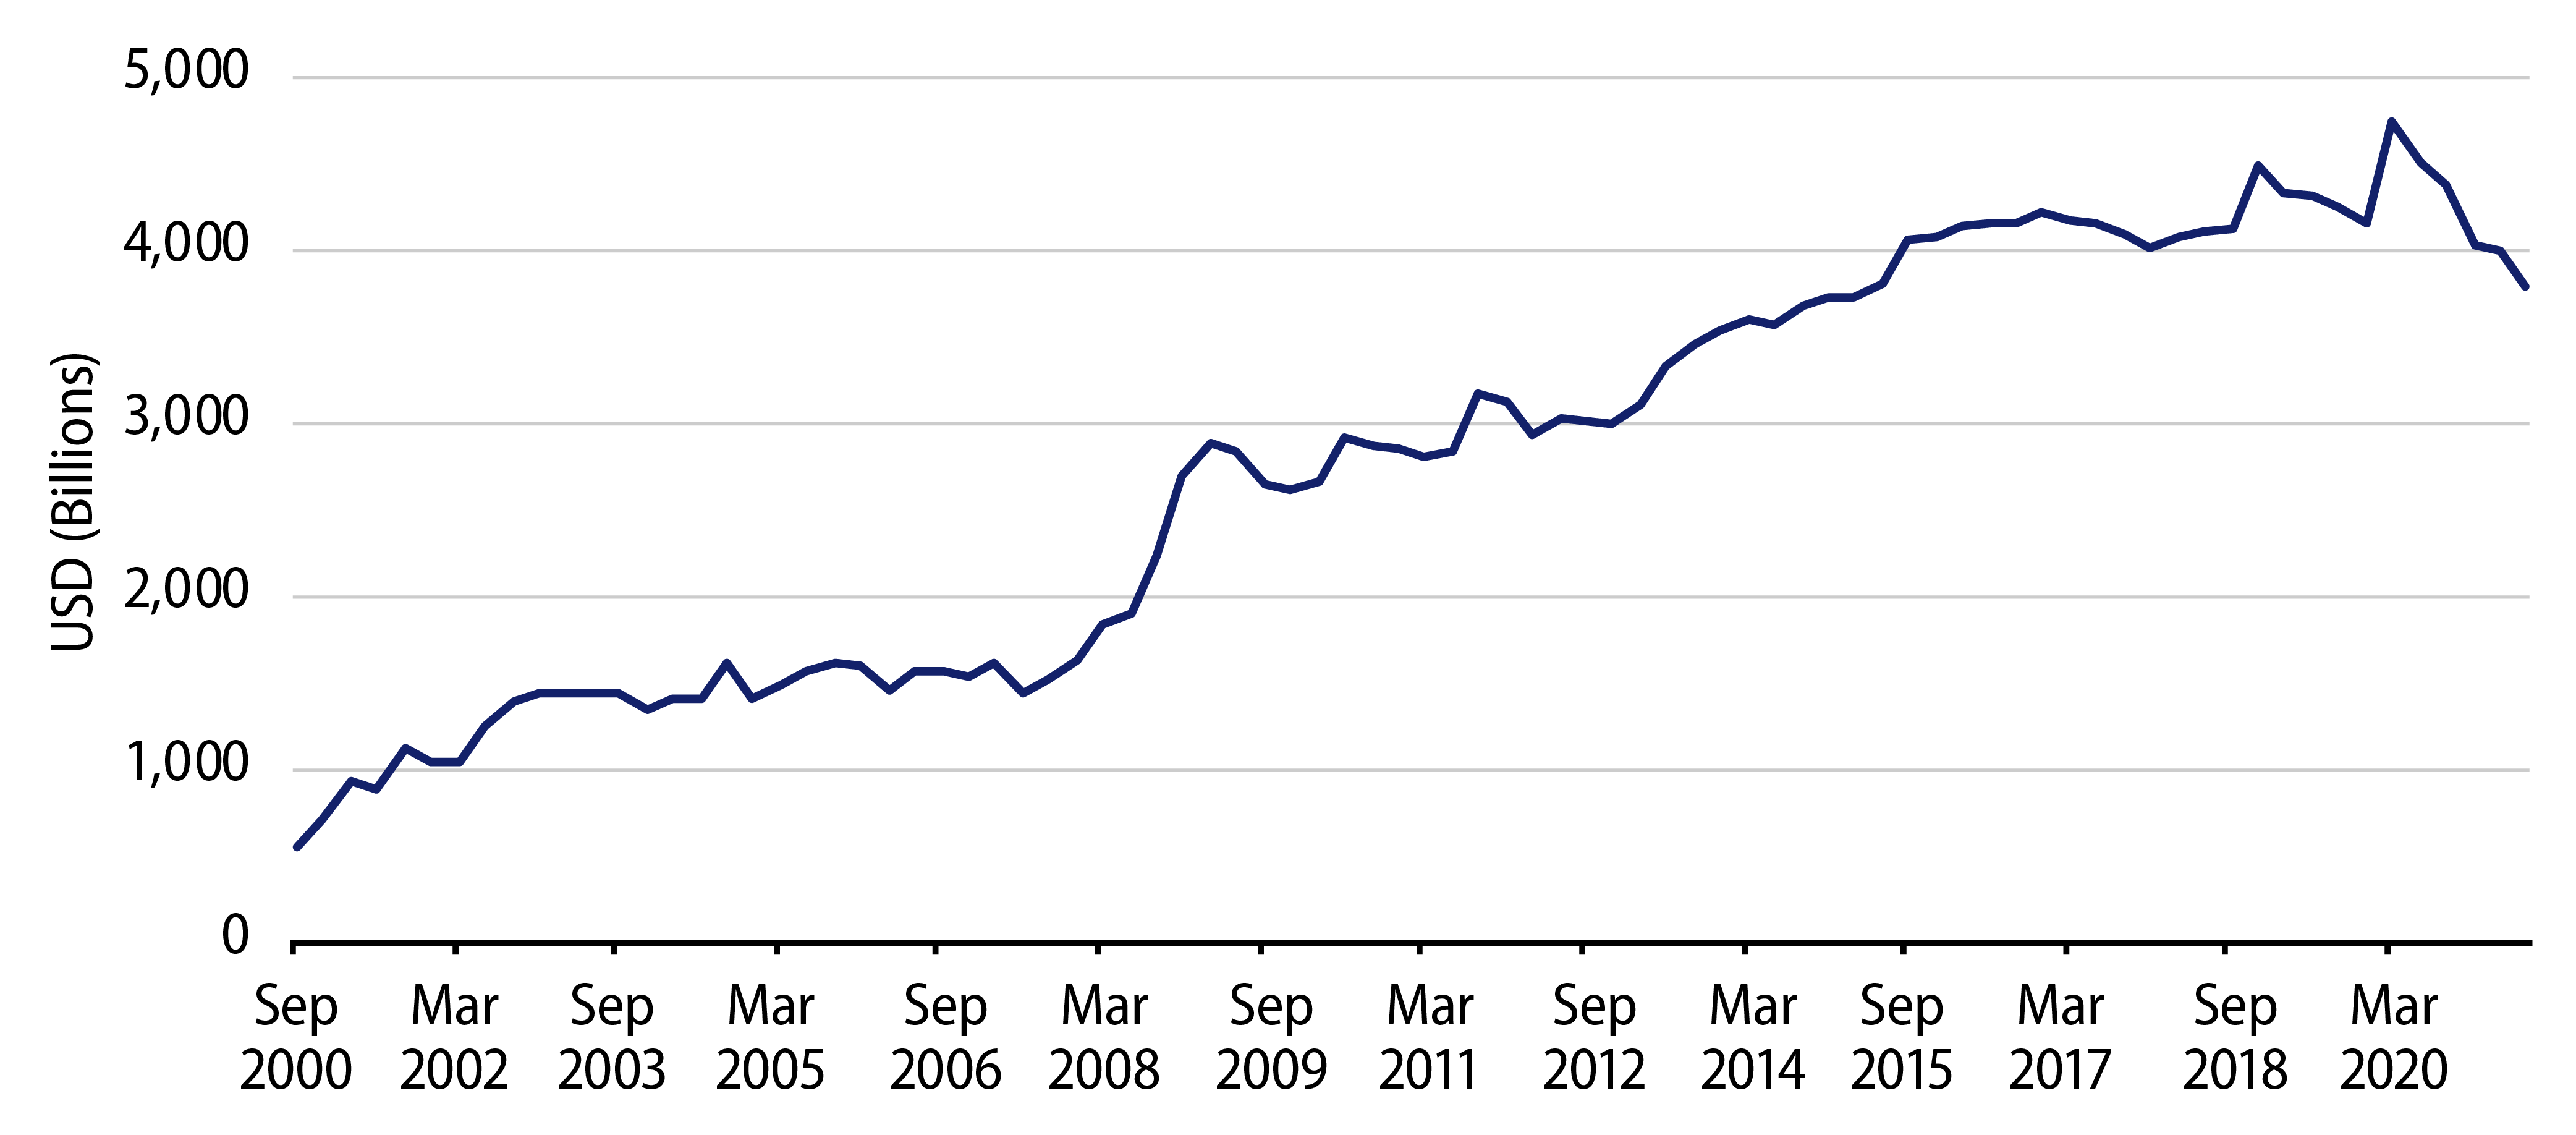
Widespread fears were soon abated by the robust market recovery since the market downturn. The S&P 500 climbed a remarkable 103% from March 2020 through early September 2021, and public pensions have reaped the benefits with overall expected investment returns ranging between 25% and 35% for the fiscal year ending June 30, 2021. In addition to strong investment returns, public pensions benefited from state-level reforms that have occurred over the past decade. Employer contributions have increased by 8% annually from 2008 to 2019. The most pension-challenged states of Illinois, Kentucky, New Jersey and Pennsylvania have seen contribution increases of 16%. All told, from March 2020 to June 2021, aggregate state and local unfunded liabilities declined by 20%, to $3.8 trillion, leading average funding ratios higher to 74.7% (up from lows of 71.7% in 2016).

Exhibit 2: Average Funded Ratio for Plans Grouped by 2021 Funded Status
Average Funded Ratio for Plans Grouped by 2021 Funded Status
Source: Bloomberg, Bond Buyer, Western Asset. As of 30 Jun 21. Select the image to expand the view.

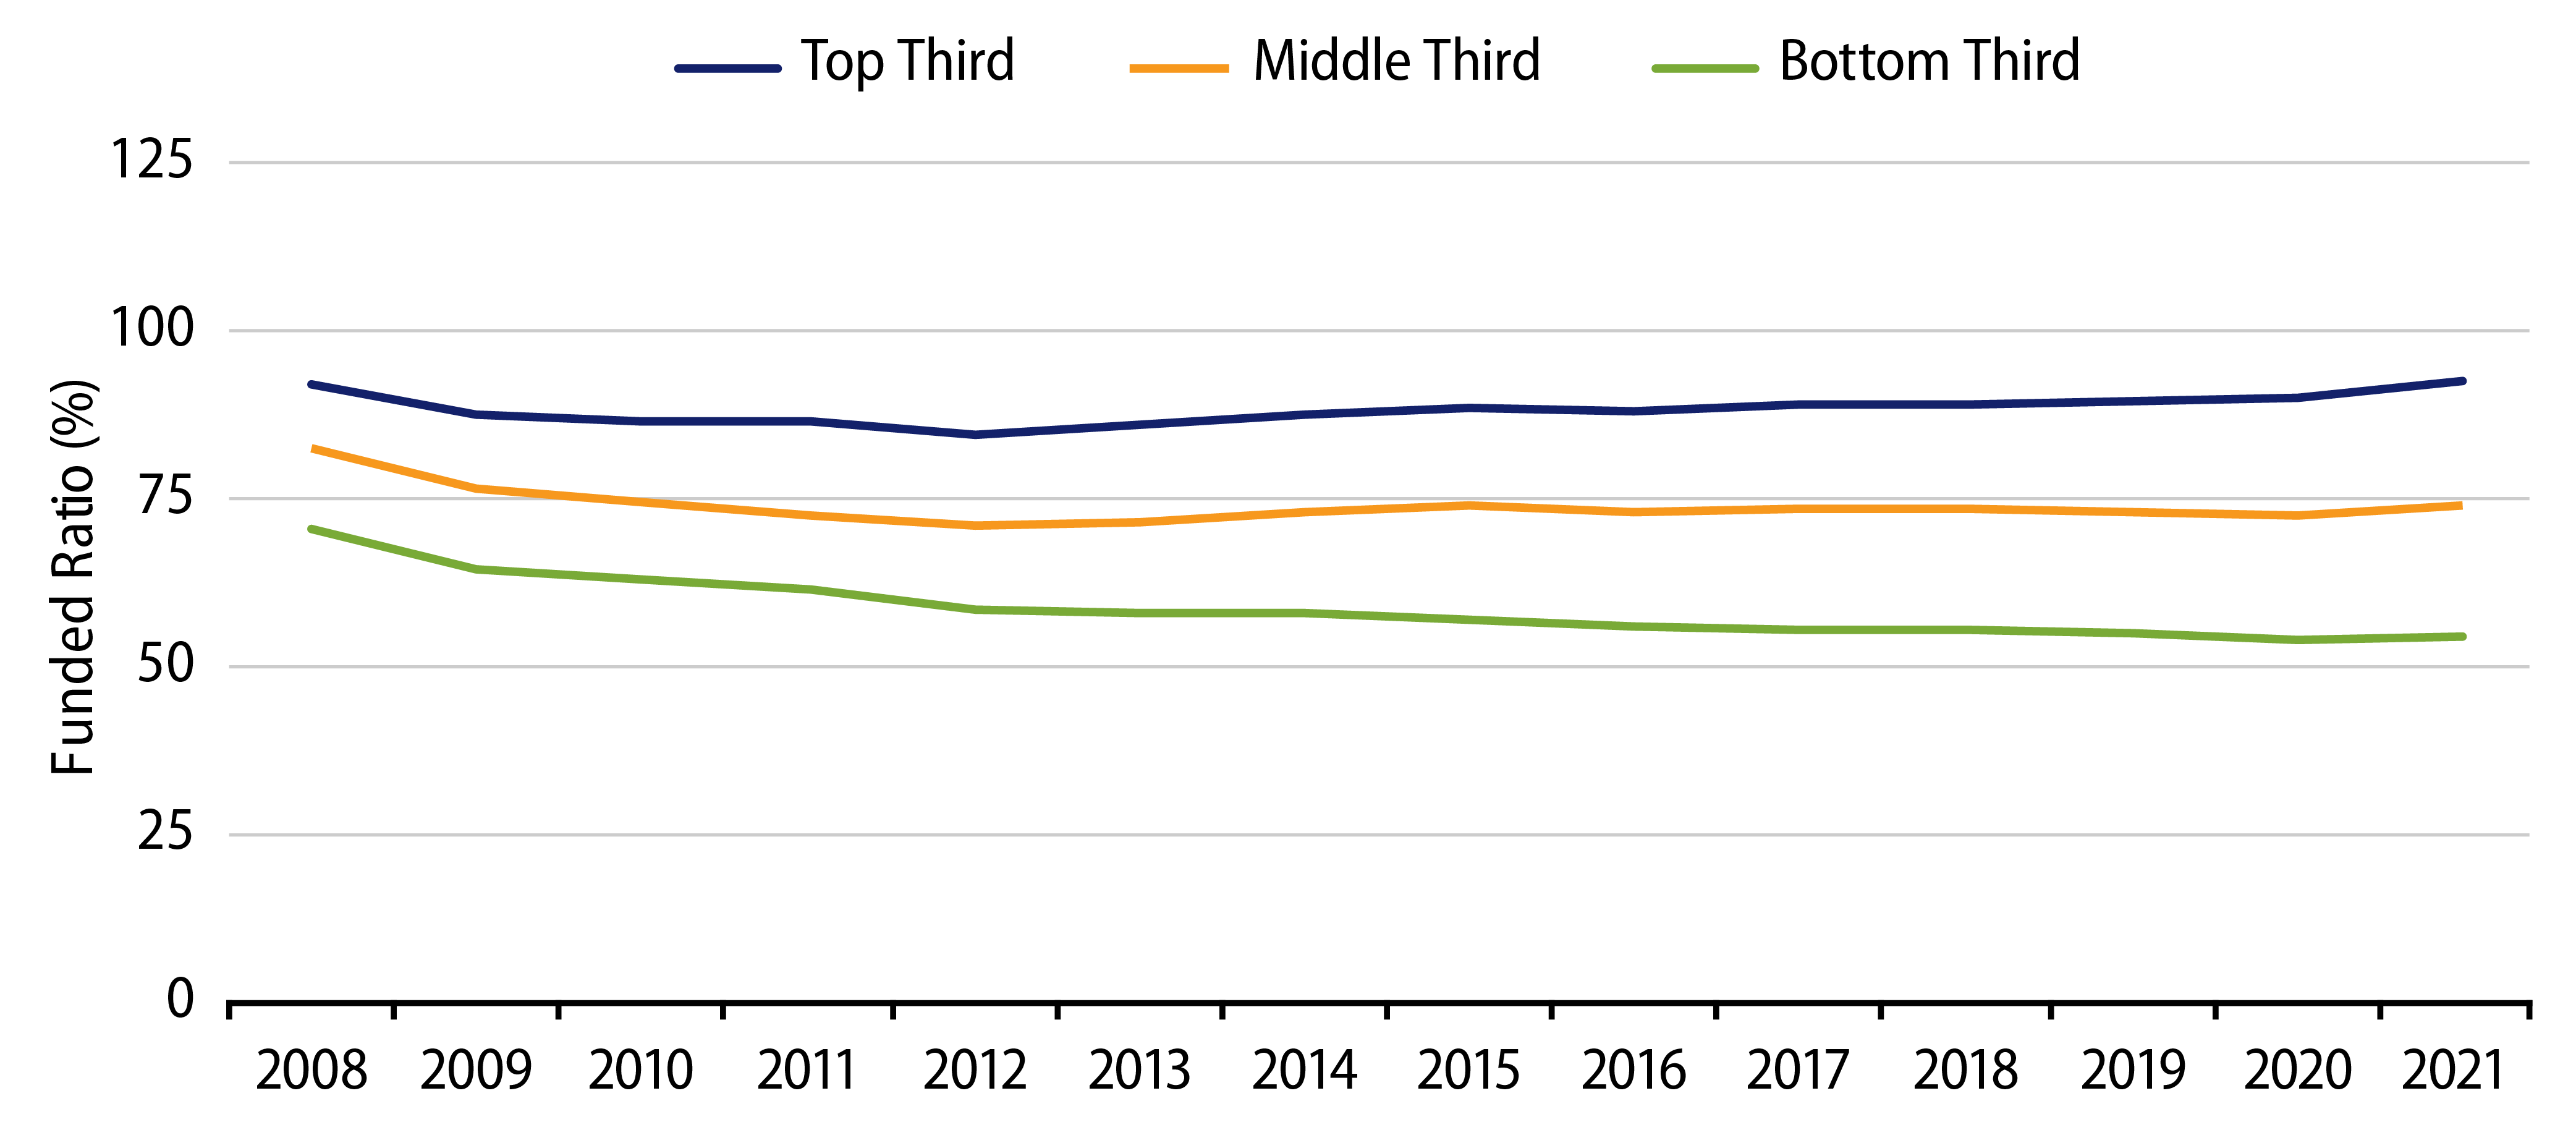
While the majority of the public pension funds have improved and maintain relatively healthy funded ratios, a third of the market’s funded ratios still remain below 70%, with some below 20%. Moreover, the best-funded plans have shown the most improvement, while plans with lower funded ratios, and lower vested assets, did not observe the same benefit from the recent market rally. Over the last year, the average funded ratio of the bottom third of pension plans (by funding ratio) improved just 0.2%, compared to a 2.7% improvement of the top third, according to a recent Boston College Center for Retirement Research study. Municipal credits participating in these lower funded pension plans will likely observe higher forward-looking fixed costs, which could weigh on discretionary spending and budgetary flexibility in the next downturn, leaving these entities more vulnerable to rating downgrades and negative price volatility.

Exhibit 3: Municipal Bond Yields and Index Return
Municipal Bond Yields and Index Return
Source: Bloomberg. As of 08 Oct 21. Select the image to expand the view.
Exhibit 4: Tax-Exempt Muni Valuations
Tax-Exempt Muni Valuations
Source: Bloomberg. As of 08 Oct 21. Select the image to expand the view.
© Western Asset Management Company, LLC 2024. The information contained in these materials ("the materials") is intended for the exclusive use of the designated recipient ("the recipient"). This information is proprietary and confidential and may contain commercially sensitive information, and may not be copied, reproduced or republished, in whole or in part, without the prior written consent of Western Asset Management Company ("Western Asset").
Past performance does not predict future returns. These materials should not be deemed to be a prediction or projection of future performance. These materials are intended for investment professionals including professional clients, eligible counterparties, and qualified investors only.
These materials have been produced for illustrative and informational purposes only. These materials contain Western Asset's opinions and beliefs as of the date designated on the materials; these views are subject to change and may not reflect real-time market developments and investment views.
Third party data may be used throughout the materials, and this data is believed to be accurate to the best of Western Asset's knowledge at the time of publication, but cannot be guaranteed. These materials may also contain strategy or product awards or rankings from independent third parties or industry publications which are based on unbiased quantitative and/or qualitative information determined independently by each third party or publication. In some cases, Western Asset may subscribe to these third party's standard industry services or publications. These standard subscriptions and services are available to all asset managers and do not influence rankings or awards in any way.
Investment strategies or products discussed herein may involve a high degree of risk, including the loss of some or all capital. Investments in any products or strategies described in these materials may be volatile, and investors should have the financial ability and willingness to accept such risks.
Unless otherwise noted, investment performance contained in these materials is reflective of a strategy composite. All other strategy data and information included in these materials reflects a representative portfolio which is an account in the composite that Western Asset believes most closely reflects the current portfolio management style of the strategy. Performance is not a consideration in the selection of the representative portfolio. The characteristics of the representative portfolio shown may differ from other accounts in the composite. Information regarding the representative portfolio and the other accounts in the composite are available upon request. Statements in these materials should not be considered investment advice. References, either general or specific, to securities and/or issuers in the materials are for illustrative purposes only and are not intended to be, and should not be interpreted as, recommendation to purchase or sell such securities. Employees and/or clients of Western Asset may have a position in the securities or issuers mentioned.
These materials are not intended to provide, and should not be relied on for, accounting, legal, tax, investment or other advice. The recipient should consult its own counsel, accountant, investment, tax, and any other advisers for this advice, including economic risks and merits, related to making an investment with Western Asset. The recipient is responsible for observing the applicable laws and regulations of their country of residence.
Founded in 1971, Western Asset Management Company is a global fixed-income investment manager with offices in Pasadena, New York, London, Singapore, Tokyo, Melbourne, São Paulo, Hong Kong, and Zürich. Western Asset is a wholly owned subsidiary of Franklin Resources, Inc. but operates autonomously. Western Asset is comprised of six legal entities across the globe, each with distinct regional registrations: Western Asset Management Company, LLC, a registered Investment Adviser with the Securities and Exchange Commission; Western Asset Management Company Distribuidora de Títulos e Valores Mobiliários Limitada is authorized and regulated by Comissão de Valores Mobiliários and Brazilian Central Bank; Western Asset Management Company Pty Ltd ABN 41 117 767 923 is the holder of the Australian Financial Services License 303160; Western Asset Management Company Pte. Ltd. Co. Reg. No. 200007692R is a holder of a Capital Markets Services License for fund management and regulated by the Monetary Authority of Singapore; Western Asset Management Company Ltd, a registered Financial Instruments Business Operator and regulated by the Financial Services Agency of Japan; and Western Asset Management Company Limited is authorised and regulated by the Financial Conduct Authority ("FCA") (FRN 145930). This communication is intended for distribution to Professional Clients only if deemed to be a financial promotion in the UK as defined by the FCA. This communication may also be intended for certain EEA countries where Western Asset has been granted permission to do so. For the current list of the approved EEA countries please contact Western Asset at +44 (0)20 7422 3000.