skip navigation
Blog

Stay up to date on timely topics and market events. Subscribe to our Blog now.

MARKETS
30 November 2021

Weekly Municipal Monitor—Ongoing Budget Improvements Spur Upgrades

By Thea Okin, Sam Weitzman

Stay up to date on timely topics and market events. Subscribe to our Blog now.

High Grade Municipal Yields Moved Lower During the Week

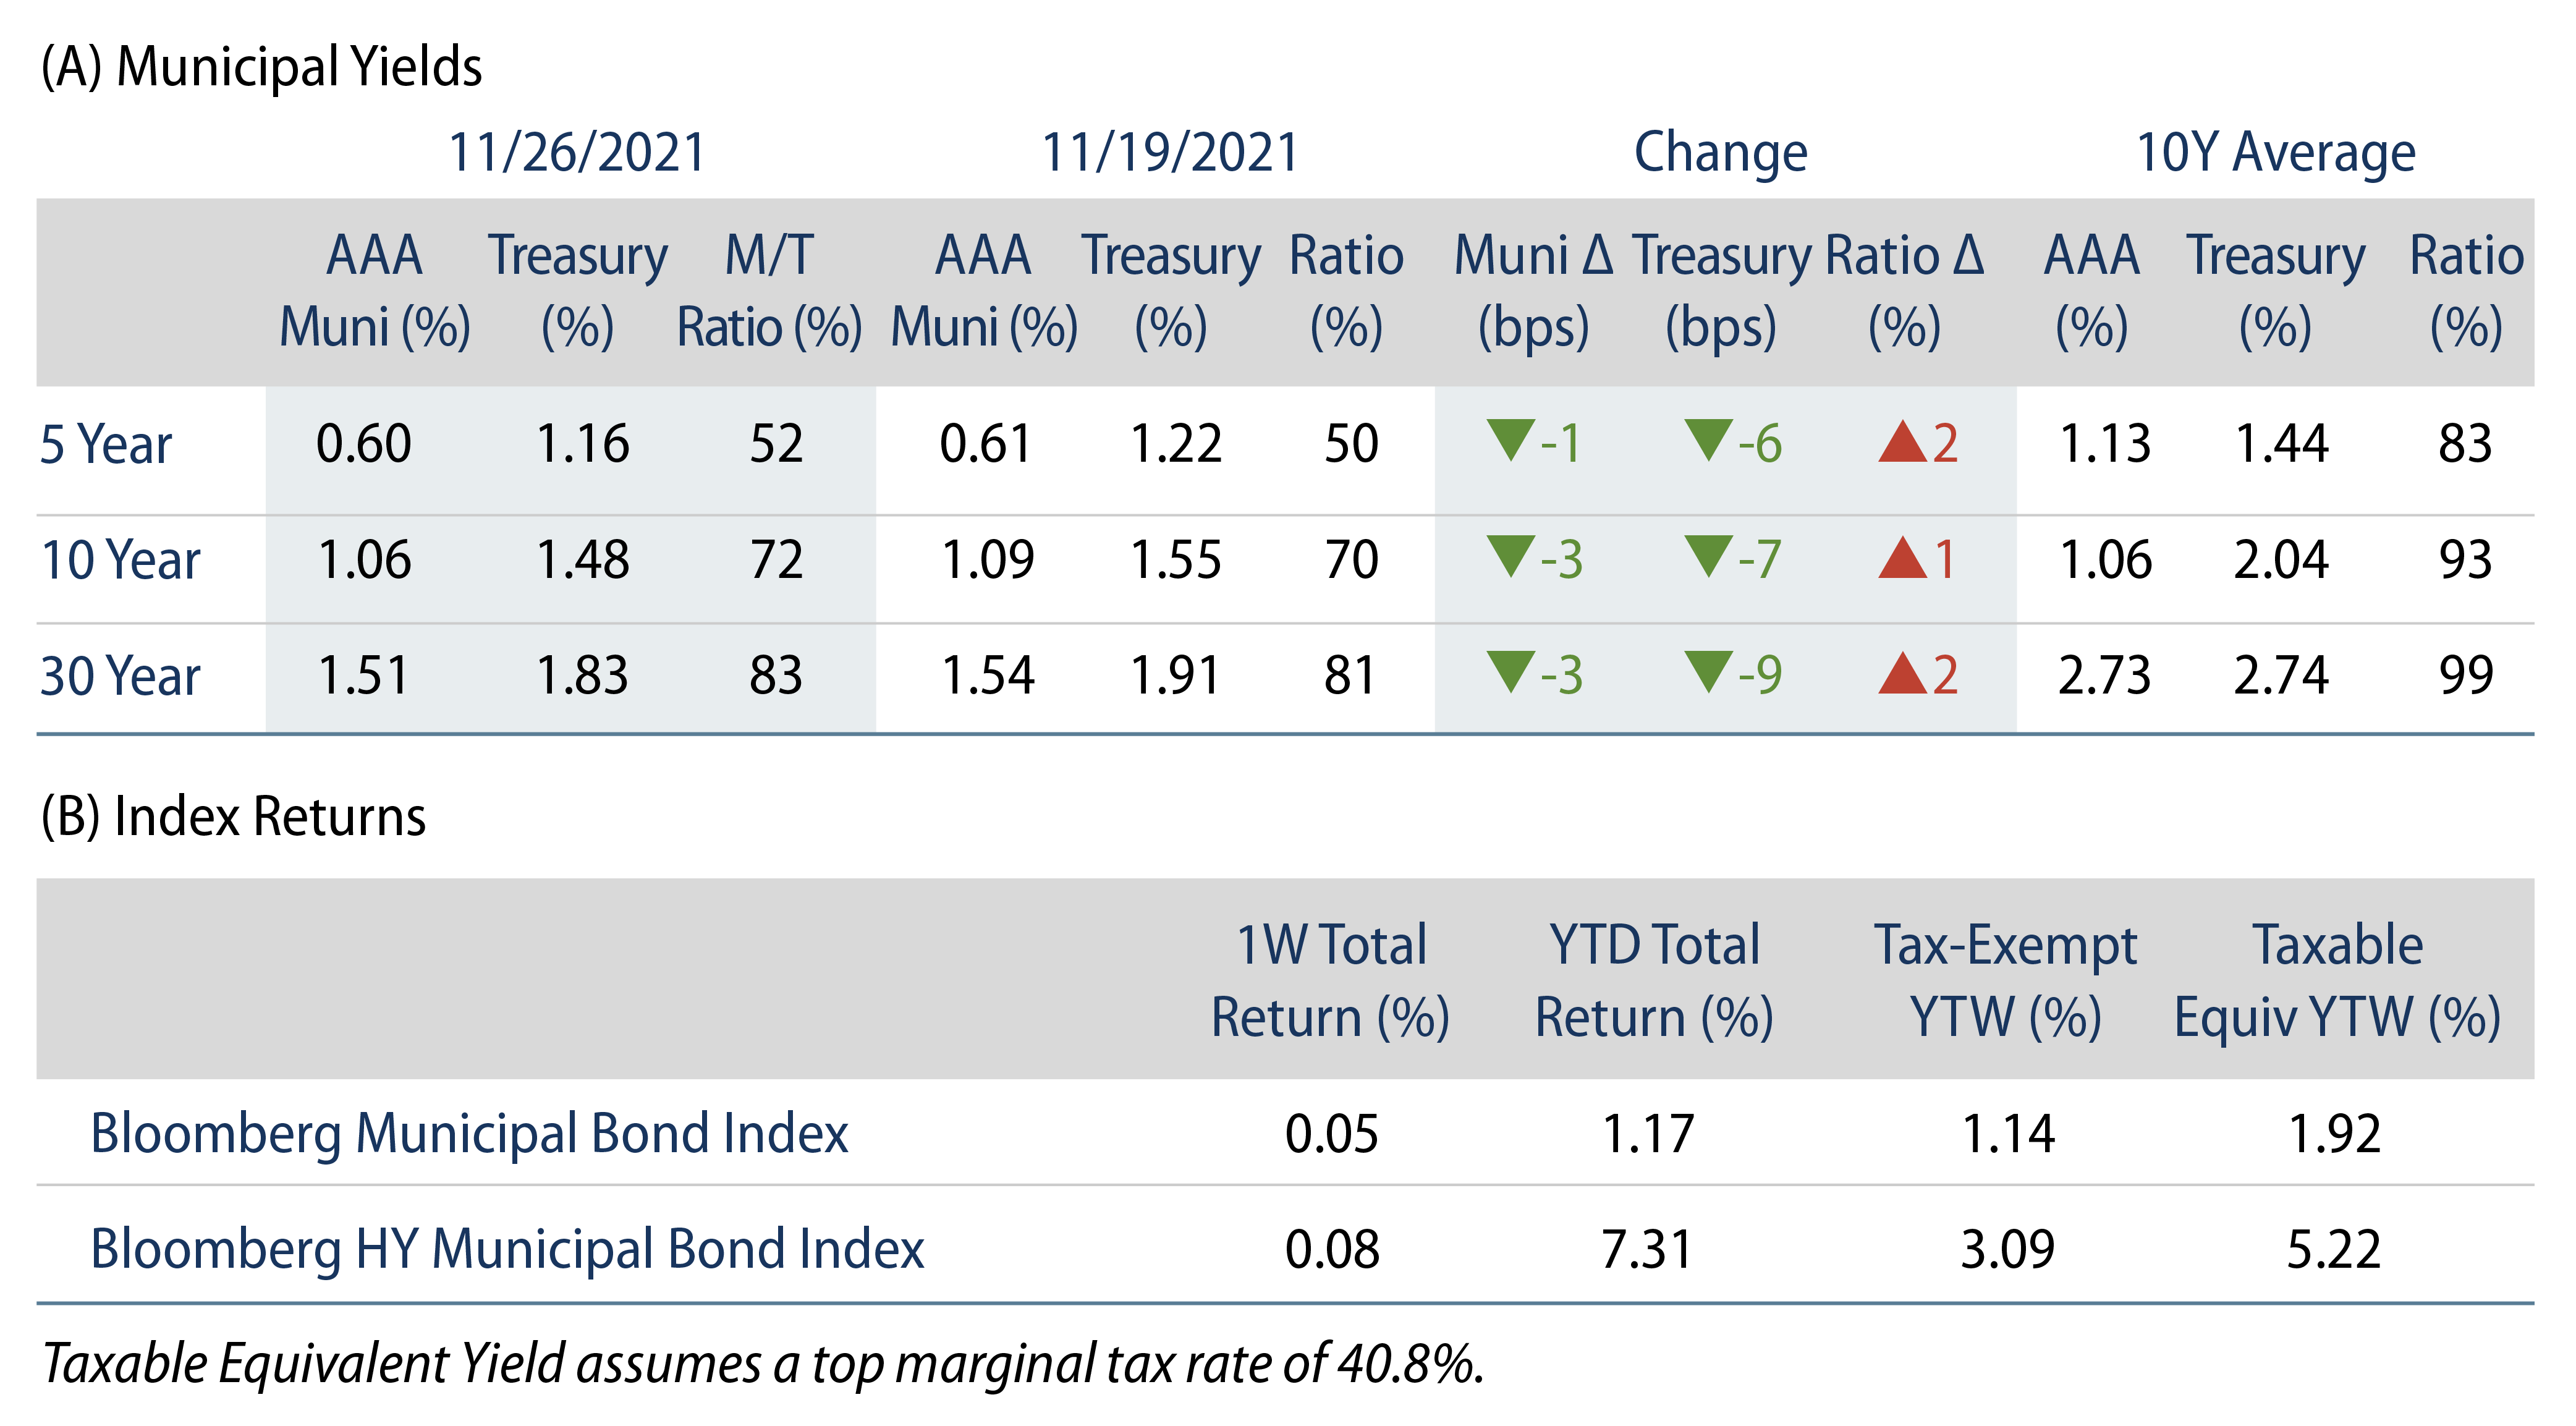
The AAA US muni yield curve moved 1-3 bps lower across the curve. Municipals underperformed Treasuries, resulting in modestly higher ratios. Fund flows extended a record amid limited supply in the holiday-shortened week. The Bloomberg Municipal Index returned 0.05%, while the HY Muni Index returned 0.08%. This week we look at the recently released state expenditure report from the National Association of State Budget Officers (NASBO), highlighting improving municipal credit trends.

Fund Flows Extend a Record Pace as Supply Dwindles

Fund Flows: During the week ending November 24, municipal mutual funds recorded $720 million of net inflows. Long-term funds recorded $745 million of inflows, high-yield funds recorded $408 million of inflows and intermediate funds recorded $244 million of inflows. Municipal mutual funds have now recorded inflows 79 of the last 80 weeks, extending the record inflow cycle to $158.3 billion, with year-to-date (YTD) net inflows surpassing a record calendar year pace at $97 billion.

Supply: The muni market recorded just $1.5 billion of new-issue volume during the holiday-shortened week, down 91% from the prior week. Total YTD issuance of $424 billion is 2% lower from last year’s levels, with tax-exempt issuance trending 7% higher year-over-year (YoY) and taxable issuance trending 22% lower YoY. This week’s new-issue calendar is expected ramp back up to approximately $11 billion. The largest deals include $4 billion Metropolitan Transportation Authority (MTA) Grant Anticipation Notes and $600 million Illinois Toll Highway Authority transactions.

This Week in Munis—Ongoing Budget Improvements Spur Upgrades

This month, NASBO released its 2021 State Expenditure Report, reflecting 16.2% YoY growth in state spending during the year. State spending of federal dollars rose 35.7% during the year, while expenditures from NASBO’s own coffers rose only 5.7%. The large federal spending increase was no surprise considering the COVID-19 spending associated with the approximately $500 billion of federal stimulus measures that directly supported states and localities. As we highlighted in this blog last month, State and Local Tax Revenues Shine, robust state and local revenue growth have more than offset the reported uptick in spending from state coffers during the year. This was also included in NASBO’s report, which described how 2021 state revenues increased 13% over fiscal-year 2020 levels.

The credit improvement is perhaps most staggering in the state of California. Following a fiscal year that initially estimated a $54 billion shortfall due to Covid concerns, California closed fiscal-year 2021 with a surplus of $47 billion. California’s budgetary strength has been driven by substantial growth in general fund revenues, driven by $25 billion in personal income tax growth and almost a $7 billion increase in corporate tax collections. In addition to the revenue gains, the state also received $27 billion in federal ARPA funds. Notably, under the 1979 State Appropriations Limit Law, spending increases are capped by inflation and population growth, and therefore California can’t just spend all of its windfall. Surplus funds are to be split evenly between the schools and taxpayers, or the state could choose to lower or rebate taxes, which we deem increasingly likely.

Exhibit 1: Moody’s Upgrade/Downgrade Ratio (by Issuer)
Moody’s Upgrade/Downgrade Ratio (by Issuer)Spreads
Source: Moody’s Investors Service. As of 30 Sep 21. Select the image to expand the view.

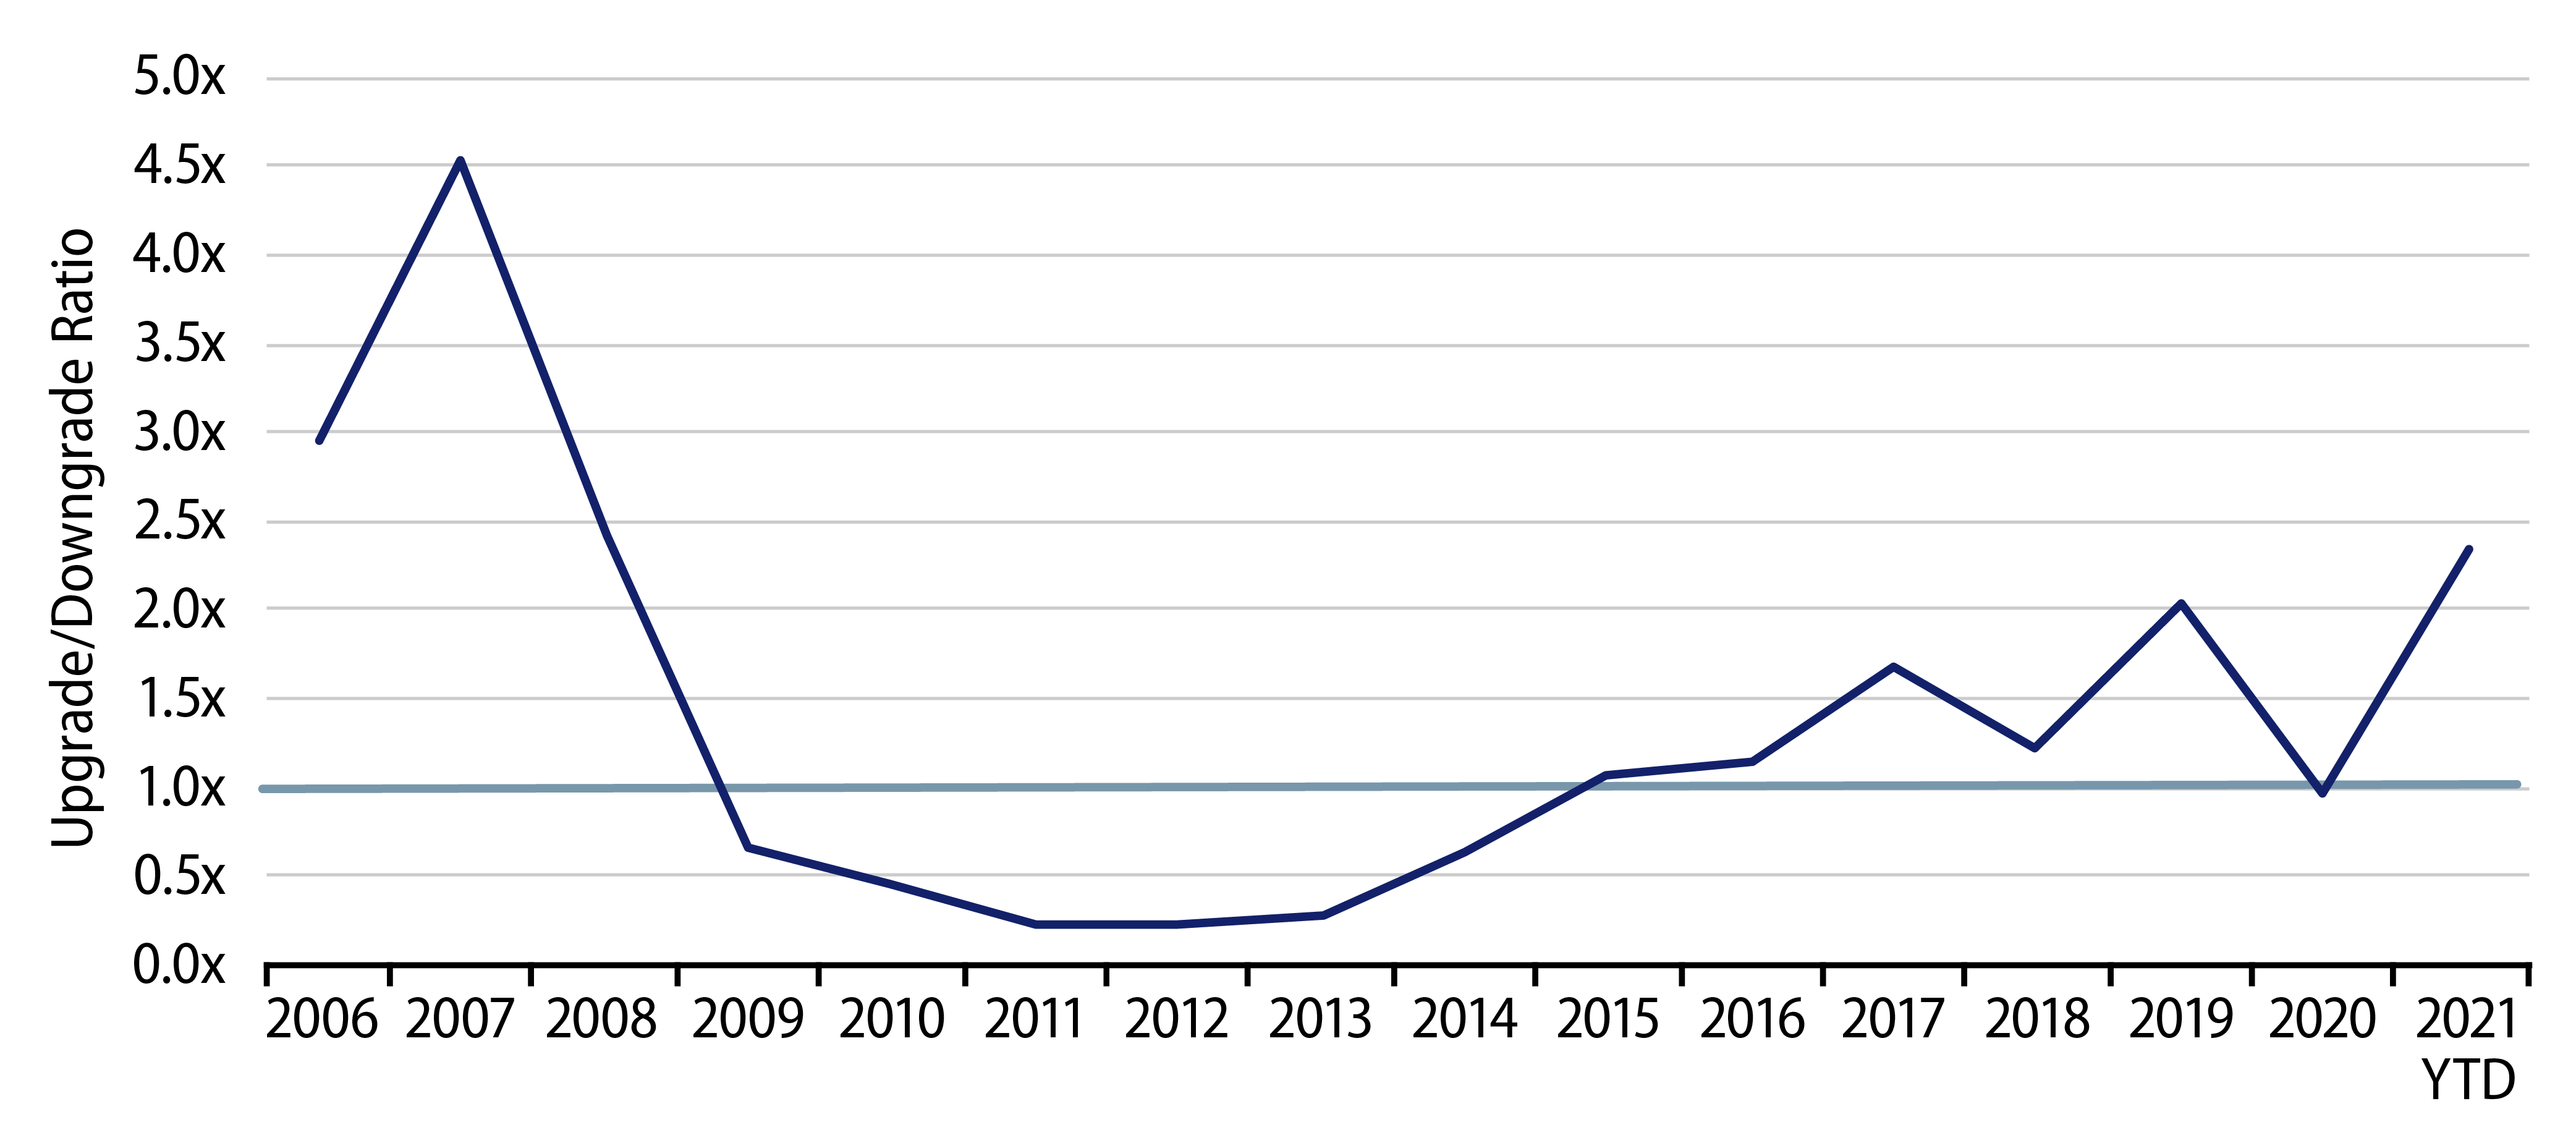
Rating agencies are also accounting for these budget improvements in their credit rating actions. In the first three quarters of 2021, Moody’s upgraded 393 issuers and downgraded 293 issuers, marking the highest year of upgrades relative to downgrades since 2008. We expect this positive trend to continue into early 2022. Issuers that have experienced heavy downgrade pressure over the last decade are receiving positive credit outlooks, and earlier this month S&P revised its outlook on Illinois’ BBB rating from stable to positive, joining Fitch, which improved its outlook to positive last June.

Exhibit 2: Municipal Bond Yields and Index Return
Municipal Bond Yields and Index Return
Source: Bloomberg. As of 26 Nov 21. Select the image to expand the view.
Exhibit 3: Tax-Exempt Muni Valuations
Tax-Exempt Muni Valuations
Source: Bloomberg. As of 26 Nov 21. Select the image to expand the view.
© Western Asset Management Company, LLC 2024. The information contained in these materials ("the materials") is intended for the exclusive use of the designated recipient ("the recipient"). This information is proprietary and confidential and may contain commercially sensitive information, and may not be copied, reproduced or republished, in whole or in part, without the prior written consent of Western Asset Management Company ("Western Asset").
Past performance does not predict future returns. These materials should not be deemed to be a prediction or projection of future performance. These materials are intended for investment professionals including professional clients, eligible counterparties, and qualified investors only.
These materials have been produced for illustrative and informational purposes only. These materials contain Western Asset's opinions and beliefs as of the date designated on the materials; these views are subject to change and may not reflect real-time market developments and investment views.
Third party data may be used throughout the materials, and this data is believed to be accurate to the best of Western Asset's knowledge at the time of publication, but cannot be guaranteed. These materials may also contain strategy or product awards or rankings from independent third parties or industry publications which are based on unbiased quantitative and/or qualitative information determined independently by each third party or publication. In some cases, Western Asset may subscribe to these third party's standard industry services or publications. These standard subscriptions and services are available to all asset managers and do not influence rankings or awards in any way.
Investment strategies or products discussed herein may involve a high degree of risk, including the loss of some or all capital. Investments in any products or strategies described in these materials may be volatile, and investors should have the financial ability and willingness to accept such risks.
Unless otherwise noted, investment performance contained in these materials is reflective of a strategy composite. All other strategy data and information included in these materials reflects a representative portfolio which is an account in the composite that Western Asset believes most closely reflects the current portfolio management style of the strategy. Performance is not a consideration in the selection of the representative portfolio. The characteristics of the representative portfolio shown may differ from other accounts in the composite. Information regarding the representative portfolio and the other accounts in the composite are available upon request. Statements in these materials should not be considered investment advice. References, either general or specific, to securities and/or issuers in the materials are for illustrative purposes only and are not intended to be, and should not be interpreted as, recommendation to purchase or sell such securities. Employees and/or clients of Western Asset may have a position in the securities or issuers mentioned.
These materials are not intended to provide, and should not be relied on for, accounting, legal, tax, investment or other advice. The recipient should consult its own counsel, accountant, investment, tax, and any other advisers for this advice, including economic risks and merits, related to making an investment with Western Asset. The recipient is responsible for observing the applicable laws and regulations of their country of residence.
Founded in 1971, Western Asset Management Company is a global fixed-income investment manager with offices in Pasadena, New York, London, Singapore, Tokyo, Melbourne, São Paulo, Hong Kong, and Zürich. Western Asset is a wholly owned subsidiary of Franklin Resources, Inc. but operates autonomously. Western Asset is comprised of six legal entities across the globe, each with distinct regional registrations: Western Asset Management Company, LLC, a registered Investment Adviser with the Securities and Exchange Commission; Western Asset Management Company Distribuidora de Títulos e Valores Mobiliários Limitada is authorized and regulated by Comissão de Valores Mobiliários and Brazilian Central Bank; Western Asset Management Company Pty Ltd ABN 41 117 767 923 is the holder of the Australian Financial Services License 303160; Western Asset Management Company Pte. Ltd. Co. Reg. No. 200007692R is a holder of a Capital Markets Services License for fund management and regulated by the Monetary Authority of Singapore; Western Asset Management Company Ltd, a registered Financial Instruments Business Operator and regulated by the Financial Services Agency of Japan; and Western Asset Management Company Limited is authorised and regulated by the Financial Conduct Authority ("FCA") (FRN 145930). This communication is intended for distribution to Professional Clients only if deemed to be a financial promotion in the UK as defined by the FCA. This communication may also be intended for certain EEA countries where Western Asset has been granted permission to do so. For the current list of the approved EEA countries please contact Western Asset at +44 (0)20 7422 3000.