skip navigation
Blog

Stay up to date on timely topics and market events. Subscribe to our Blog now.

MARKETS
30 January 2024

Weekly Municipal Monitor—Muni Payrolls Recover

By Sam Weitzman

Stay up to date on timely topics and market events. Subscribe to our Blog now.

Investment-Grade Municipals Posted Negative Returns Last Week

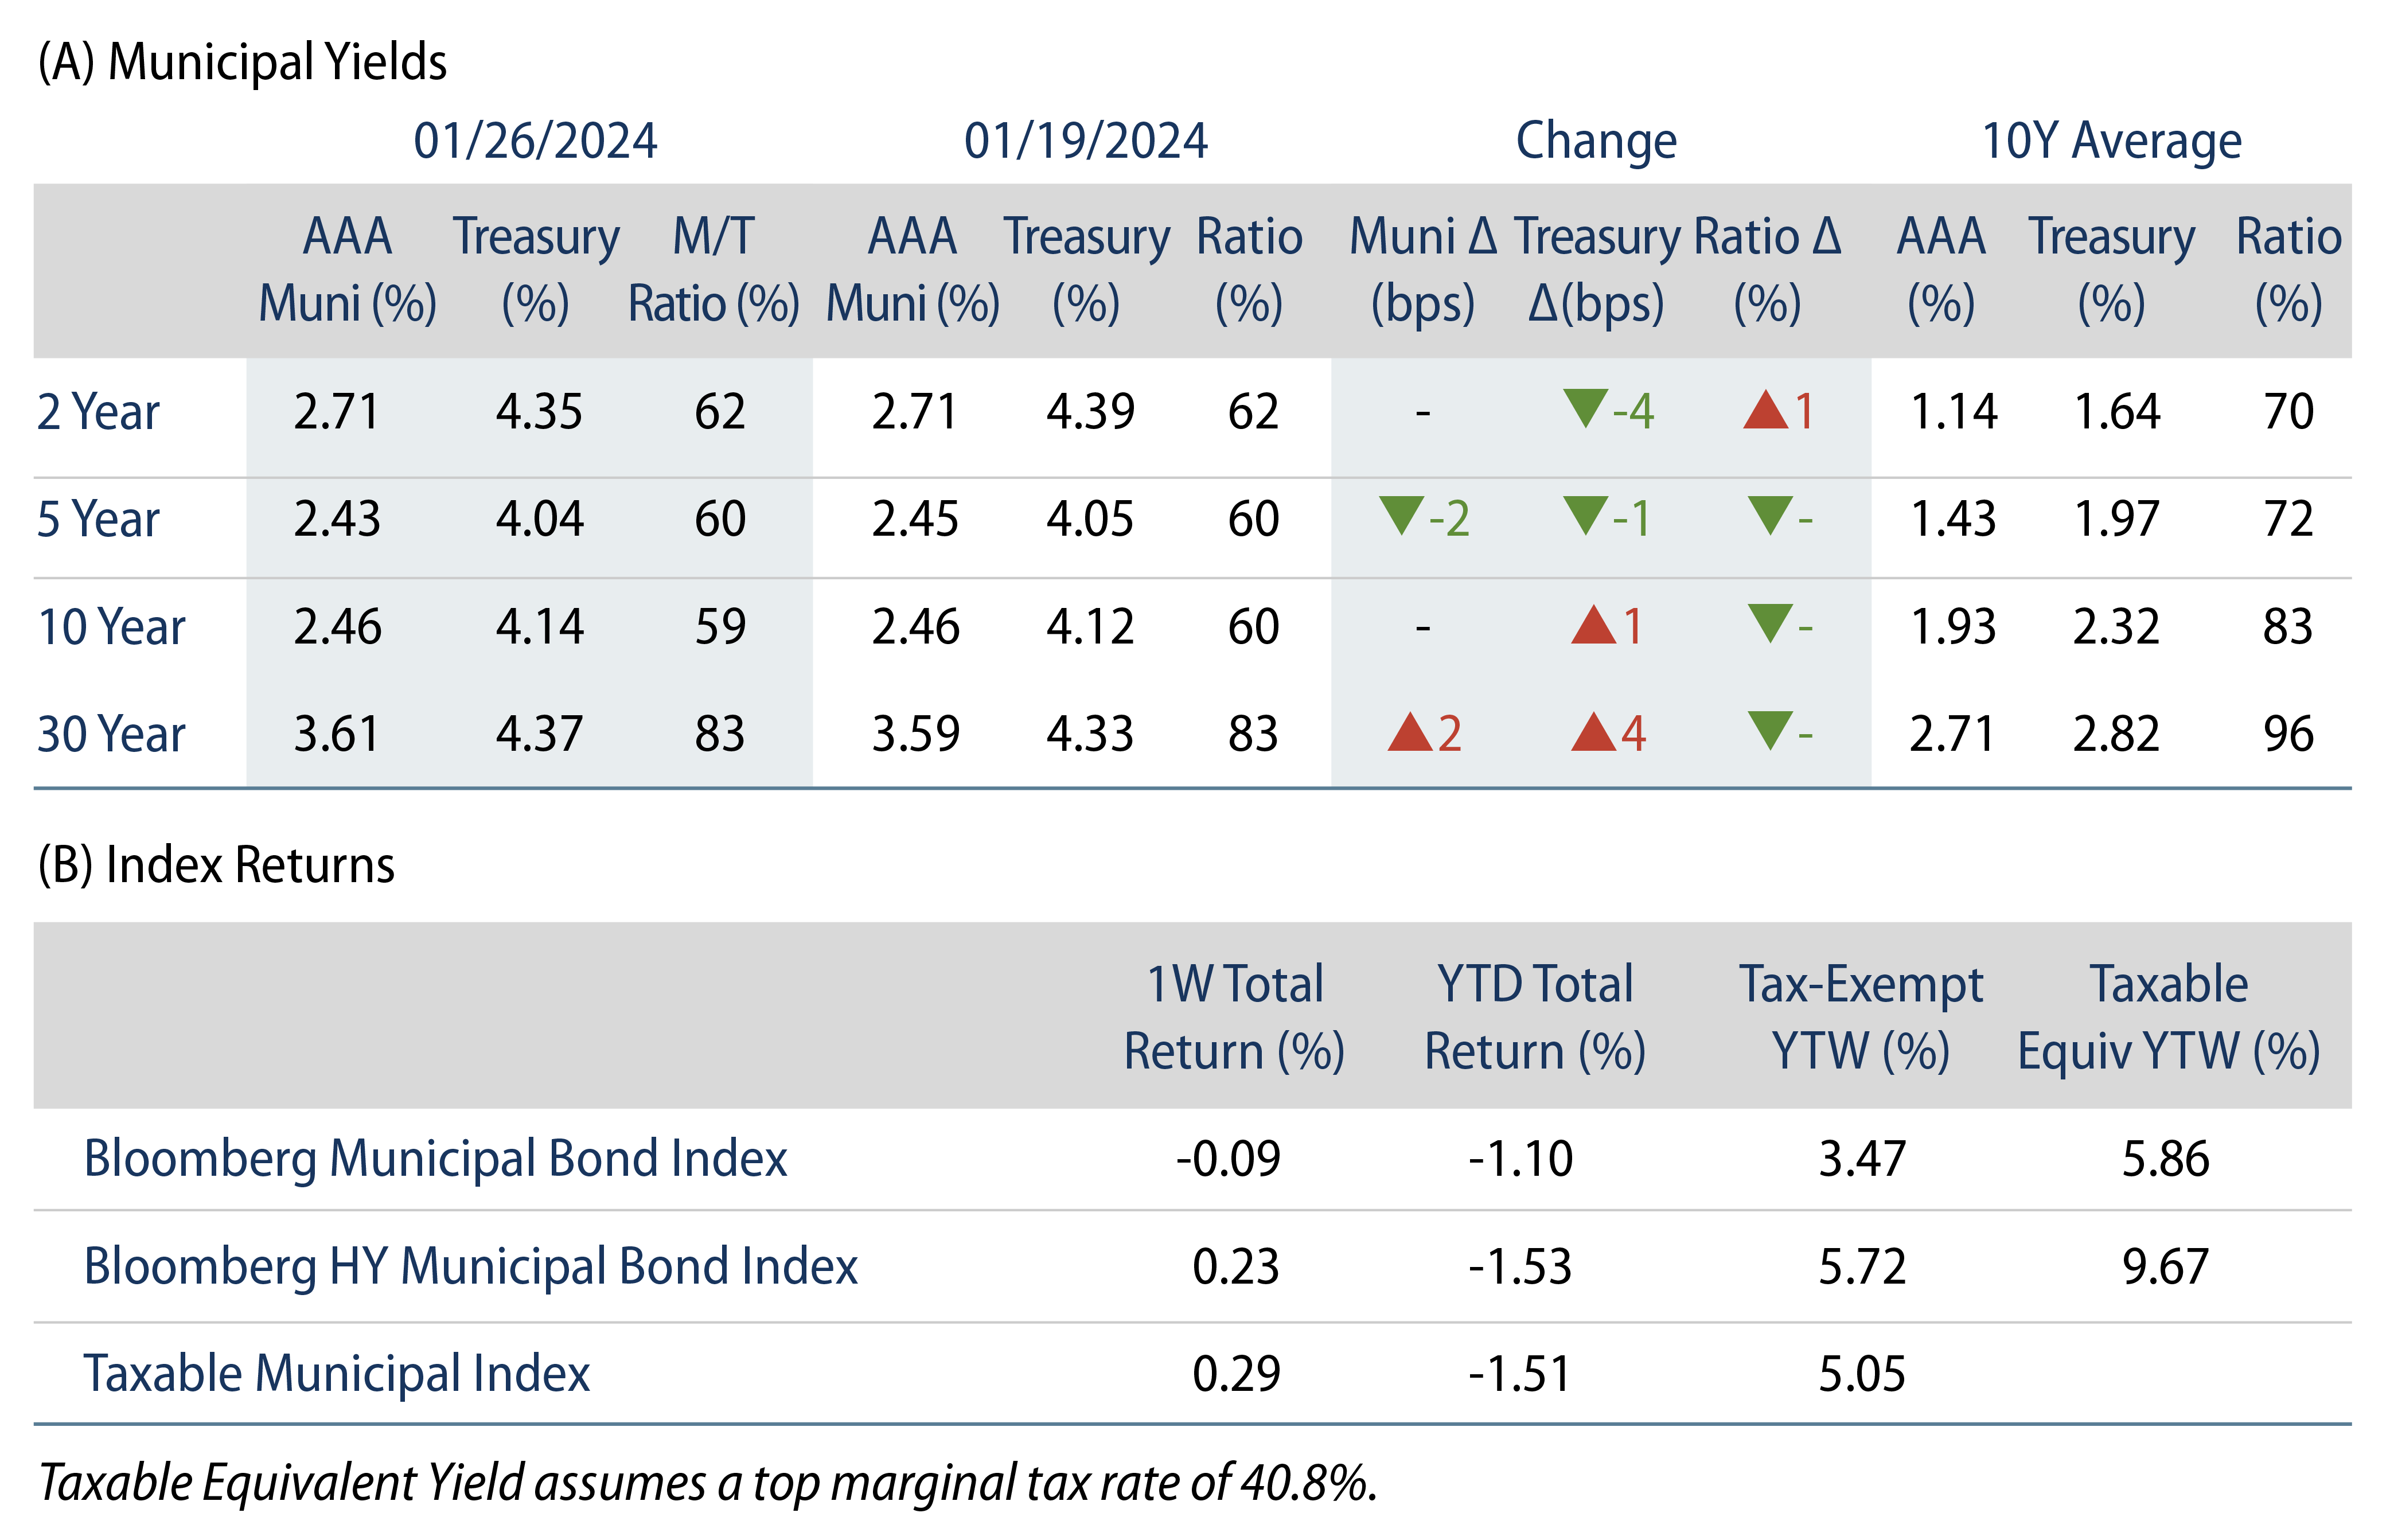
Investment-grade munis posted negative returns last week as the yield curve steepened following higher-than-anticipated Q423 GDP data and a continued downtrend in core Personal Consumption Expenditures (PCE) inflation, which fell to 2.90% year-over-year (YoY). High-grade muni yields moved 2 bps lower in short maturities and 2 bps higher in long maturities. Meanwhile, market technicals improved with municipal mutual funds recording inflows. The Bloomberg Municipal Index returned -0.09% during the week, the High Yield Muni Index returned 0.23% and the Taxable Muni Index returned 0.29%. Ahead of this week’s nonfarm payroll report, we highlight recent state and local employment trends.

Technicals Remained Solid Amid Improving Flows

Fund Flows: During the week ending January 26, weekly reporting municipal mutual funds recorded $211 million of net inflows, according to Lipper. Long-term funds recorded $227 million of inflows, high-yield funds recorded $1 million of inflows and intermediate funds recorded $109 million of inflows. This week’s inflows mark the third consecutive week of inflows and lead year-to-date (YTD) net mutual fund flows higher to $590 million.

Supply: The muni market recorded $9 billion of new-issue volume last week, in line with the prior week. YTD issuance of $29 billion is 80% higher from last year’s level, with tax-exempt issuance up 87% and taxable issuance up 9% YoY. This week’s calendar is expected fall to $5 billion. Largest deals include $1 billion New York State Thruway Authority and $800 million Triborough Bridge & Tunnel Authority (MTA Bridge and Tunnel) transactions.

This Week in Munis: Muni Payrolls Recover

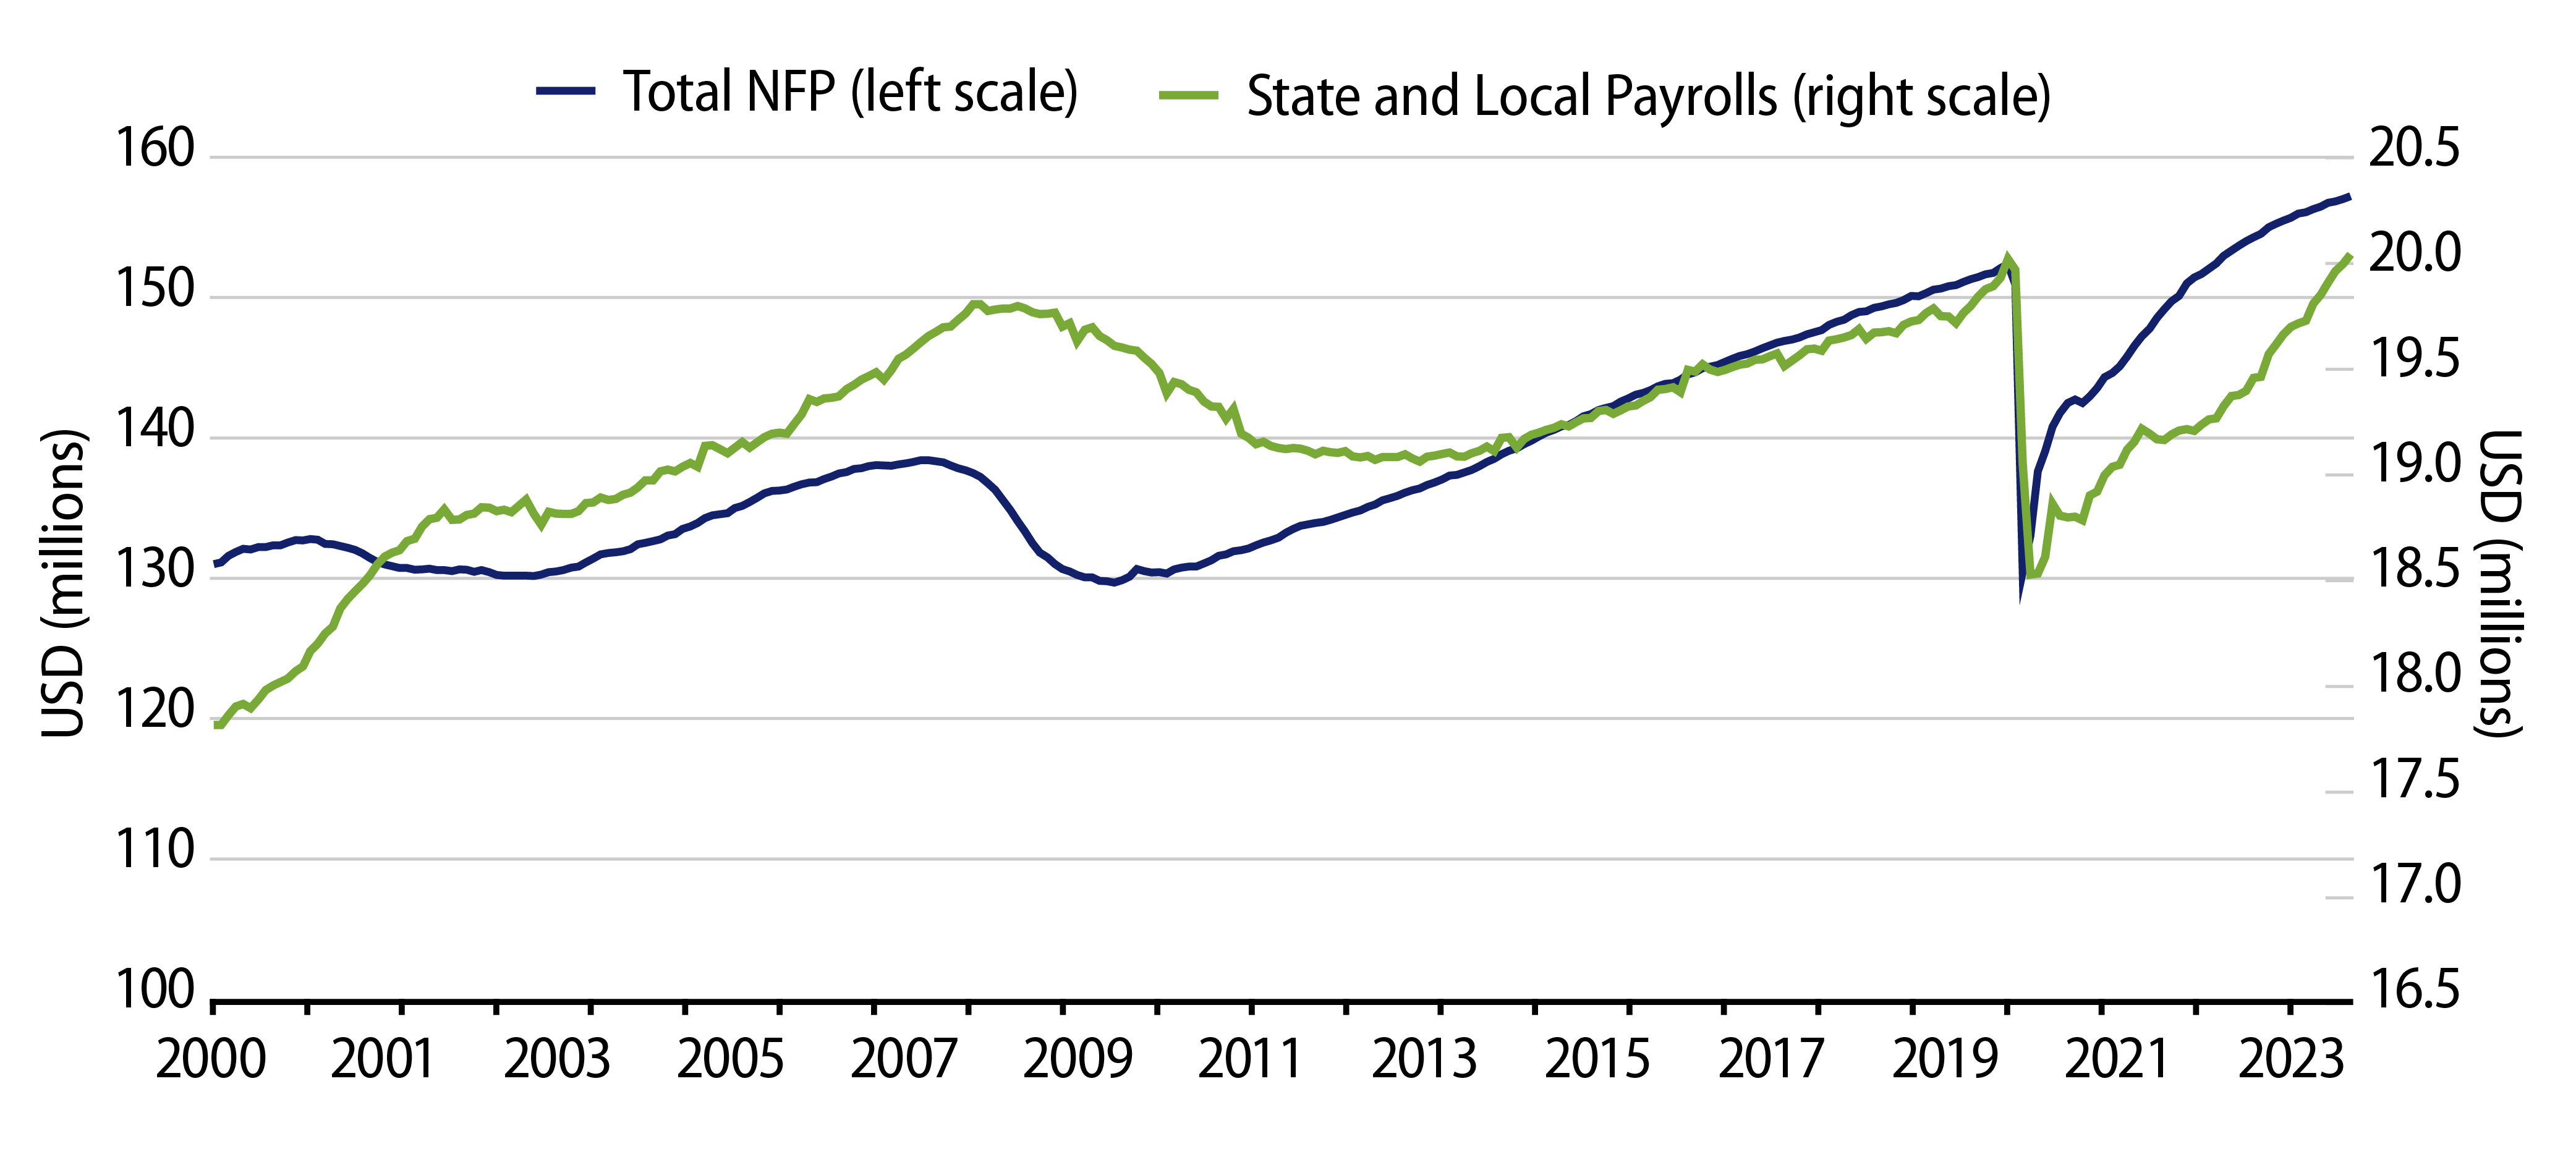
During the pandemic recovery from late 2020 through 2022, public sector employment growth underperformed the private sector. National nonfarm payrolls recovered to pre-pandemic highs in June 2022, state and local payrolls did not fully recover until last month when payrolls crossed the pre-pandemic high of 20 million. The recent public sector recovery follows robust payroll growth in 2023, with state payrolls increasing 5.1% YoY to 5.4 million in December and local payrolls increasing 2.4% to 14.7 million, each outperforming the 1.7% growth observed by national nonfarm payrolls.

Exhibit 1: US Nonfarm Payrolls vs. State and Local Payrolls (Seasonally Adjusted)
US Nonfarm Payrolls vs. State and Local Payrolls (Seasonally Adjusted)
Source: Bureau of Labor Statistics, Bloomberg, Western Asset. As of 31 Dec 23. Select the image to expand the view.

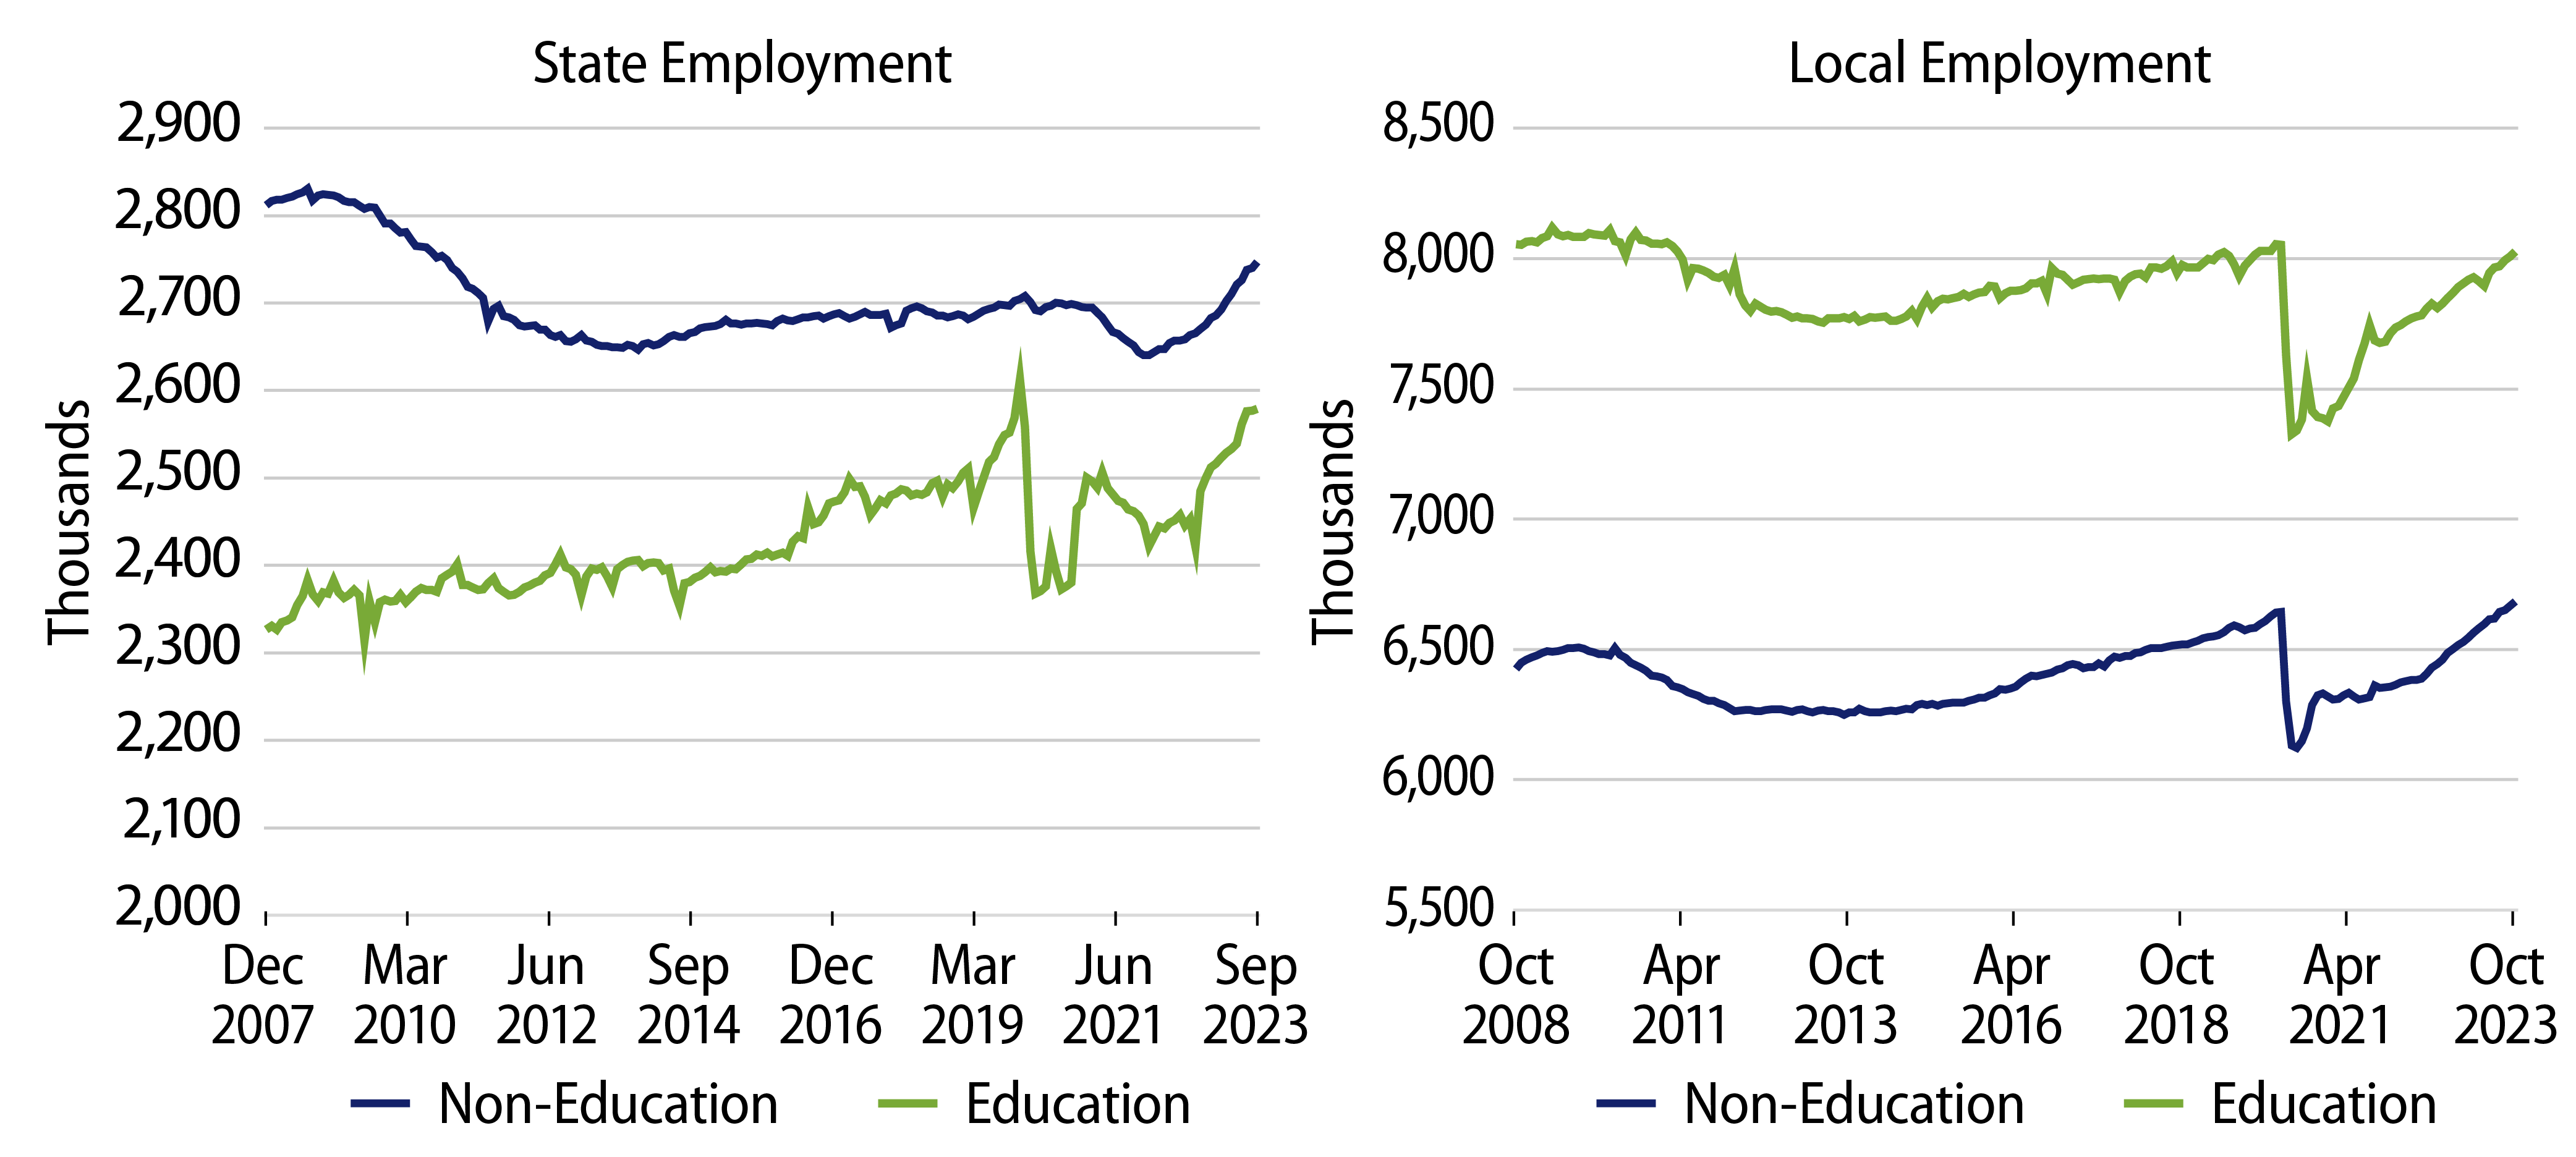
At the state level, non-education employment reached 2.7 million in December, 1.4% above prior March 2020 highs. However, state education employment remains 1.3% below February 2020 highs, indicative of potential structural challenges higher education institutions continue to face following the pandemic.

At the local level, education employment of 8 million is just -0.4% (or 28,000 jobs) shy of pre-pandemic highs. Local non-education employment of 6.7 million is 0.6% higher than the pre-pandemic high-level set in February 2020.

Exhibit 2: State and Local Employment Levels
State and Local Employment Levels
Source: Bureau of Labor Statistics, Bloomberg, Western Asset. As of 31 Dec 23. Select the image to expand the view.

While some questioned whether states and local employment would fully recover following the pandemic drawdowns and ensuing post-pandemic realities, strong public sector employment growth is indicative of the resiliency of muni credit amid tighter economic conditions. The slow early rebound of public-sector employment also reflects the measured spending increases that occurred during high-priced labor conditions, likely contributing to budgetary stability. At the same time, we believe the ongoing recovery in higher education employment reflects post-pandemic realities that challenge certain market segments. As economic conditions continue to tighten, we remain cautious on those issuers that are more susceptible to factors such as tight margins and higher labor costs.

Exhibit 3: Tax-Exempt Muni Credit Curves
Tax-Exempt Muni Credit Curves
Source: Bloomberg, Western Asset. As of 26 Jan 24. Bloomberg BVAL Municipal Credit Indices (AAA, AA, A, BBB, respectively) and US Sovereign Curves. Taxable-Equivalent Muni Credit Curves consider the top marginal effective tax rate of 40.8%. Select the image to expand the view.
Exhibit 4: Taxable-Equivalent Muni Credit Curves
Taxable-Equivalent Muni Credit Curves
Source: Bloomberg, Western Asset. As of 26 Jan 24. Bloomberg BVAL Municipal Credit Indices (AAA, AA, A, BBB, respectively) and US Sovereign Curves. Taxable-Equivalent Muni Credit Curves consider the top marginal effective tax rate of 40.8%. Select the image to expand the view.
Exhibit 5: Municipal Bond Yields and Index Returns
Municipal Bond Yields and Index Returns
Source: Bloomberg. As of 19 Jan 24. Past performance is not a guarantee of future results. It is not possible to invest directly in an Index. Select the image to expand the view.
Exhibit 6: Tax-Exempt and Taxable Muni Valuations
Tax-Exempt and Taxable Muni Valuations
Source: Bloomberg. As of 19 Jan 24. Select the image to expand the view.

Western Asset Key Themes for Muni Investors

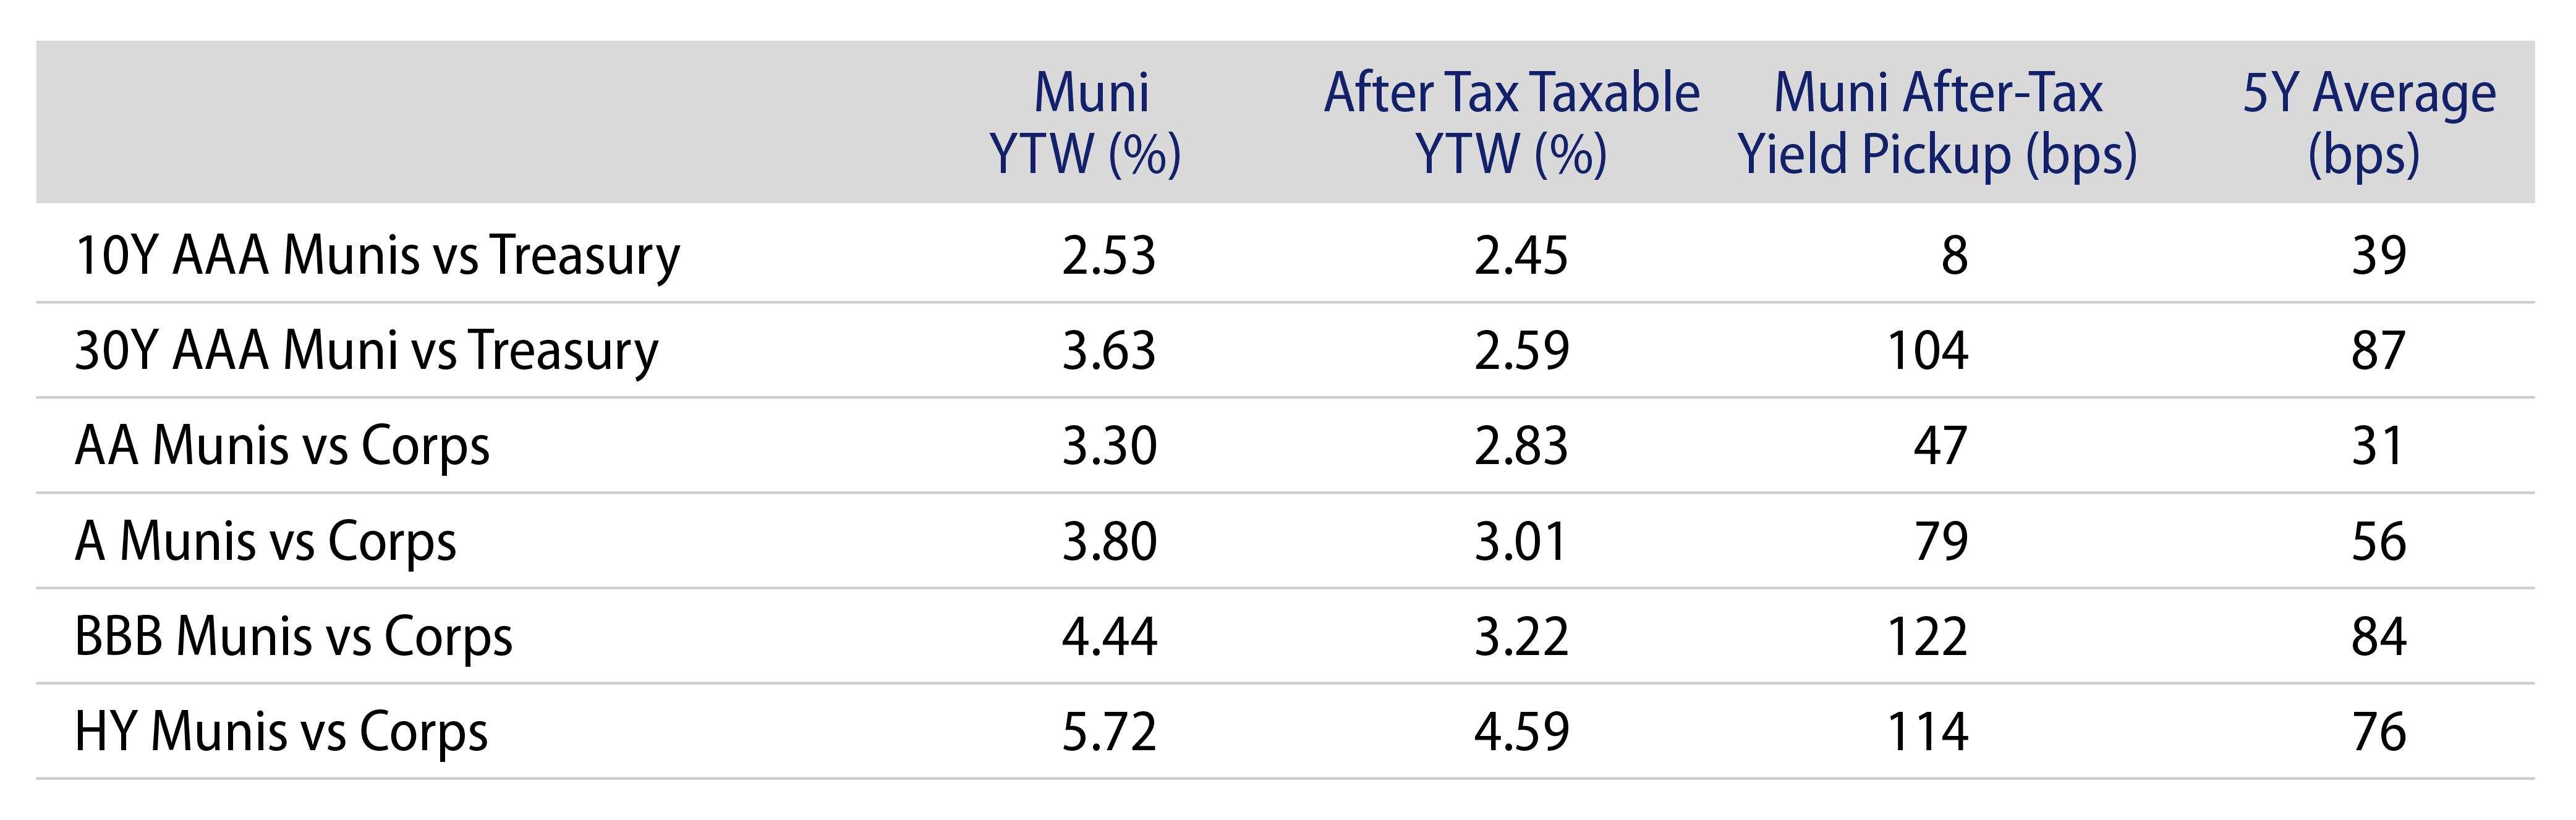
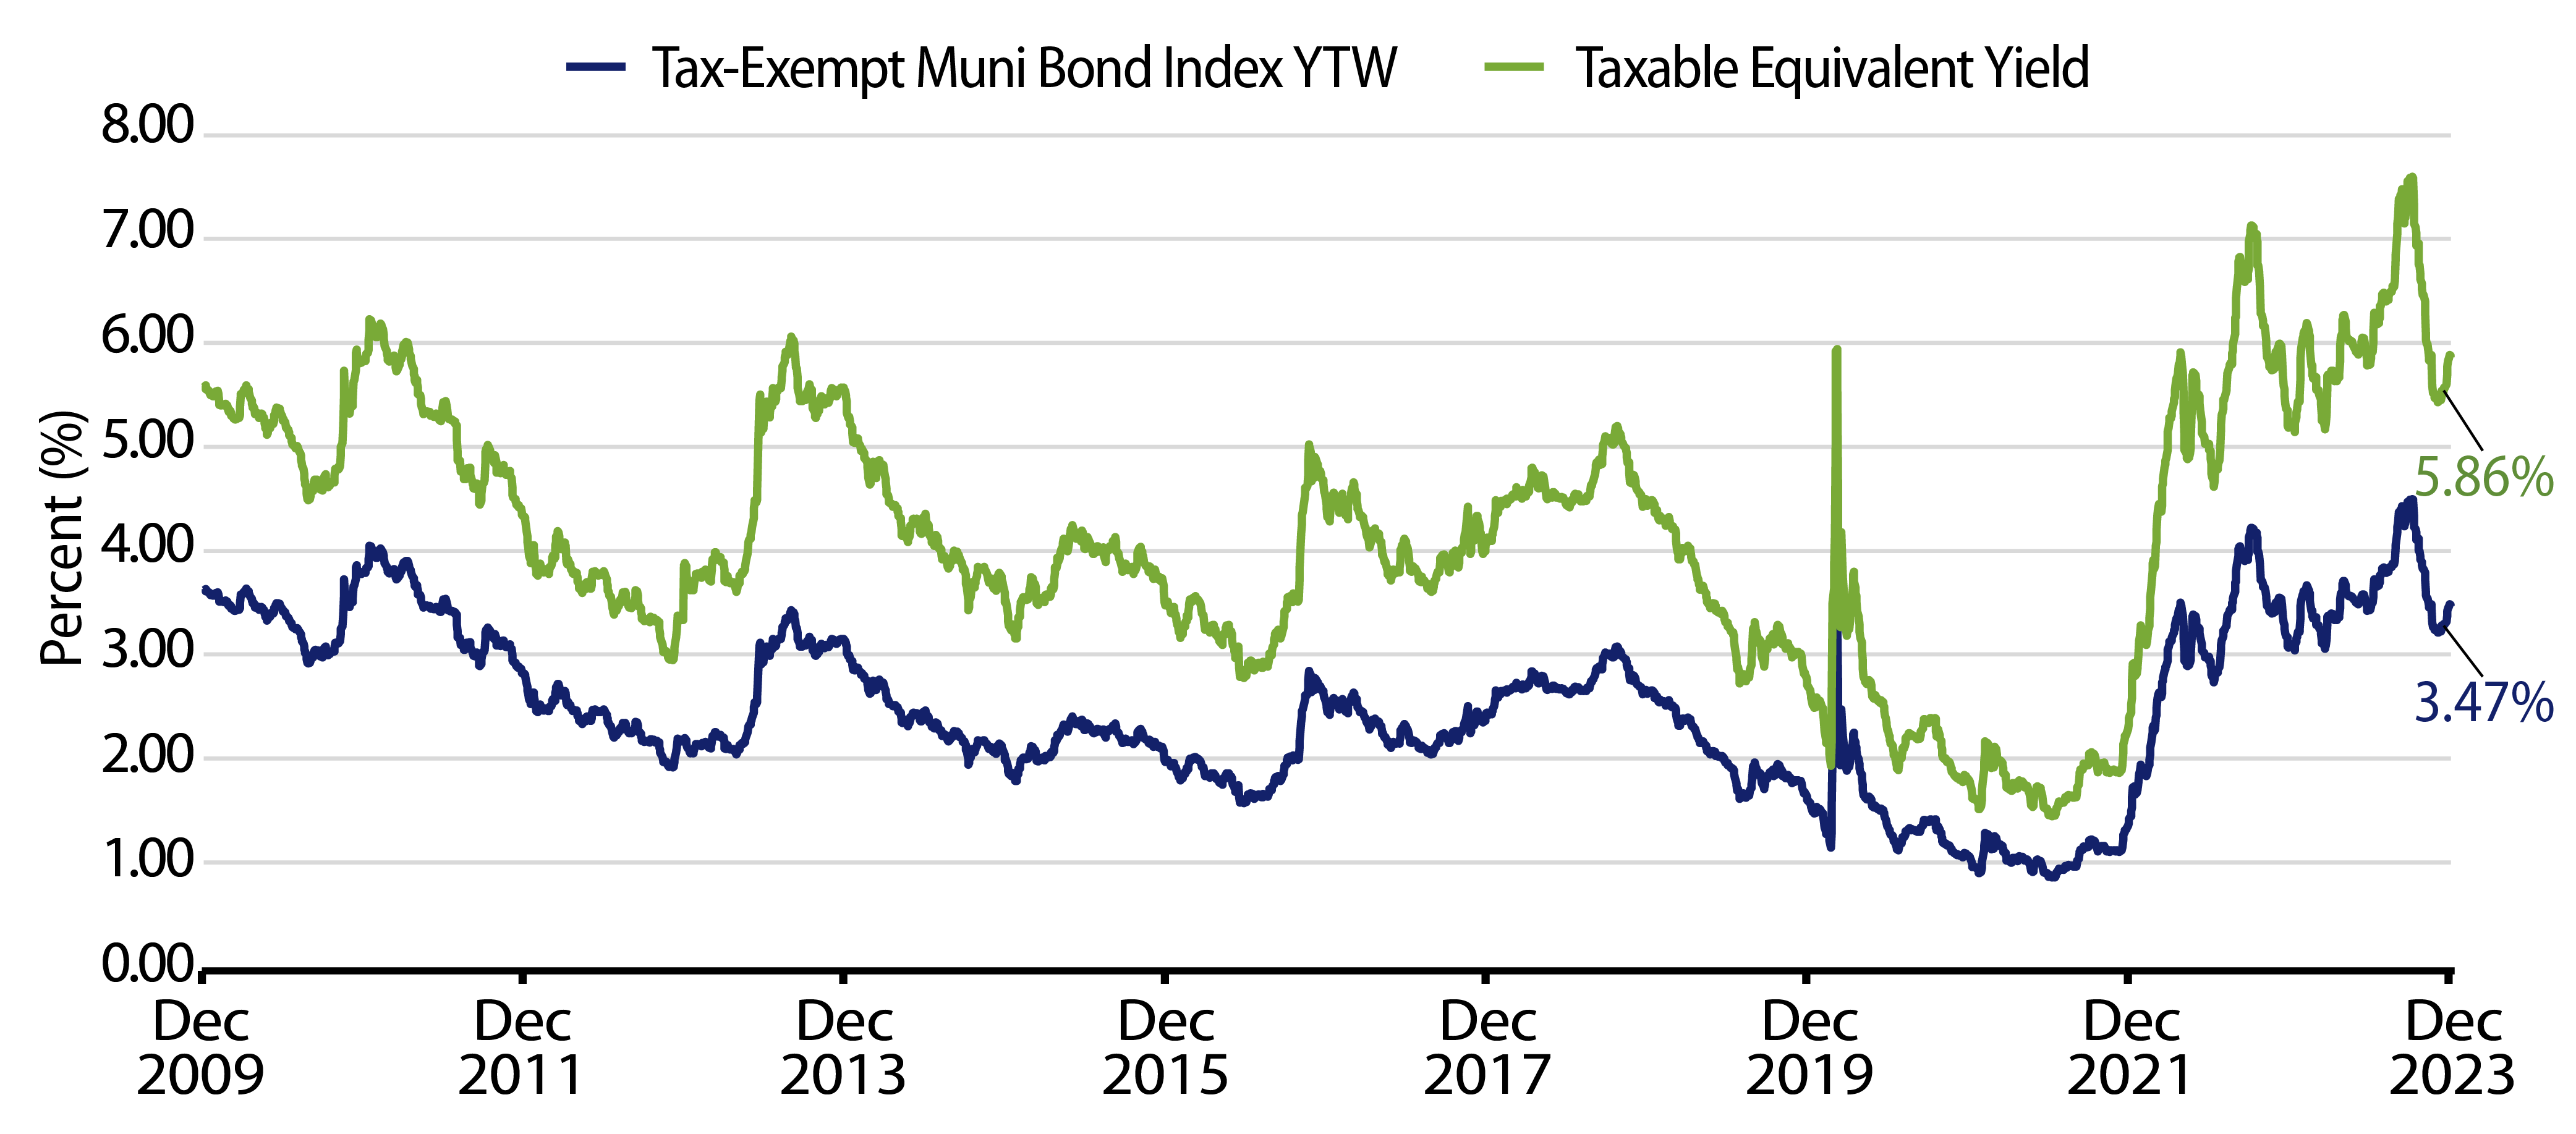
Theme #1: Municipal index yields and taxable-equivalent yields are above decade highs.

Exhibit 7: Muni and Taxable-Equivalent Muni Yield-to-Worst
Muni and Taxable-Equivalent Muni Yield-to-Worst
Source: Bloomberg, Western Asset. As of 26 Jan 24. Bloomberg Municipal Bond Index Yield Considering Highest Marginal Tax Rate. Select the image to expand the view.

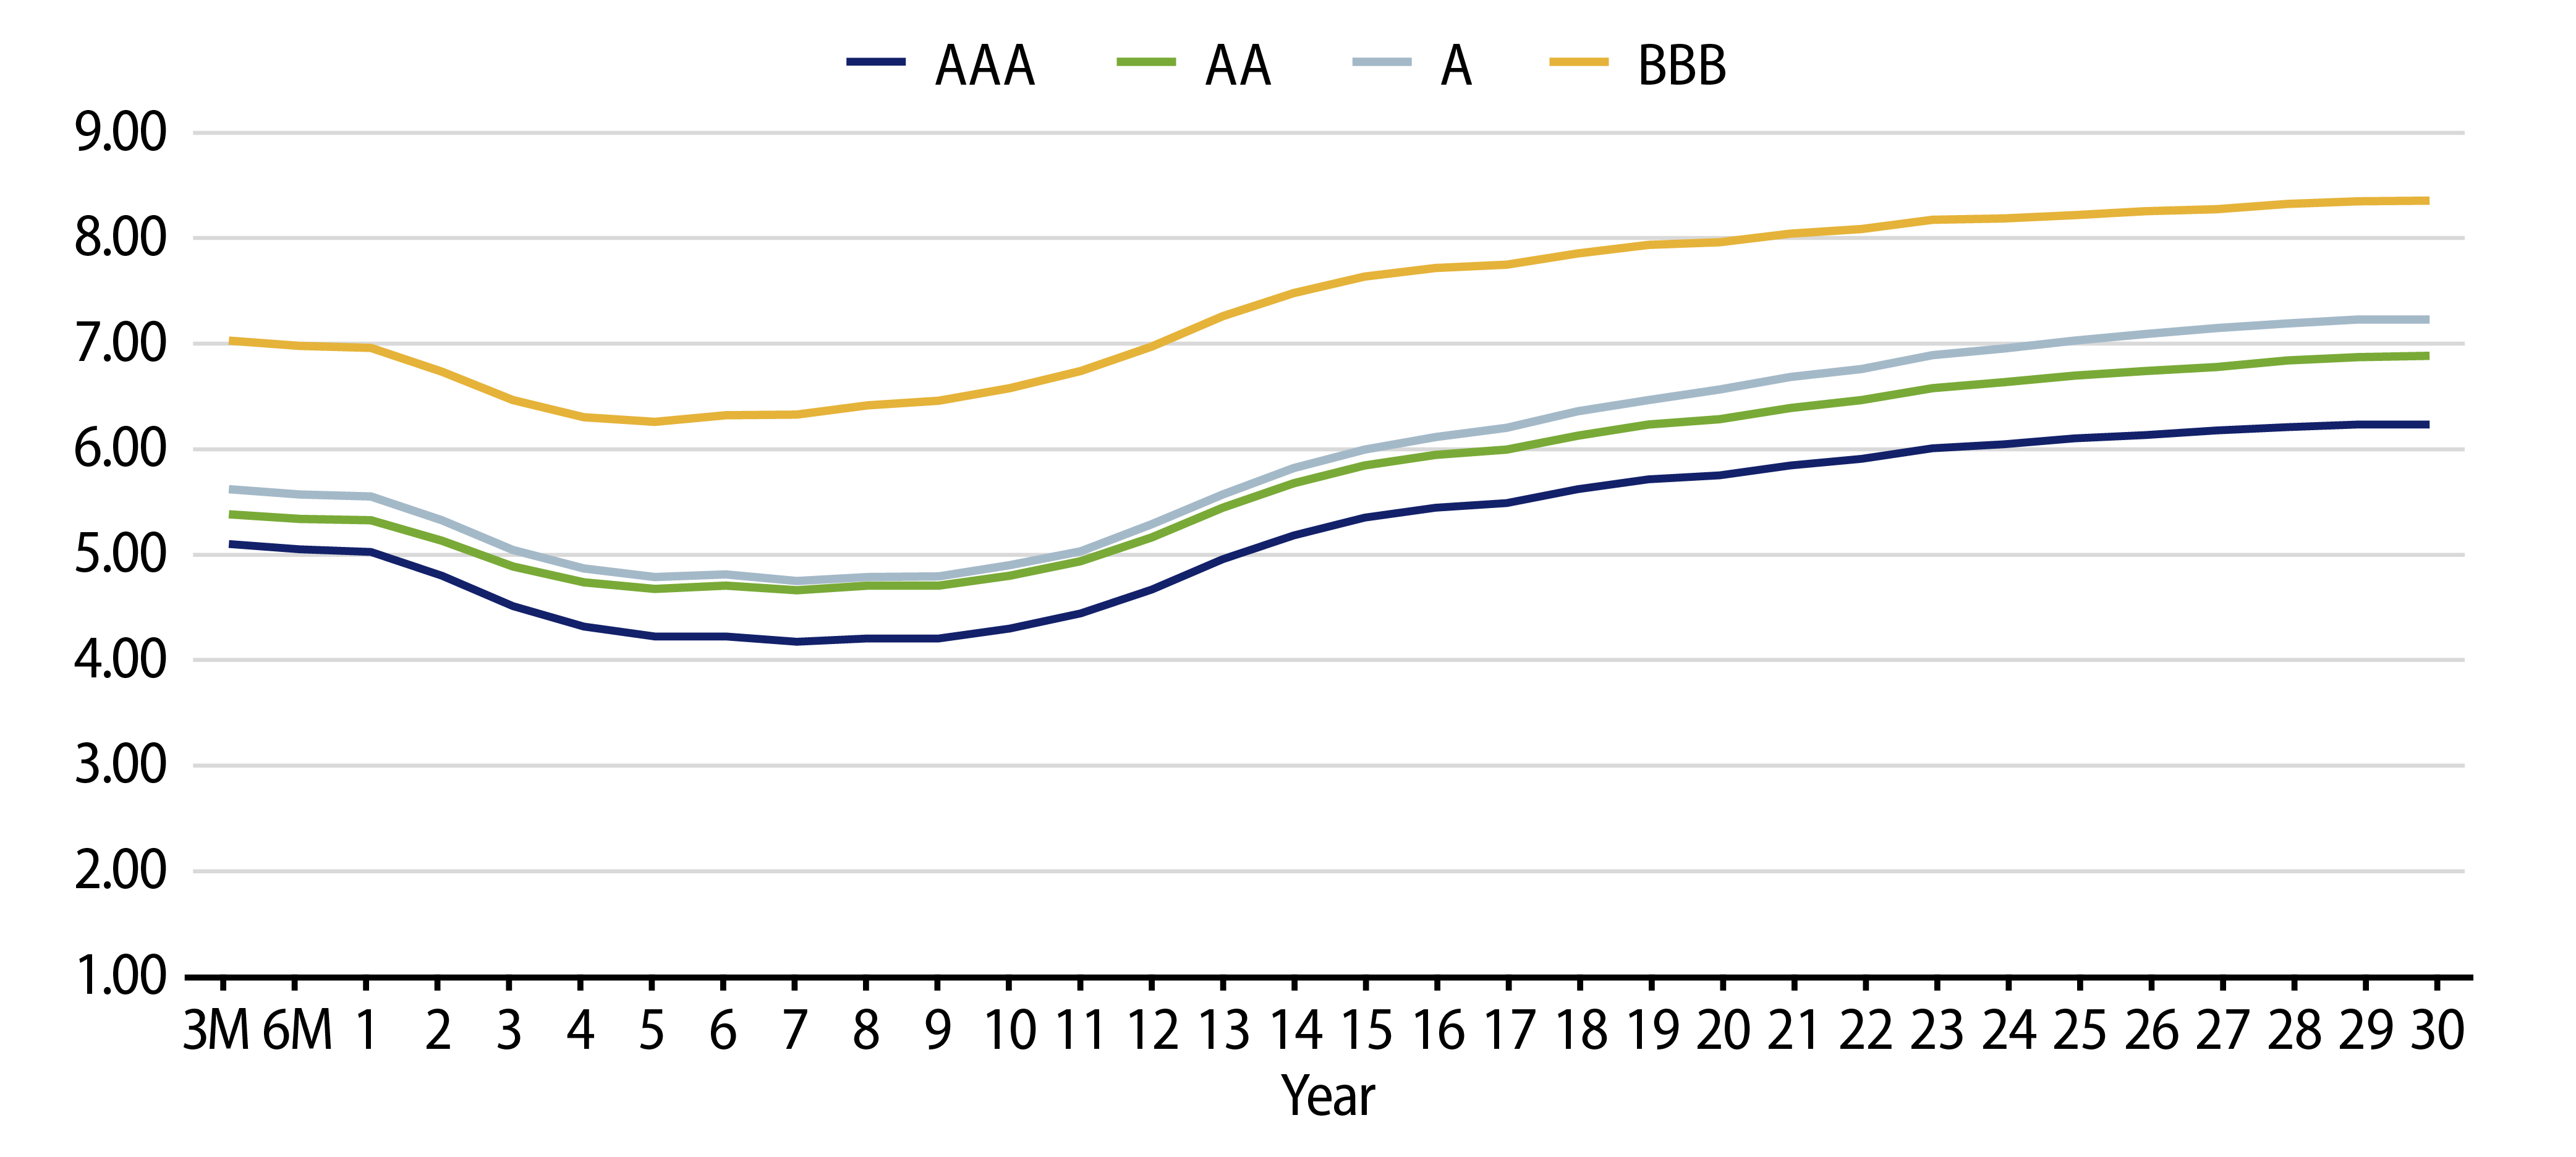
Theme #2: Recent yield curve steepening has highlighted value in longer maturities.

Exhibit 8: AAA Municipal vs. Treasury Yield Curves
AAA Municipal vs. Treasury Yield Curves
Source: Bloomberg, Western Asset. As of 26 Jan 24. Bloomberg BVAL AAA Muni Curve and US On-/Off-the-Run Sovereign Curve. Select the image to expand the view.

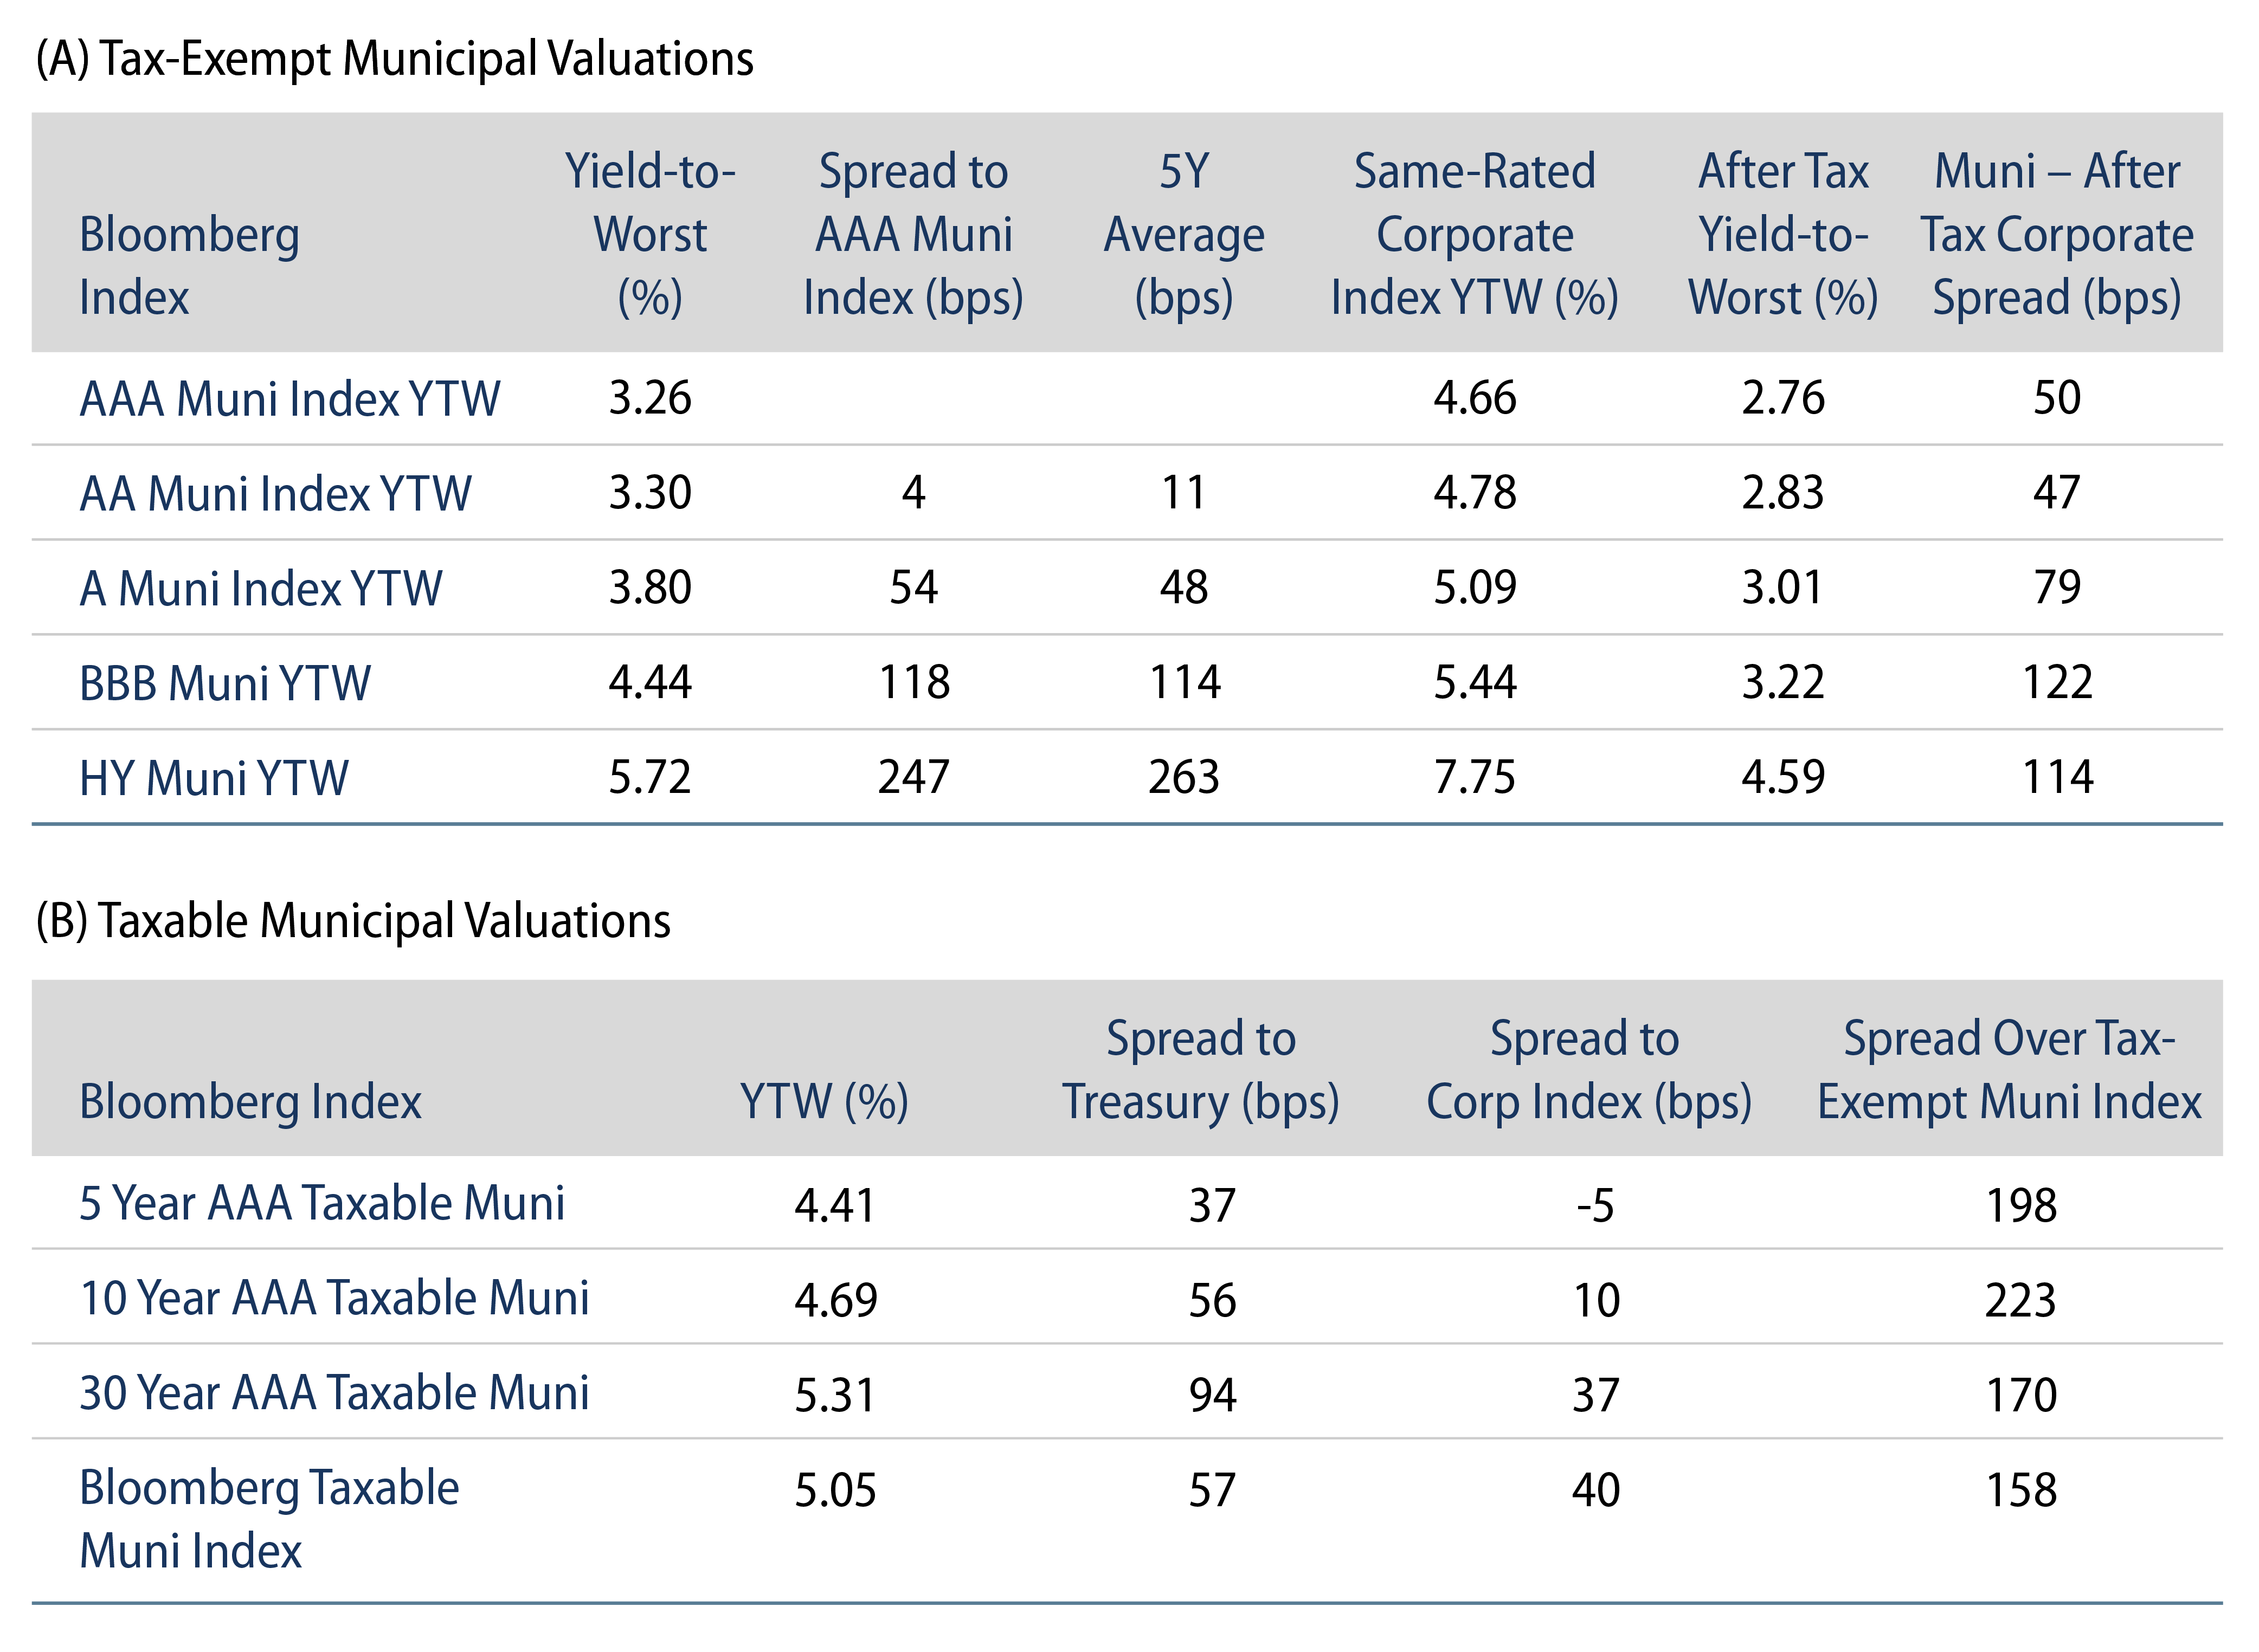
Theme #3: Munis offer attractive after-tax yield pickup versus long Treasuries and corporate credit.

Exhibit 9: Municipal vs. Taxable Fixed-Income Yields by Quality
Municipal vs. Taxable Fixed-Income Yields by Quality
Source: Western Asset, Bloomberg. As 26 Jan 24. Bloomberg BVAL AAA Muni Curve and US On-/Off-the-Run Sovereign Curve. After-tax yield considers top marginal tax rate of 40.8%. Select the image to expand the view.

© Western Asset Management Company, LLC 2024. The information contained in these materials ("the materials") is intended for the exclusive use of the designated recipient ("the recipient"). This information is proprietary and confidential and may contain commercially sensitive information, and may not be copied, reproduced or republished, in whole or in part, without the prior written consent of Western Asset Management Company ("Western Asset").
Past performance does not predict future returns. These materials should not be deemed to be a prediction or projection of future performance. These materials are intended for investment professionals including professional clients, eligible counterparties, and qualified investors only.
These materials have been produced for illustrative and informational purposes only. These materials contain Western Asset's opinions and beliefs as of the date designated on the materials; these views are subject to change and may not reflect real-time market developments and investment views.
Third party data may be used throughout the materials, and this data is believed to be accurate to the best of Western Asset's knowledge at the time of publication, but cannot be guaranteed. These materials may also contain strategy or product awards or rankings from independent third parties or industry publications which are based on unbiased quantitative and/or qualitative information determined independently by each third party or publication. In some cases, Western Asset may subscribe to these third party's standard industry services or publications. These standard subscriptions and services are available to all asset managers and do not influence rankings or awards in any way.
Investment strategies or products discussed herein may involve a high degree of risk, including the loss of some or all capital. Investments in any products or strategies described in these materials may be volatile, and investors should have the financial ability and willingness to accept such risks.
Unless otherwise noted, investment performance contained in these materials is reflective of a strategy composite. All other strategy data and information included in these materials reflects a representative portfolio which is an account in the composite that Western Asset believes most closely reflects the current portfolio management style of the strategy. Performance is not a consideration in the selection of the representative portfolio. The characteristics of the representative portfolio shown may differ from other accounts in the composite. Information regarding the representative portfolio and the other accounts in the composite are available upon request. Statements in these materials should not be considered investment advice. References, either general or specific, to securities and/or issuers in the materials are for illustrative purposes only and are not intended to be, and should not be interpreted as, recommendation to purchase or sell such securities. Employees and/or clients of Western Asset may have a position in the securities or issuers mentioned.
These materials are not intended to provide, and should not be relied on for, accounting, legal, tax, investment or other advice. The recipient should consult its own counsel, accountant, investment, tax, and any other advisers for this advice, including economic risks and merits, related to making an investment with Western Asset. The recipient is responsible for observing the applicable laws and regulations of their country of residence.
Founded in 1971, Western Asset Management Company is a global fixed-income investment manager with offices in Pasadena, New York, London, Singapore, Tokyo, Melbourne, São Paulo, Hong Kong, and Zürich. Western Asset is a wholly owned subsidiary of Franklin Resources, Inc. but operates autonomously. Western Asset is comprised of six legal entities across the globe, each with distinct regional registrations: Western Asset Management Company, LLC, a registered Investment Adviser with the Securities and Exchange Commission; Western Asset Management Company Distribuidora de Títulos e Valores Mobiliários Limitada is authorized and regulated by Comissão de Valores Mobiliários and Brazilian Central Bank; Western Asset Management Company Pty Ltd ABN 41 117 767 923 is the holder of the Australian Financial Services License 303160; Western Asset Management Company Pte. Ltd. Co. Reg. No. 200007692R is a holder of a Capital Markets Services License for fund management and regulated by the Monetary Authority of Singapore; Western Asset Management Company Ltd, a registered Financial Instruments Business Operator and regulated by the Financial Services Agency of Japan; and Western Asset Management Company Limited is authorised and regulated by the Financial Conduct Authority ("FCA") (FRN 145930). This communication is intended for distribution to Professional Clients only if deemed to be a financial promotion in the UK as defined by the FCA. This communication may also be intended for certain EEA countries where Western Asset has been granted permission to do so. For the current list of the approved EEA countries please contact Western Asset at +44 (0)20 7422 3000.