Municipals Posted Negative Returns Last Week
Municipals generally outperformed Treasuries, which moved higher across the curve amid lower than anticipated jobless claims data. Meanwhile, high-grade municipal yields moved higher in intermediate and long maturities. Weaker technicals were driven by fund outflows and higher supply conditions. The Bloomberg Municipal Index returned -0.23% during the week, the High Yield Muni Index returned -0.17% and the Taxable Muni Index returned -0.25%. As the Federal Reserve (Fed) just released its flow of funds data last Friday, we highlight changes in muni demand and the market liquidity landscape.
Weak Technical Conditions Were Driven by Elevated Supply and Fund Outflows
Fund Flows: During the week ending September 6, weekly reporting municipal mutual funds recorded $798 million of net outflows, according to Lipper. Long-term funds recorded $324 million of outflows, high-yield funds recorded $174 million of outflows and intermediate funds recorded $96 million of outflows. This week’s outflows bring year-to-date (YTD) net outflows to $9.9 billion.
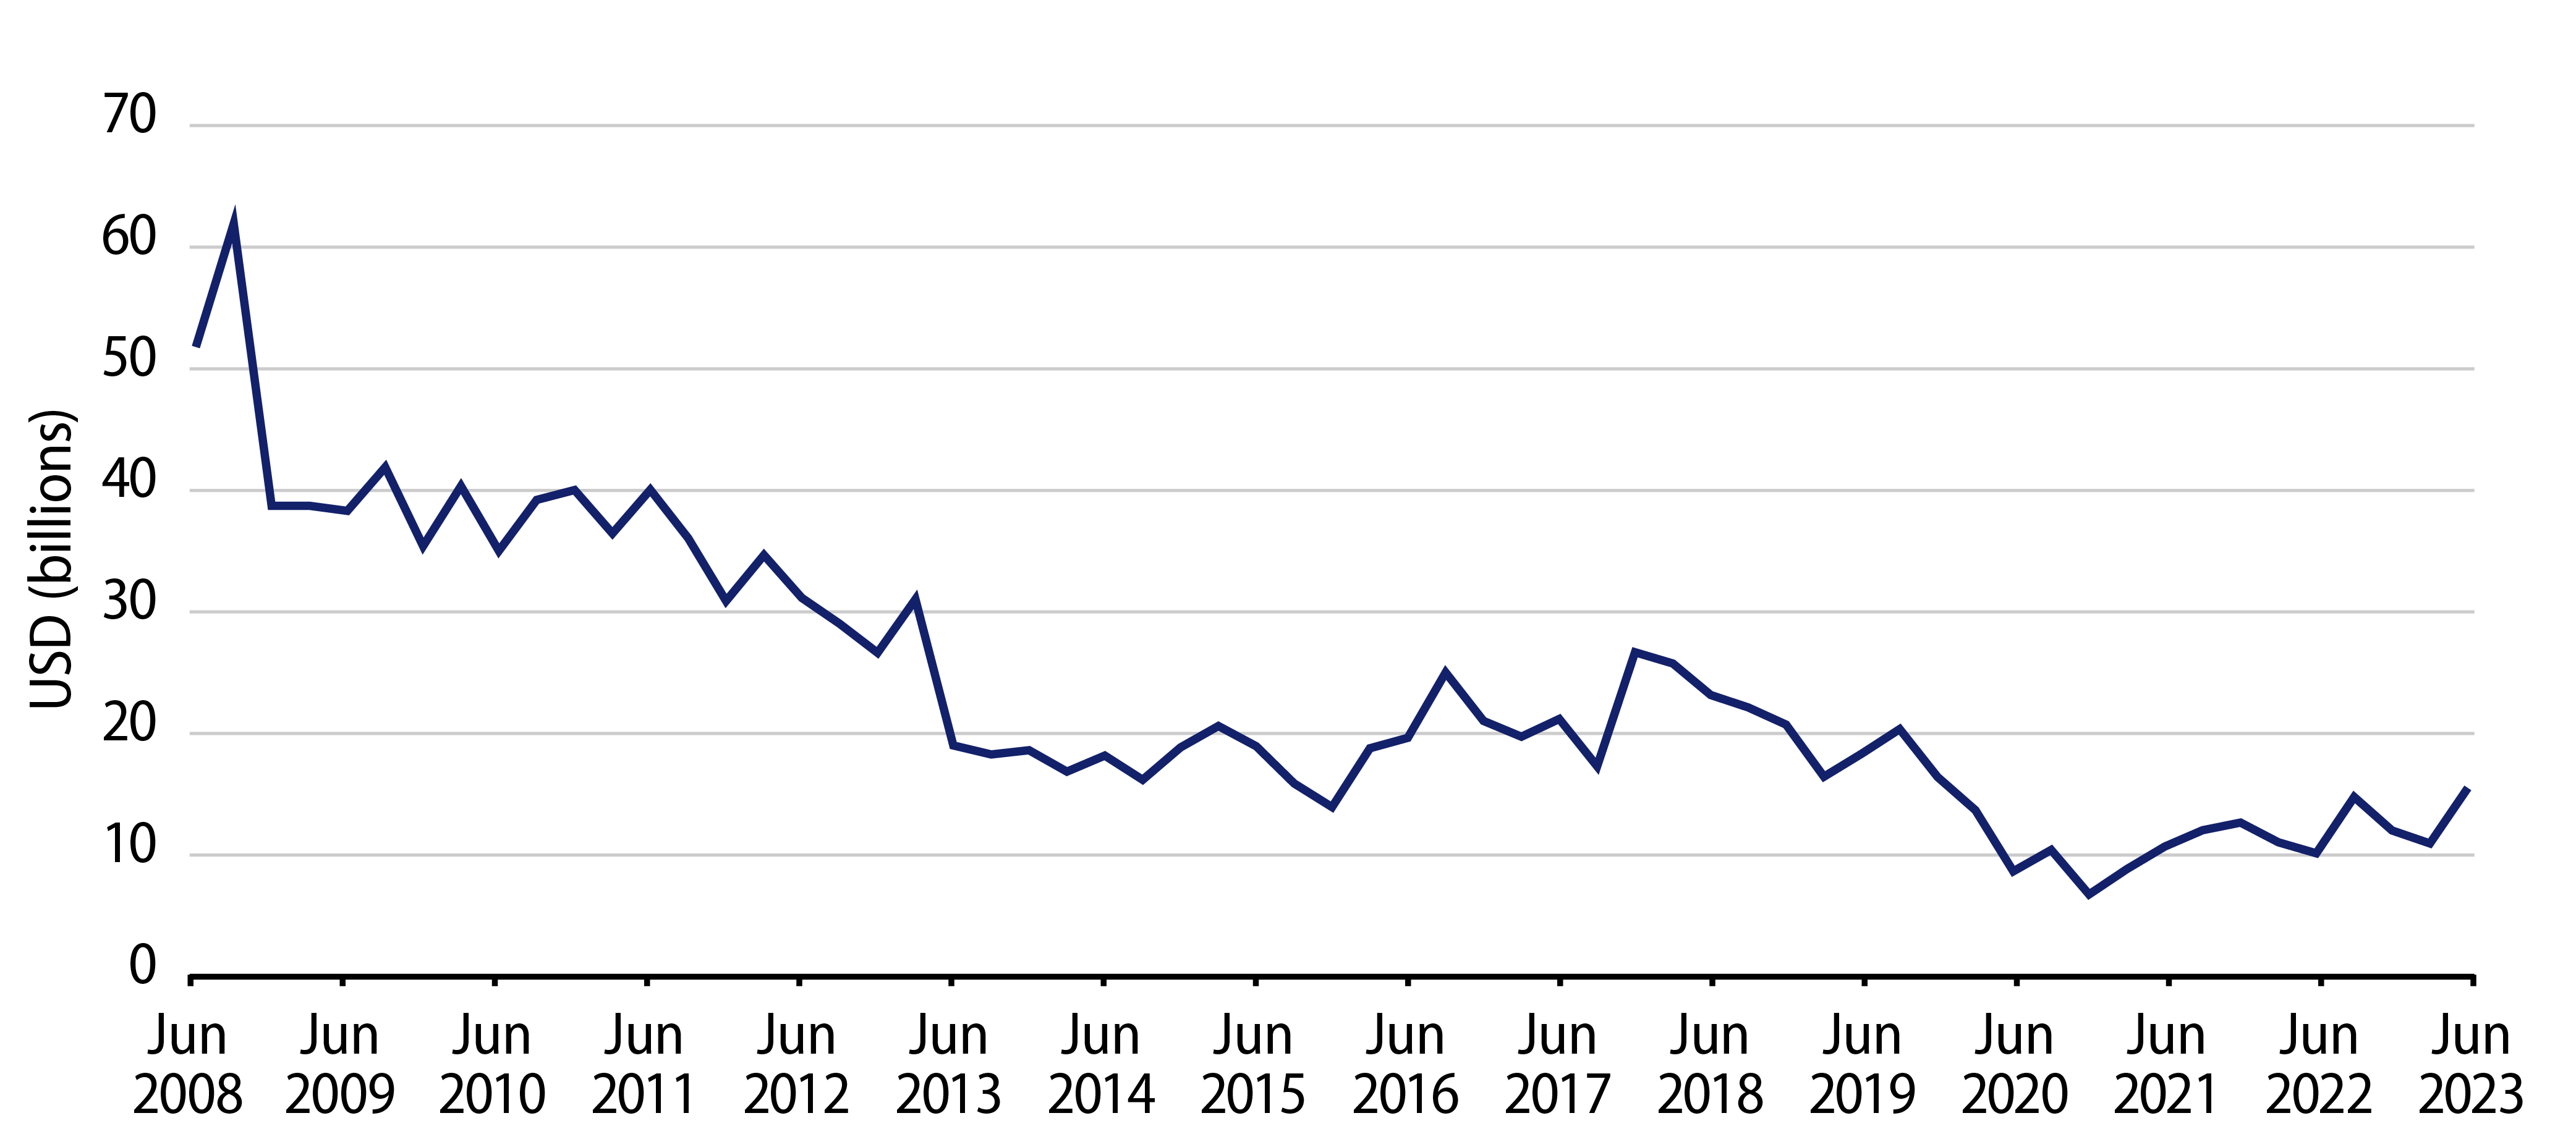
Supply: The muni market recorded $9 billion of new-issue volume last week. YTD issuance of $247 billion is down 9% year-over-year (YoY), with tax-exempt issuance down 2% YoY and taxable issuance down 46% YoY. This week’s calendar is expected to decline to $7 billion. Large transactions include $631 million Central Plains Energy and $600 million Ohio State University transactions.
This Week in Munis: Muni Holders Diverge
Since 2010, the overall stock of municipal debt has remained relatively unchanged at $4.0 trillion, despite corporate credit and Treasury markets increasing by 65% and 170%, respectively, over the same time period. While the stock of municipal debt has remained steady, the composition of these holders has evolved over the past decade and even this year, according to Fed data released Friday.

Primary holders of the $4 trillion municipal debt stock are comprised of individuals subject to tax rates benefiting from tax-exempt income, represented by household individual holdings (43% of total municipal debt) and mutual funds (27%), followed by bank and insurance institutions (25%). Collectively these entities comprise 95% of municipal holders.
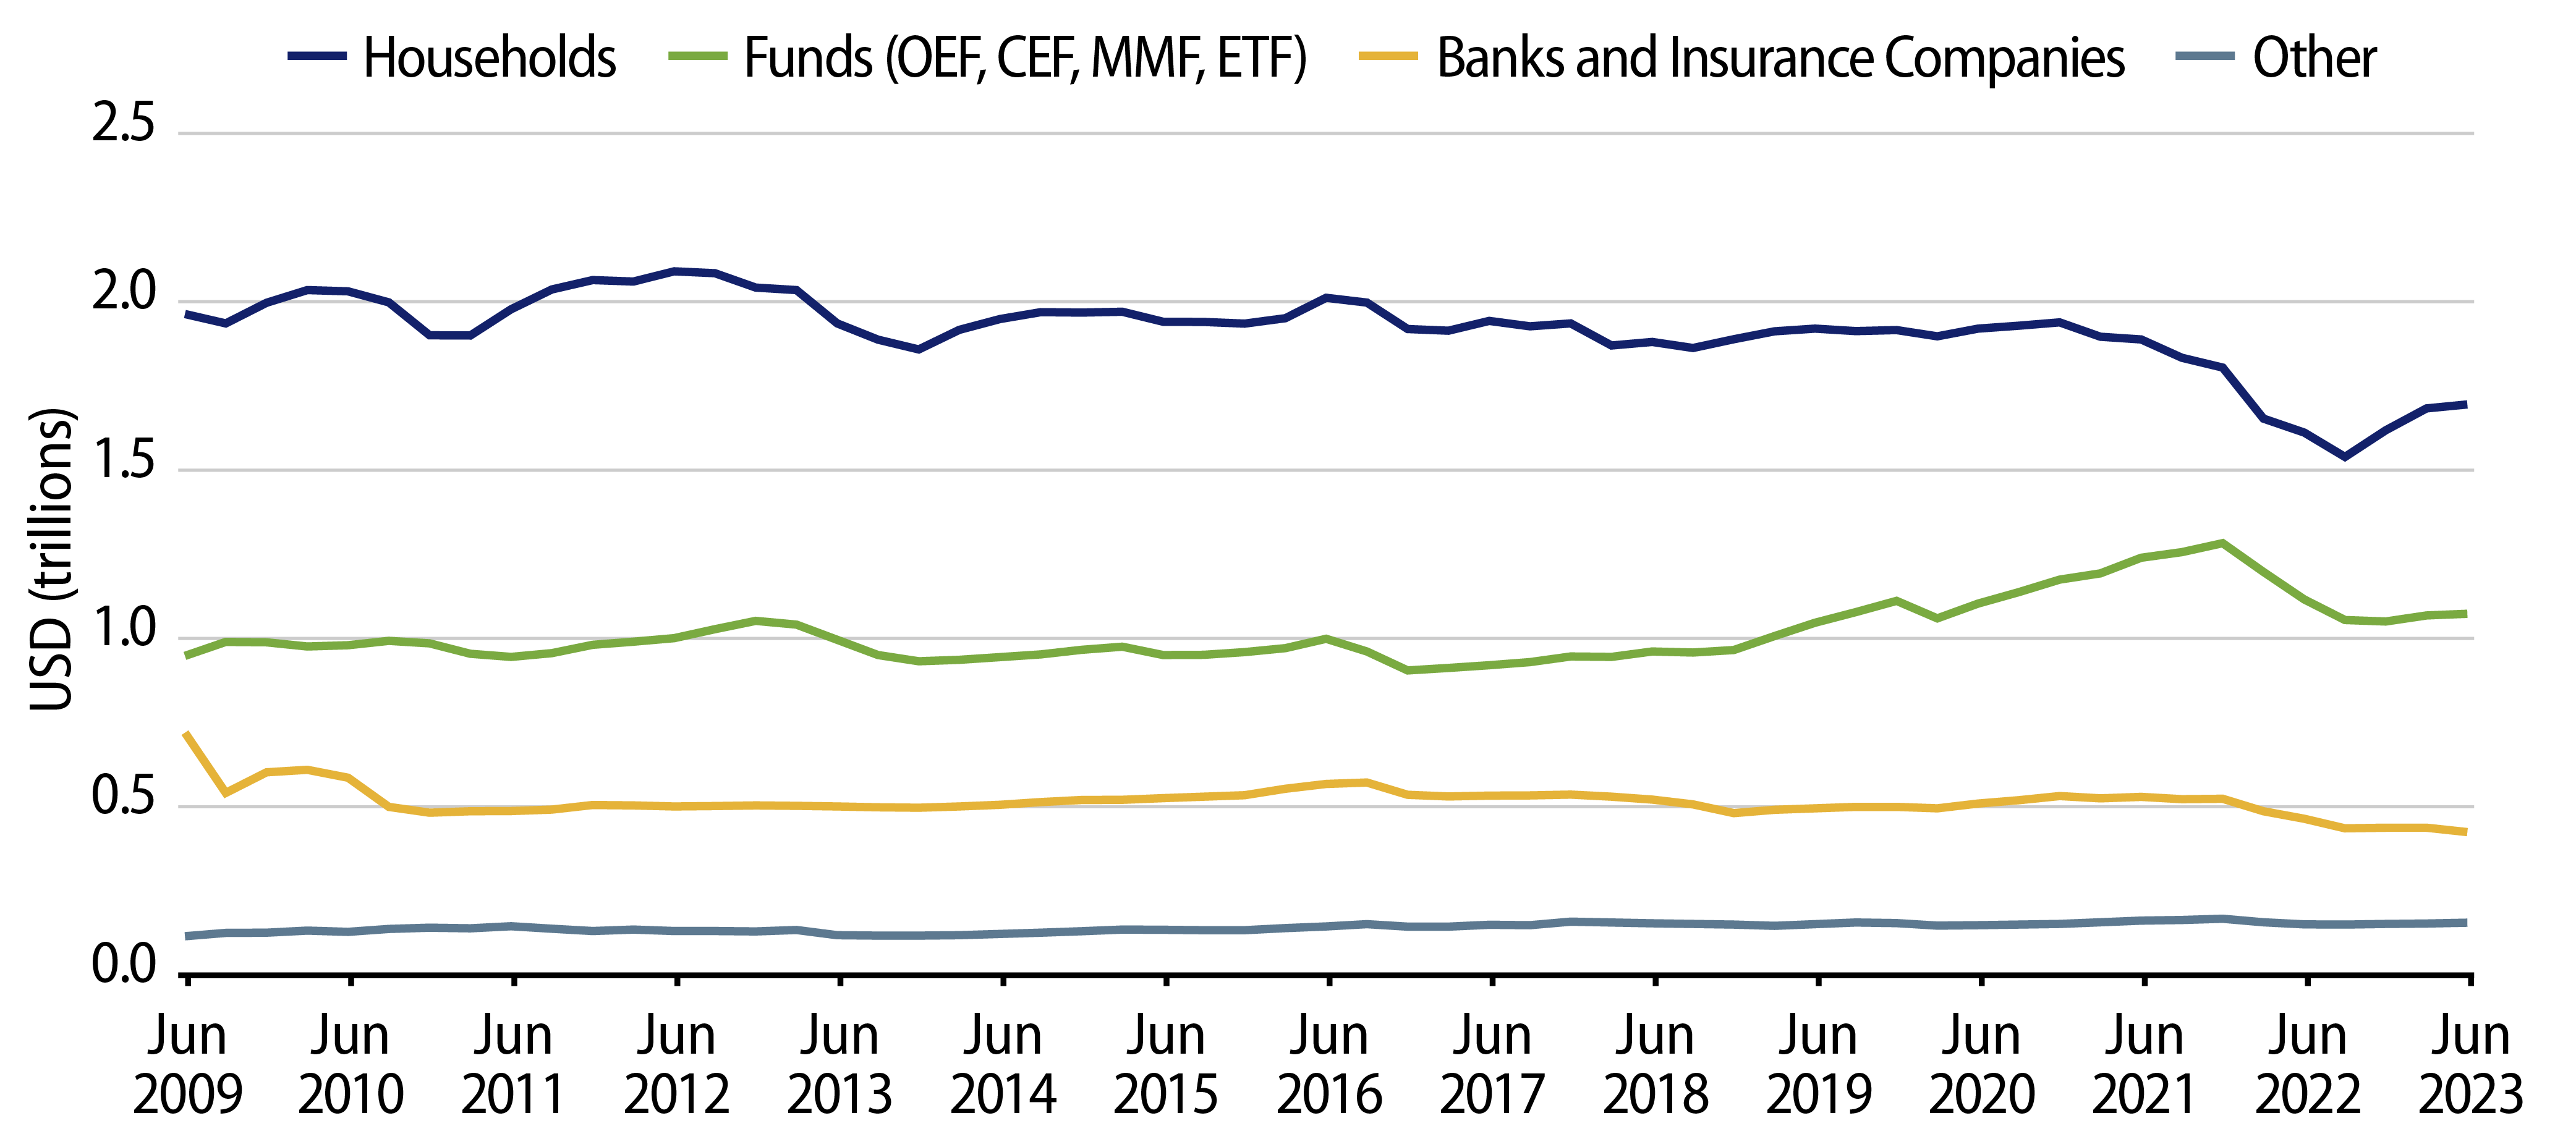
Individual Demand: Households historically comprised the majority of the municipal market prior to the global financial crisis (GFC). As the market subsequently shifted to a credit market, individual household holdings declined nearly 20% while fund assets increased nearly 11% as greater demand emerged for managed vehicles. YTD through the second quarter, households have observed a 5% uptick in assets, potentially driven by increased municipal separately managed account (SMA) demand as more investors have been seeking customized solutions.
Institutional Demand: Banks and insurance companies typically hold municipals against deposits and to match assets versus liabilities, but also benefit from the municipal tax exemption considering their federal corporate tax rate. Muni demand from these institutions has steadily declined since the reduction of the corporate tax rate in 2018, but has declined more sharply this year following the regional banking crisis and the unwinding of muni portfolios. This year, total bank and insurance municipal assets declined by $45 billion (-4.5%).
The shift of demand from institutional to retail buyers contributes to a less diversified buyer base and an evolving liquidity landscape in the muni market. With fewer institutional liquidity providers, in addition to less broker/dealer support for the market, we expect greater market sensitivity to retail demand and fund flows going forward. The potential increased volatility that could arise from a more concentrated buyer base should provide active managers an opportunity to navigate challenged liquidity conditions and provide value opportunities in the fragmented muni market.