skip navigation
Blog

Stay up to date on timely topics and market events. Subscribe to our Blog now.

MARKETS
25 July 2023

Weekly Municipal Monitor—MTA Raises Fares, Highlights Budget Surplus

By Dave Fare, CFA, Michael Linko

Stay up to date on timely topics and market events. Subscribe to our Blog now.

Municipals Posted Positive Returns Last Week

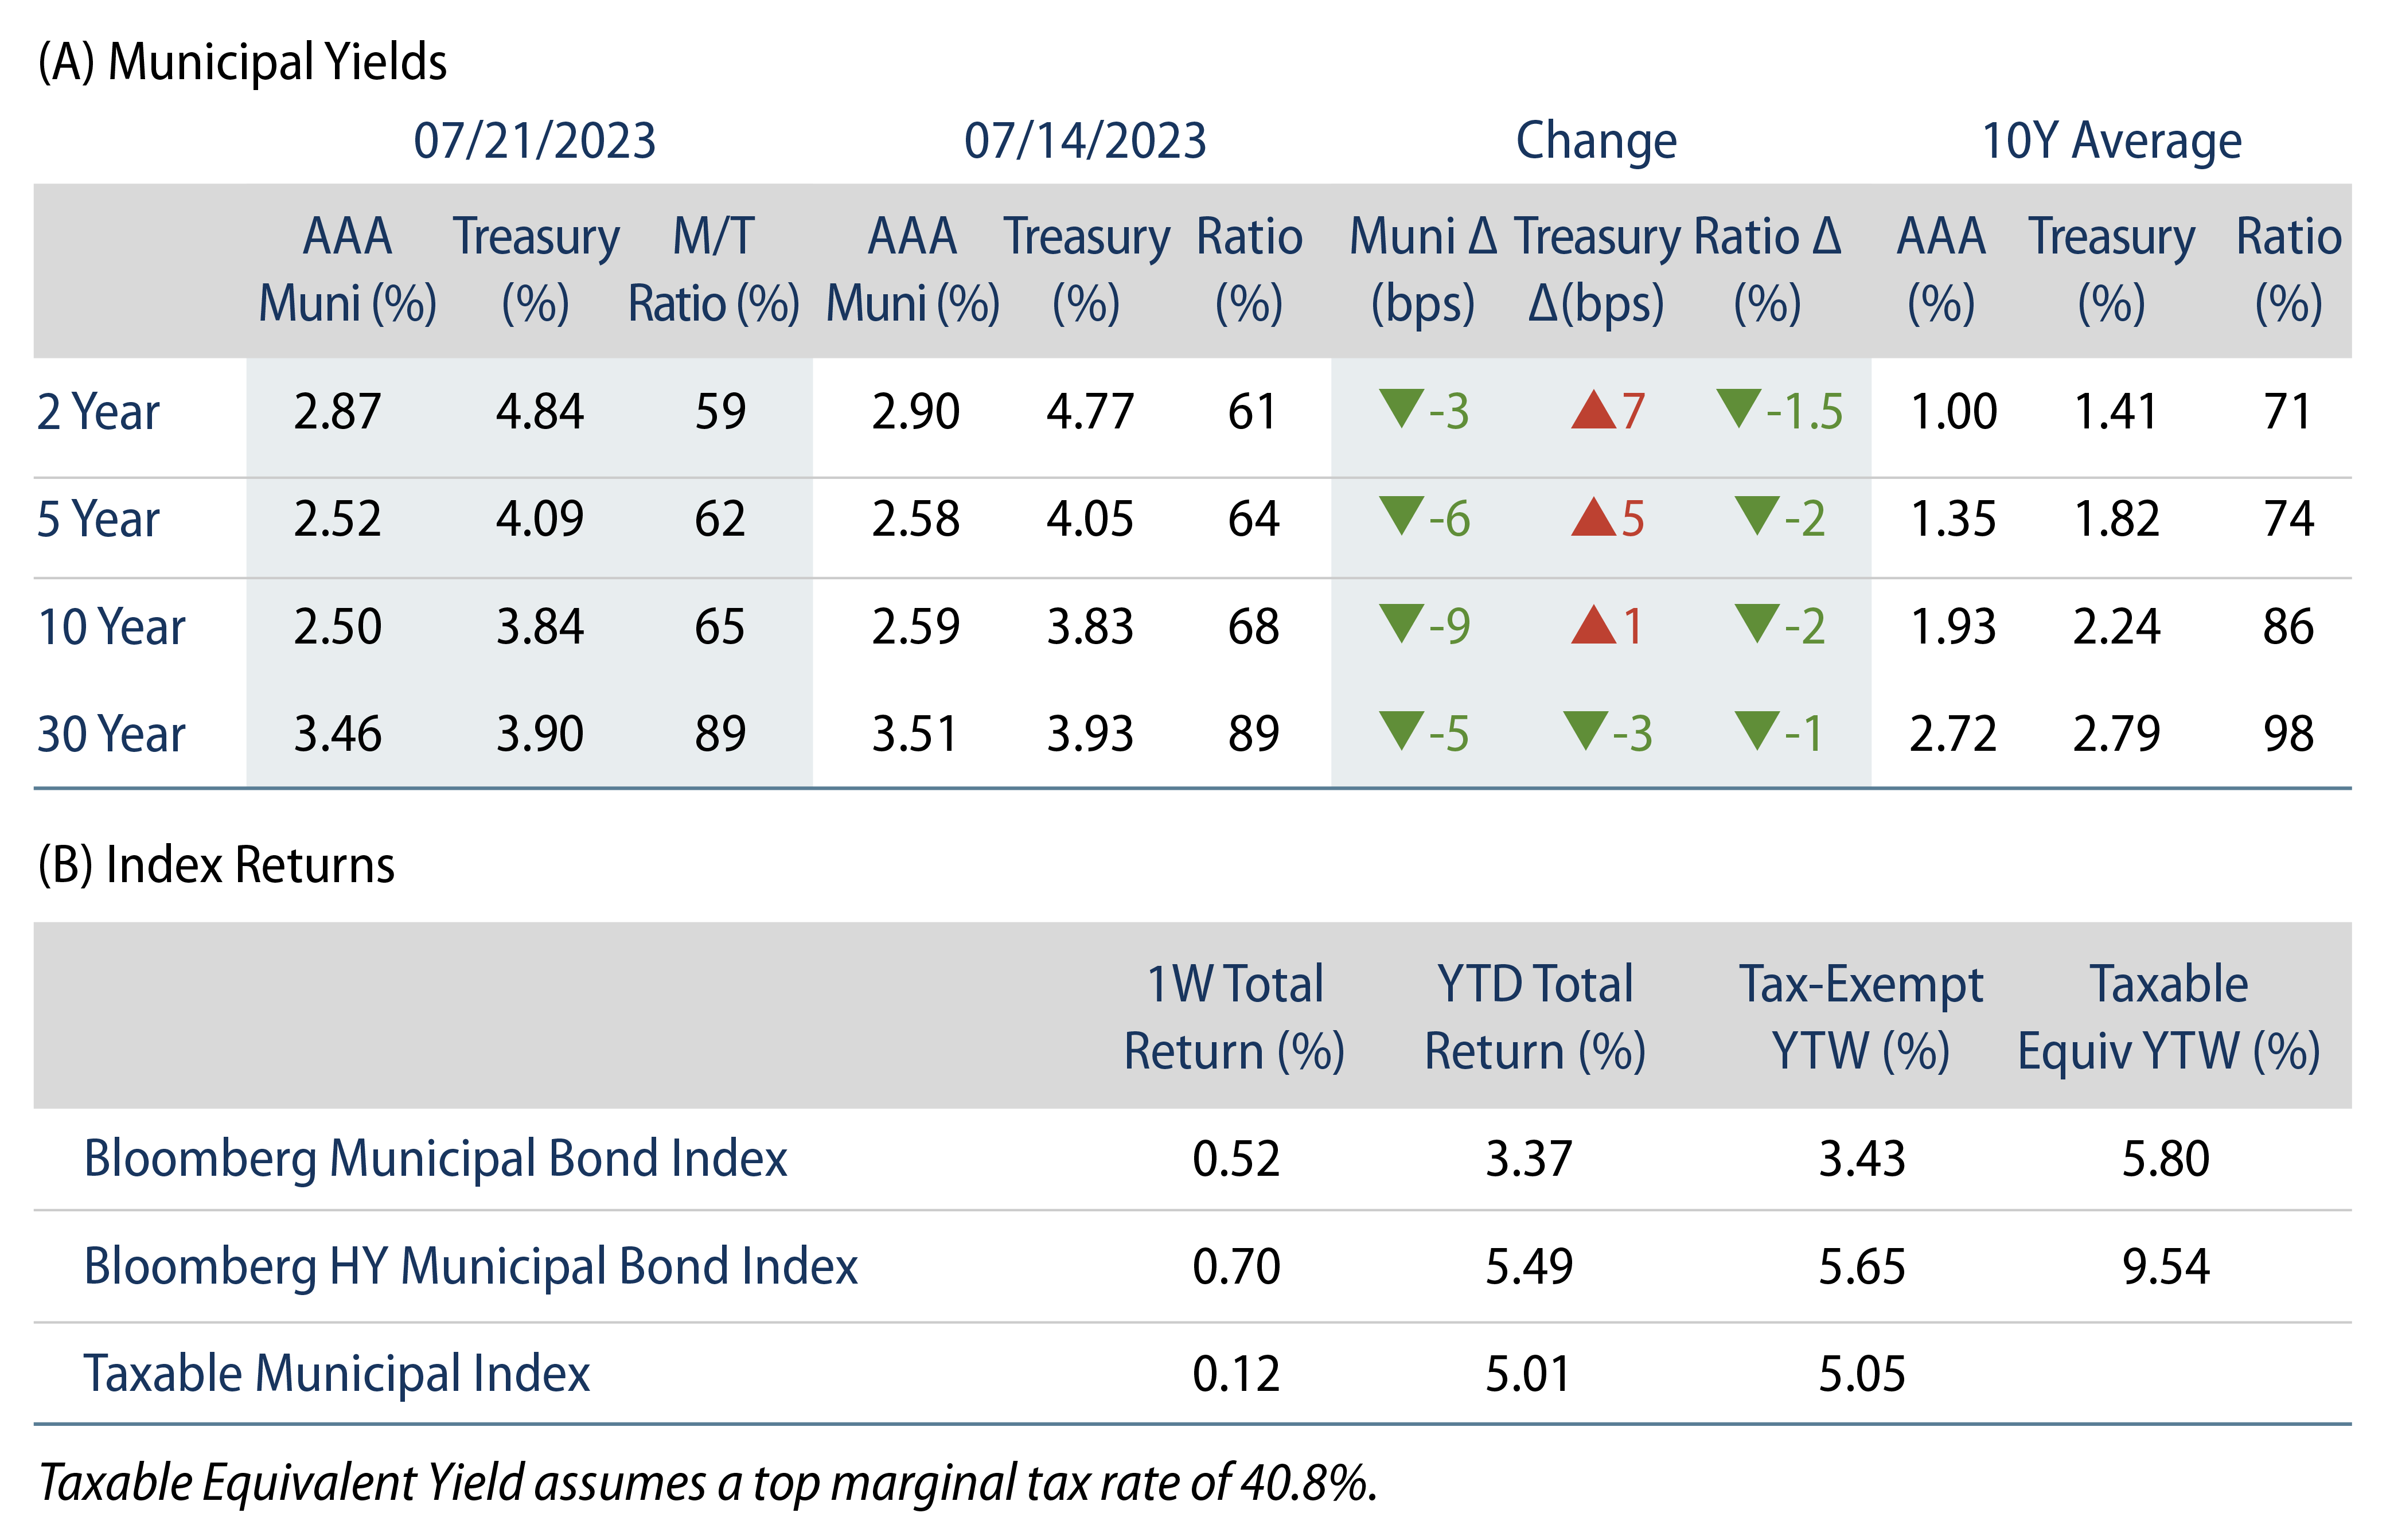
Municipals posted positive returns last week as high-grade municipal yields moved lower across the curve. Munis outperformed Treasuries, which moved higher in short and intermediate maturities. Technicals improved as municipal mutual funds recorded inflows. The Bloomberg Municipal Index returned 0.52% during the week, the High Yield Muni Index returned 0.70% and the Taxable Muni Index returned 0.12%. This week we highlight the New York Metropolitan Transportation Authority’s (MTA) recently released budget and fare increases.

Muni Technicals Improve with Fund Inflows

Fund Flows: During the week ending July 19, weekly reporting municipal mutual funds recorded $1.0 billion of net inflows, according to Lipper. Long-term funds recorded $1.0 billion of inflows, high-yield funds recorded $408 million of inflows and intermediate funds recorded $122 million of inflows. This week’s inflows bring year-to-date (YTD) net outflows to $7.3 billion.

Supply: The muni market recorded $11 billion of new-issue volume last week, up 29% from the prior week. YTD issuance of $194 billion is down 13% year-over year (YoY), with tax-exempt issuance down 7% YoY and taxable issuance down 44% YoY. This week’s calendar is expected to decline to $7 billion. Large transactions include $692 million state of Washington General Obligation and $621 million Black Belt Energy transactions.

This Week in Munis: MTA Raises Fares, Highlights Budget Surplus

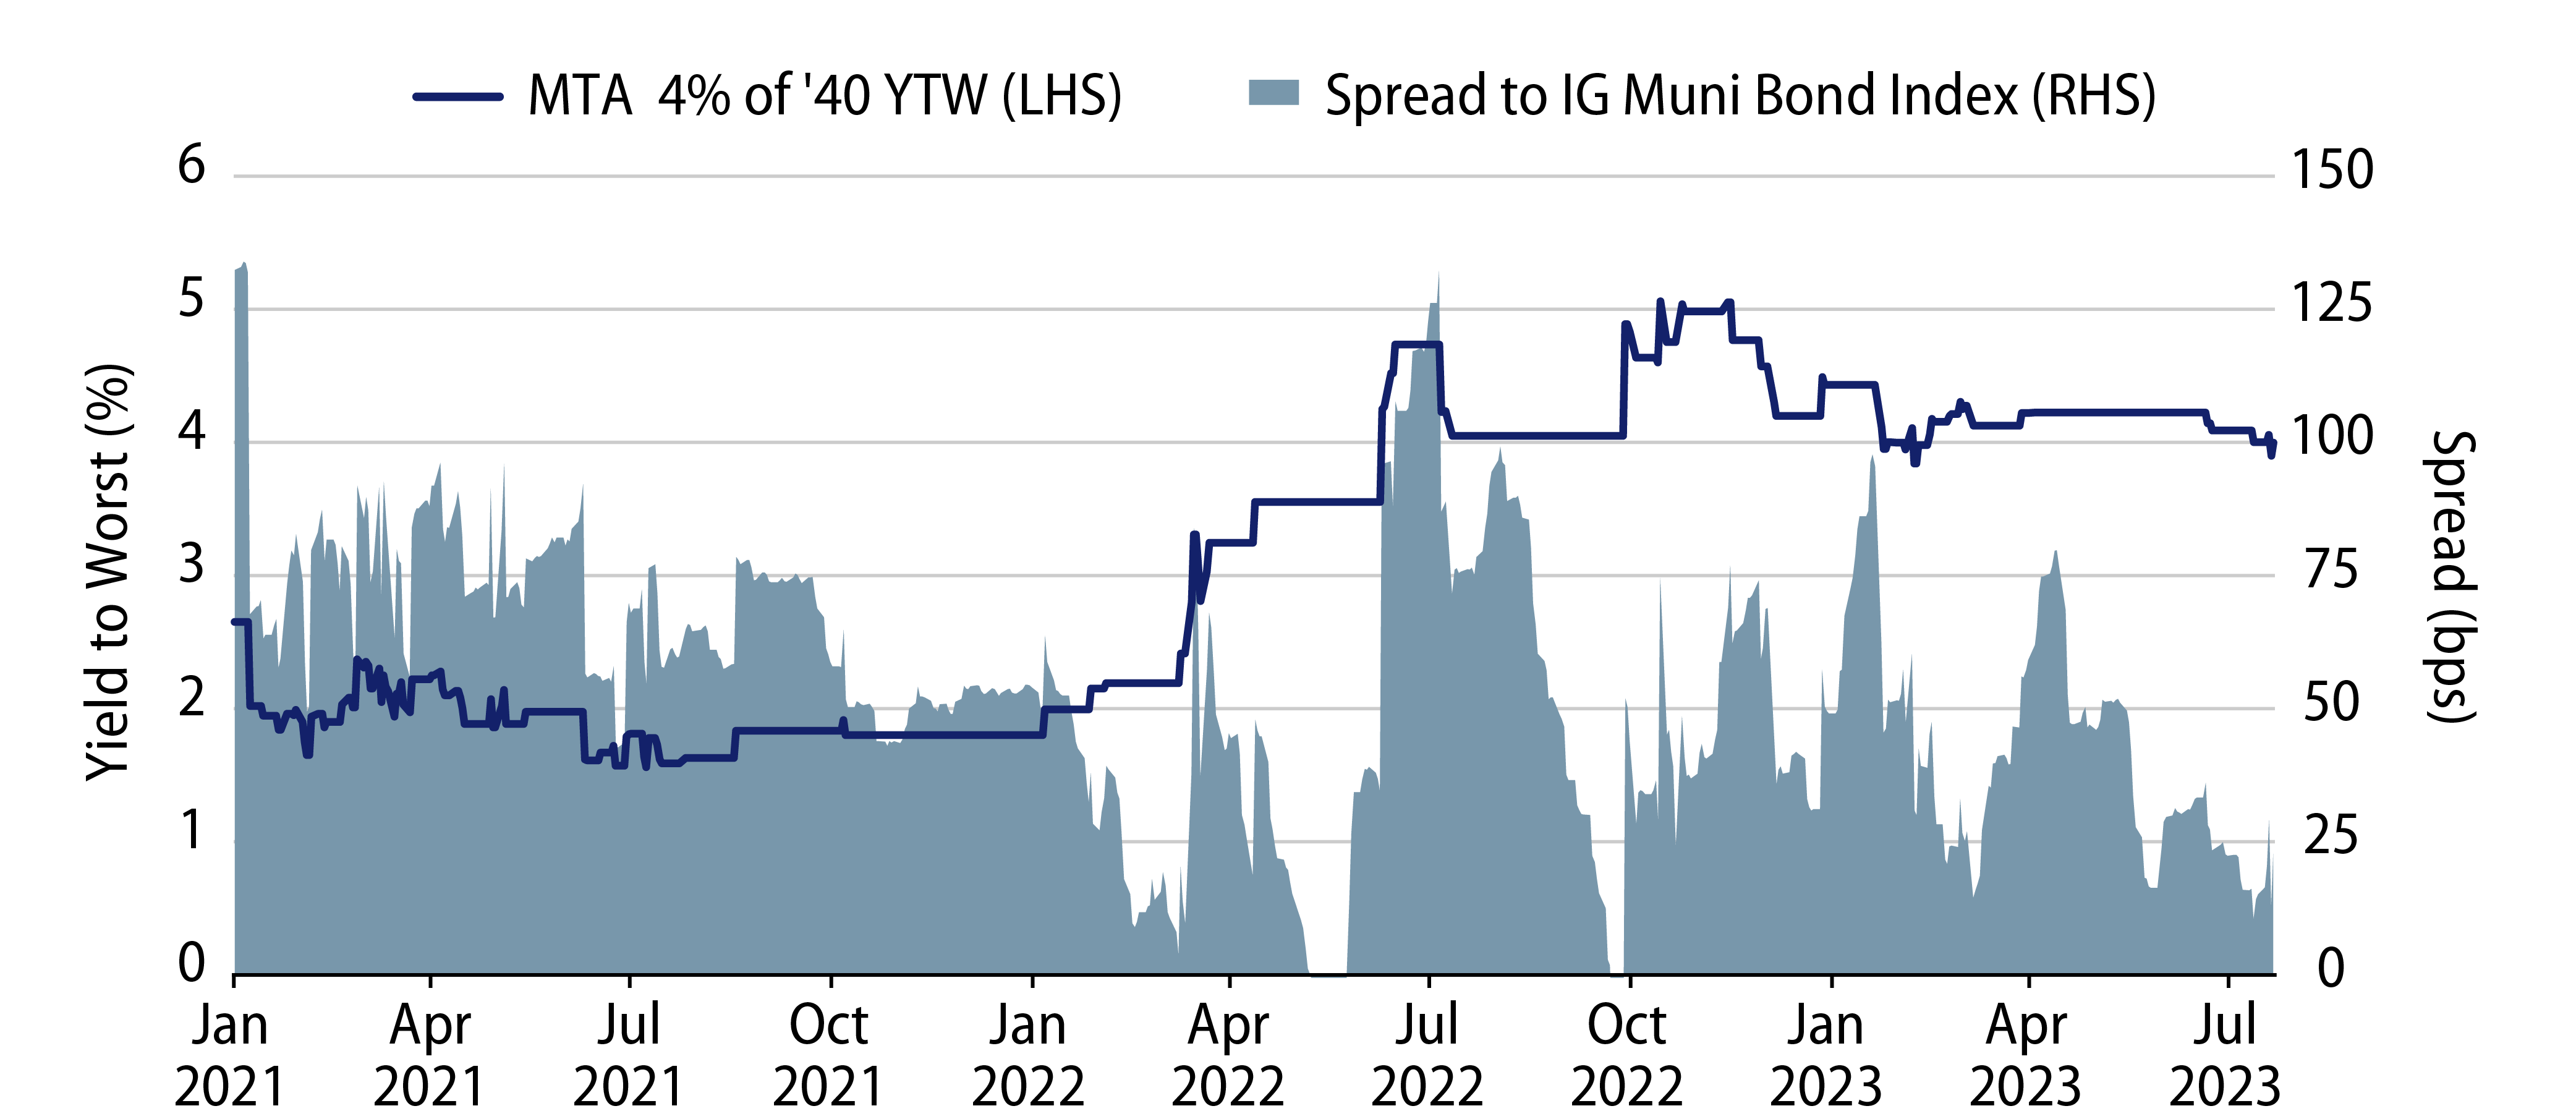
The New York MTA has been in focus throughout the pandemic and the subsequent recovery, considering the Authority’s elevated debt loads and presence at the center of the conversation around ridership concerns associated with work-from-home and return-to-office trends. Last week, the MTA released five-year budget projections, reflecting the impact of recent additional revenue streams. Following operating deficits of approximately $2 billion to $3 billion since 2020, offset only by pandemic-related federal aid, the MTA is projecting balanced budgets for the next five years.

The primary drivers of the prospective balanced budgets include new funding primarily from a $1.1 billion hike in payroll taxes on major companies based in NYC and an increased contribution of $165 million from the city that will pay for a greater share of the para-transit costs. In addition, the MTA announced it will raise rates across its subway, bus and outer-city train lines, which will raise $300 million annually. Transit fares will increase 3% to 5% and tolls will increase 6% to 7%.

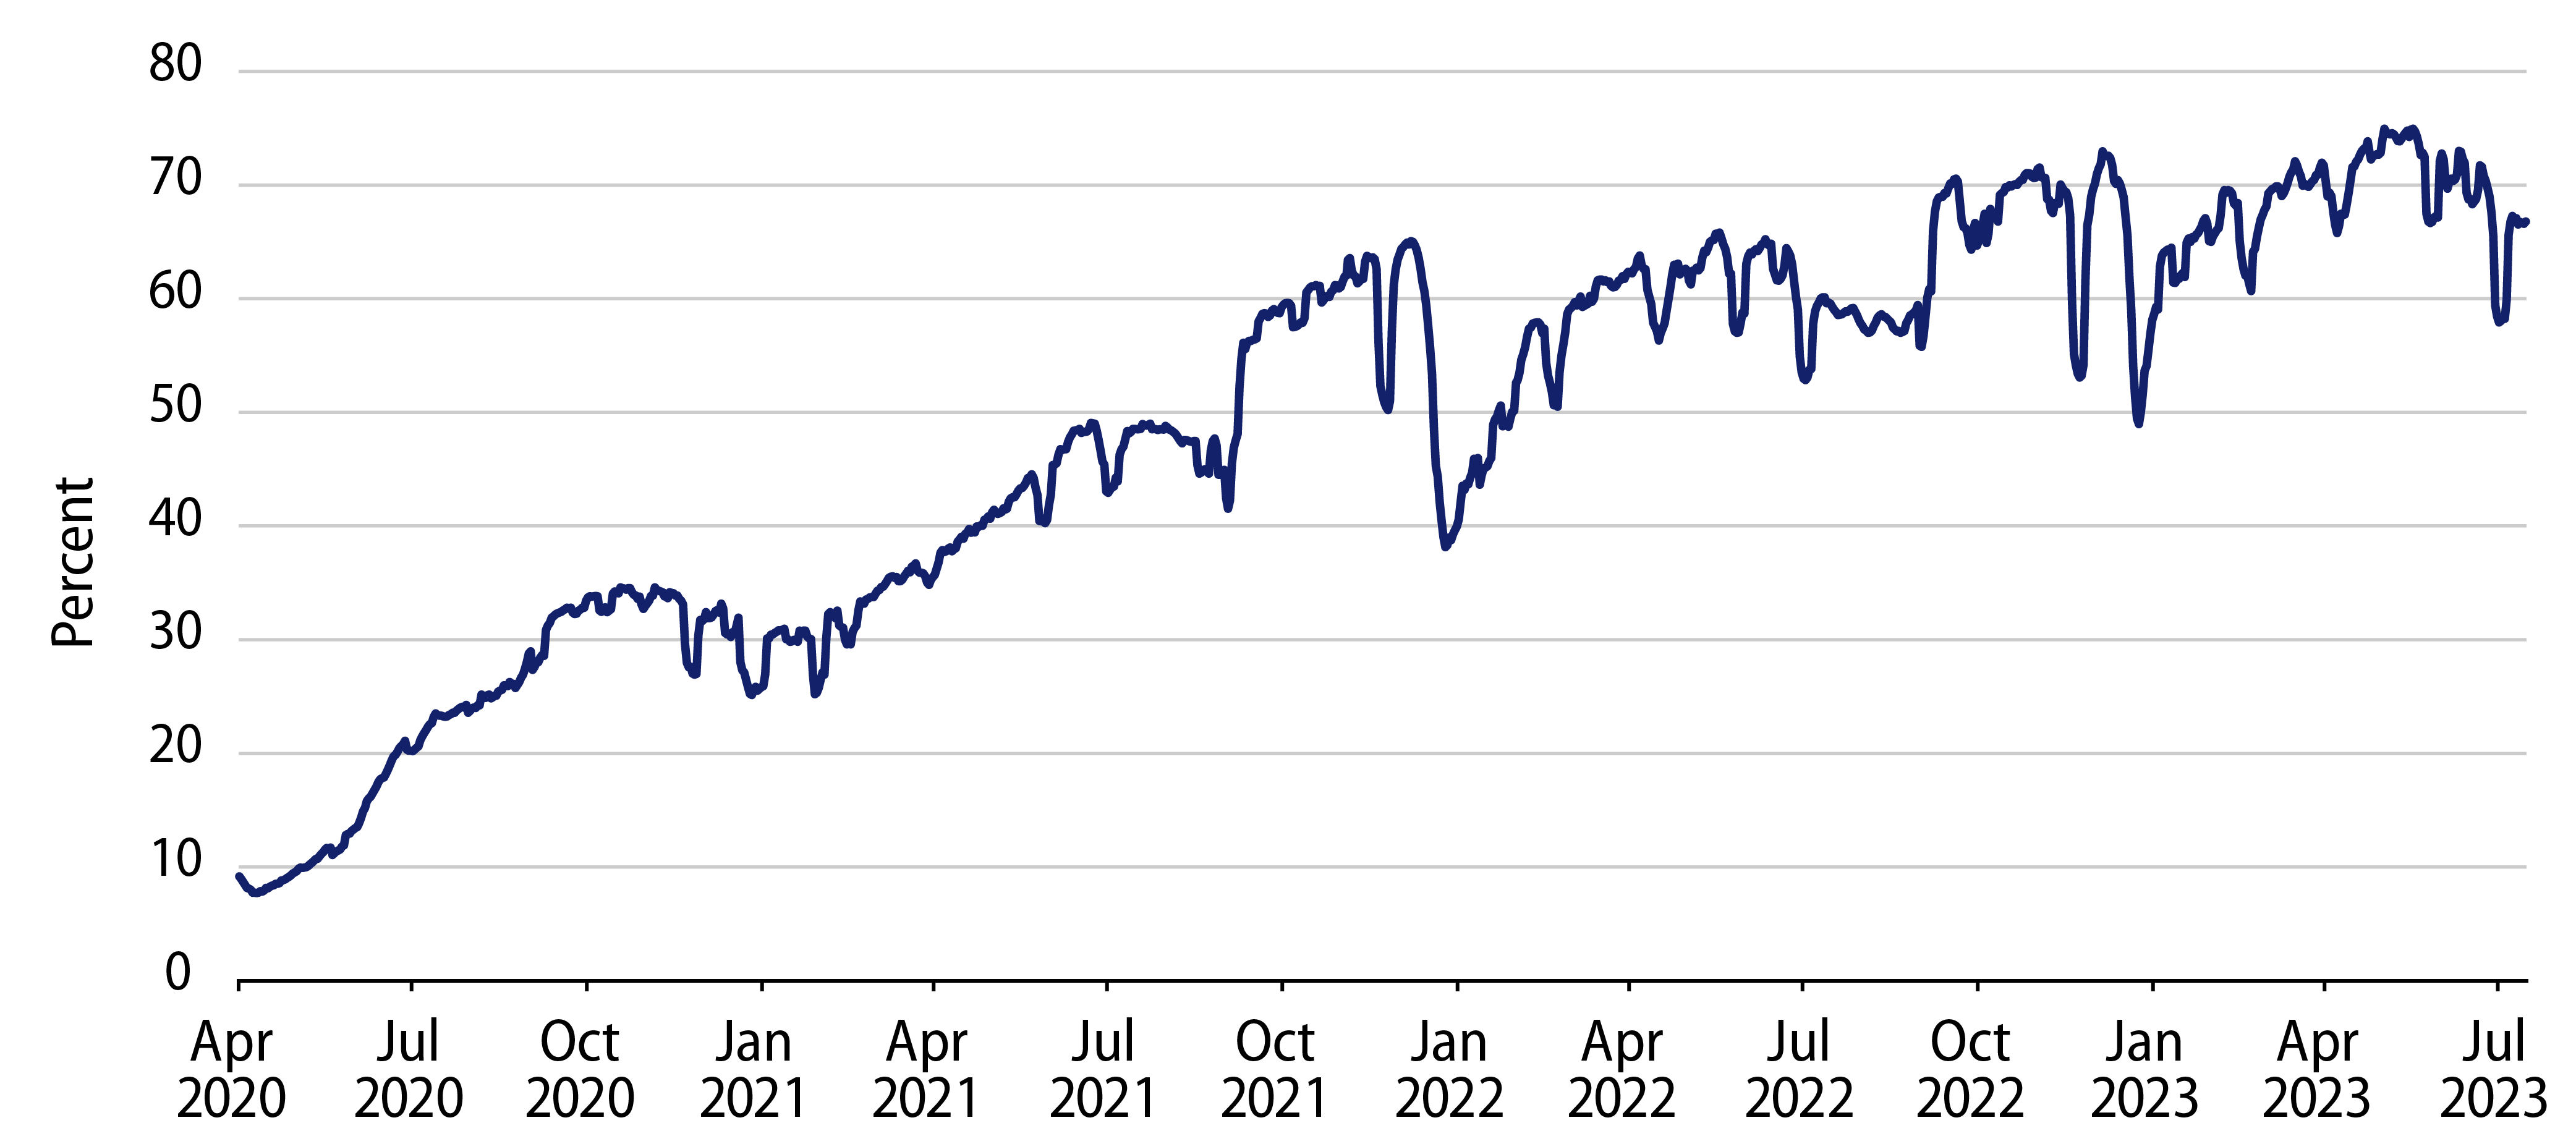
Western Asset views these near-term revenue sources as a credit positive for the MTA and necessary measures to achieve structural balance. However, the Authority remains challenged by ridership levels that remain below pre-pandemic highs (70% of pre-pandemic levels), a high cost structure, high debt load (including an outstanding $3 billion loan from the Federal Reserve Municipal Liquidity Facility), and relatively large capital plan. The Citizen’s Budget Council projects that the MTA will return to deficits in 2029 as federal funding is reduced.

Exhibit 1: MTA 7-Day Trailing Subway Ridership as % of March 2020 Peak
Explore MTA 7-Day Trailing Subway Ridership as % of March 2020 Peak
Source: Metropolitan Transportation Authority (MTA), Bloomberg, Western Asset. As of 20 Jul 23. Select the image to expand the view.

Western Asset anticipates the MTA has the ability to continue to manage through its credit challenges, but considering cost pressures and potential reduced ridership, the Authority will likely need to achieve additional support from state, local and federal governments. While we expect these additional resources would likely be attained, we anticipate the potential for additional credit volatility associated with political headwinds throughout these efforts. While rating agencies appear to be more optimistic with the trajectory of the MTA’s credit profile, we believe current market pricing adequately compensates investors for some of the downside risks.

Exhibit 2: MTA 4.0% of '40 Yield to Worst vs. Spread to Bloomberg A Muni Index
Explore MTA 4.0% of ’40 Yield to Worst vs. Spread to Bloomberg A Muni Index
Source: Bloomberg, Western Asset. As of 21 Jul 23. Select the image to expand the view.
Exhibit 3: Municipal Bond Yields and Index Returns
Explore Municipal Bond Yields and Index Returns
Source: Bloomberg. As of 21 Jul 23. Select the image to expand the view.
Exhibit 4: Tax-Exempt and Taxable Muni Valuations
Explore Tax-Exempt and Taxable Muni Valuations
Source: Bloomberg. As of 21 Jul 23. Select the image to expand the view.
© Western Asset Management Company, LLC 2024. The information contained in these materials ("the materials") is intended for the exclusive use of the designated recipient ("the recipient"). This information is proprietary and confidential and may contain commercially sensitive information, and may not be copied, reproduced or republished, in whole or in part, without the prior written consent of Western Asset Management Company ("Western Asset").
Past performance does not predict future returns. These materials should not be deemed to be a prediction or projection of future performance. These materials are intended for investment professionals including professional clients, eligible counterparties, and qualified investors only.
These materials have been produced for illustrative and informational purposes only. These materials contain Western Asset's opinions and beliefs as of the date designated on the materials; these views are subject to change and may not reflect real-time market developments and investment views.
Third party data may be used throughout the materials, and this data is believed to be accurate to the best of Western Asset's knowledge at the time of publication, but cannot be guaranteed. These materials may also contain strategy or product awards or rankings from independent third parties or industry publications which are based on unbiased quantitative and/or qualitative information determined independently by each third party or publication. In some cases, Western Asset may subscribe to these third party's standard industry services or publications. These standard subscriptions and services are available to all asset managers and do not influence rankings or awards in any way.
Investment strategies or products discussed herein may involve a high degree of risk, including the loss of some or all capital. Investments in any products or strategies described in these materials may be volatile, and investors should have the financial ability and willingness to accept such risks.
Unless otherwise noted, investment performance contained in these materials is reflective of a strategy composite. All other strategy data and information included in these materials reflects a representative portfolio which is an account in the composite that Western Asset believes most closely reflects the current portfolio management style of the strategy. Performance is not a consideration in the selection of the representative portfolio. The characteristics of the representative portfolio shown may differ from other accounts in the composite. Information regarding the representative portfolio and the other accounts in the composite are available upon request. Statements in these materials should not be considered investment advice. References, either general or specific, to securities and/or issuers in the materials are for illustrative purposes only and are not intended to be, and should not be interpreted as, recommendation to purchase or sell such securities. Employees and/or clients of Western Asset may have a position in the securities or issuers mentioned.
These materials are not intended to provide, and should not be relied on for, accounting, legal, tax, investment or other advice. The recipient should consult its own counsel, accountant, investment, tax, and any other advisers for this advice, including economic risks and merits, related to making an investment with Western Asset. The recipient is responsible for observing the applicable laws and regulations of their country of residence.
Founded in 1971, Western Asset Management Company is a global fixed-income investment manager with offices in Pasadena, New York, London, Singapore, Tokyo, Melbourne, São Paulo, Hong Kong, and Zürich. Western Asset is a wholly owned subsidiary of Franklin Resources, Inc. but operates autonomously. Western Asset is comprised of six legal entities across the globe, each with distinct regional registrations: Western Asset Management Company, LLC, a registered Investment Adviser with the Securities and Exchange Commission; Western Asset Management Company Distribuidora de Títulos e Valores Mobiliários Limitada is authorized and regulated by Comissão de Valores Mobiliários and Brazilian Central Bank; Western Asset Management Company Pty Ltd ABN 41 117 767 923 is the holder of the Australian Financial Services License 303160; Western Asset Management Company Pte. Ltd. Co. Reg. No. 200007692R is a holder of a Capital Markets Services License for fund management and regulated by the Monetary Authority of Singapore; Western Asset Management Company Ltd, a registered Financial Instruments Business Operator and regulated by the Financial Services Agency of Japan; and Western Asset Management Company Limited is authorised and regulated by the Financial Conduct Authority ("FCA") (FRN 145930). This communication is intended for distribution to Professional Clients only if deemed to be a financial promotion in the UK as defined by the FCA. This communication may also be intended for certain EEA countries where Western Asset has been granted permission to do so. For the current list of the approved EEA countries please contact Western Asset at +44 (0)20 7422 3000.