skip navigation
Blog

Stay up to date on timely topics and market events. Subscribe to our Blog now.

MARKETS
09 July 2024

Weekly Municipal Monitor—Mid-Year Update

By Sam Weitzman

Stay up to date on timely topics and market events. Subscribe to our Blog now.

Investment-Grade Munis Posted Positive Returns Last Week

Investment-grade munis posted positive returns during the week as the high-grade muni yield curve steepened modestly, with yields moving lower in shorter maturities. Munis underperformed Treasuries which rallied on weak service data and downward payroll revisions. Meanwhile, technicals improved during the holiday-shortened week. The Bloomberg Municipal Index returned 0.06% during the week, the High Yield Muni Index returned -0.11% and the Taxable Muni Index returned 0.59%. This week we provide a mid-year market update for muni investors.

Technicals Strengthened Amid Low Holiday Supply, Elevated Mid-Year Coupons and Principal Redemptions

Fund Flows (up $343 million): During the week ending July 3, weekly reporting municipal mutual funds recorded $343 million of net inflows, according to Lipper. Long-term funds recorded $356 million of inflows, high-yield funds recorded $215 million of inflows and intermediate funds recorded $125 million of inflows. This week’s inflows led estimated year-to-date (YTD) net inflows higher to $12 billion. In addition to inflows, the market benefited from elevated mid-year coupon and principal payments.

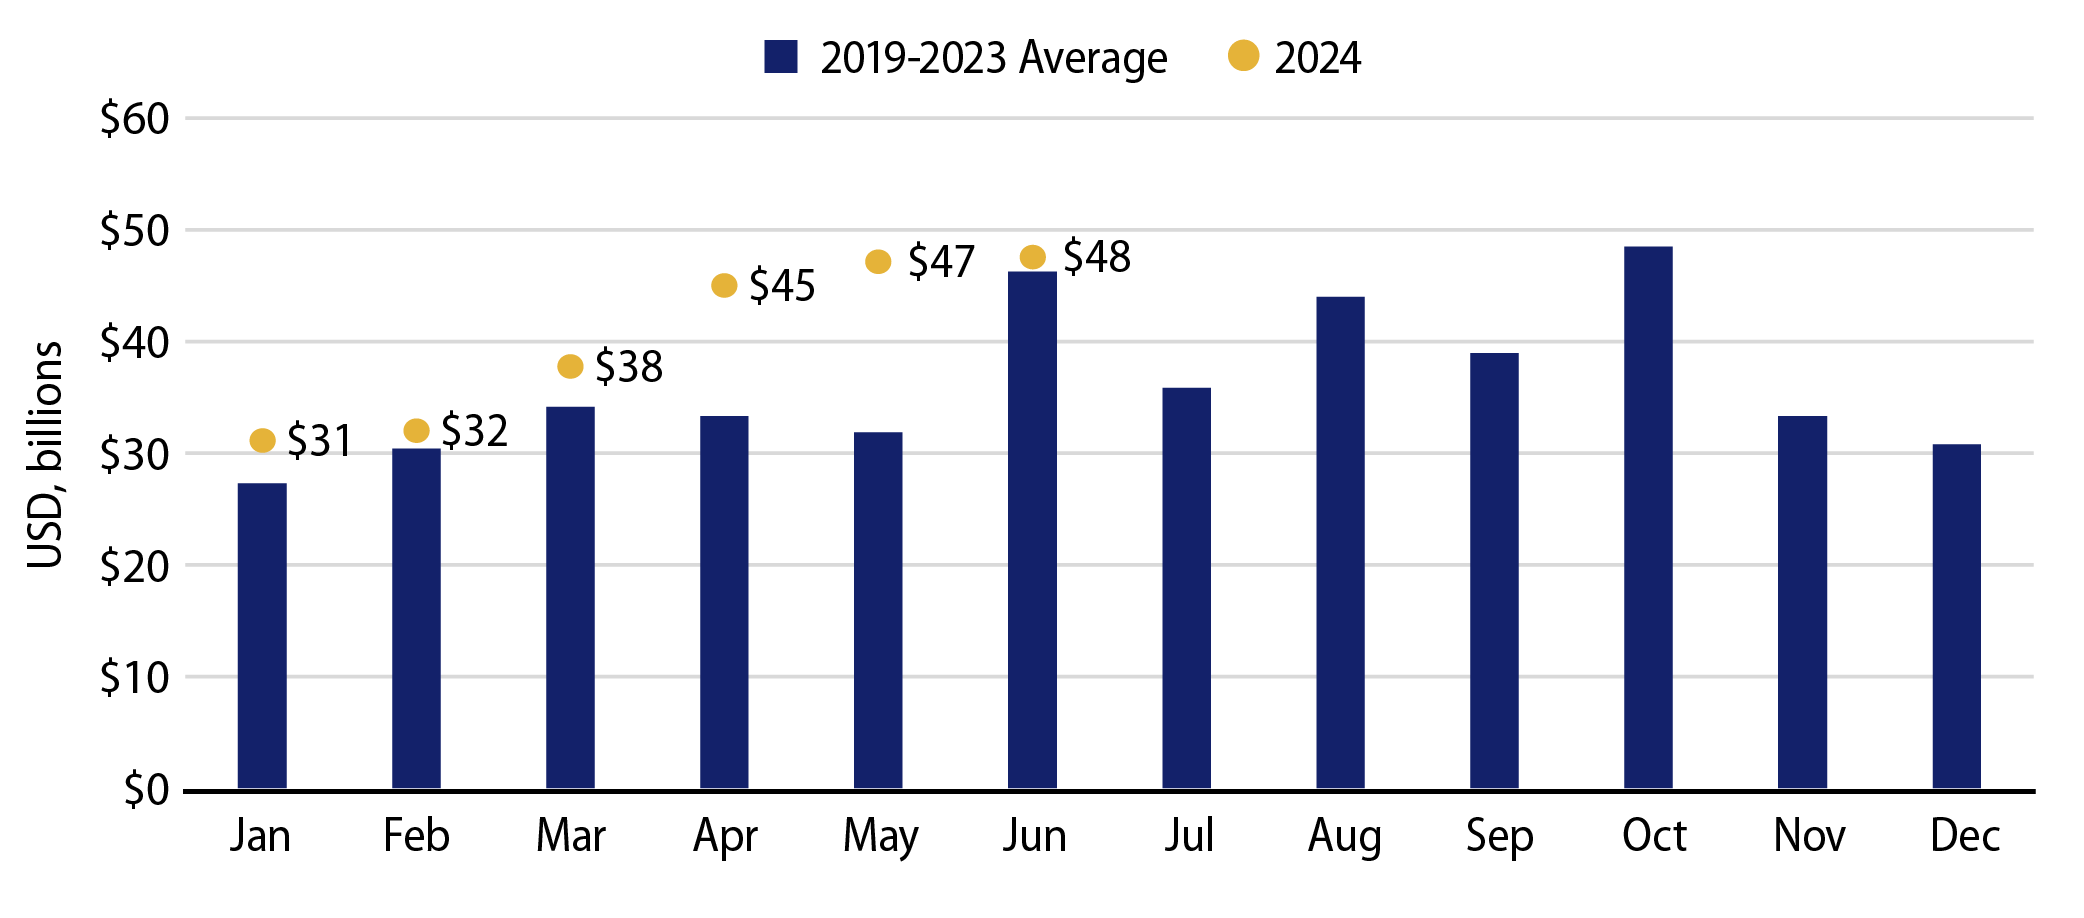
Supply (YTD supply of $240 billion, up 38% YoY): The muni market recorded a scant $653 million of new-issue volume last week, down 95% from the prior week due to the holiday-shortened week. YTD issuance of $240 billion is 38% higher than last year’s level, with tax-exempt issuance 42% higher and taxable issuance 4% higher year-over-year (YoY). This week’s calendar is expected to pick up back to an elevated $13 billion. The largest deals include $1.3 billion Dormitory Authority of the State of New York sales tax and $500 million Houston, Texas general obligation transactions.

This Week in Munis: Mid-Year Update

Performance
The muni market posted negative returns in the first half of the year as the market contended with ongoing rate volatility and robust new-issue supply levels following strong outperformance in 4Q23. The investment-grade Bloomberg Municipal Bond Index returned -0.40% in the first half of the year. Shorter-duration securities generally outperformed as rates moved higher following strong economic data, and lower-quality municipals outperformed as market fundamentals remained resilient.

Exhibit 1: 1H24 Bloomberg Index Returns
1H24 Bloomberg Index Returns
Source: Bloomberg. As of 30 Jun 24. Select the image to expand the view.

Supply/Demand
Municipal supply spiked in the first half of the year. Total new-issue supply reached $241 billion, up 38% from 2023 levels, driven by elevated tax-exempt refunding activity. Tax-exempt municipal issuance of $220 billion was up 43% YoY. The taxable supply of $21 billion was in line with last year’s level, but comprised a below-average 9% of total issuance.

Exhibit 2: 2024 Muni Supply vs. Five-Year Average
2024 Muni Supply vs. Five-Year Average
Source: Western Asset, Bloomberg. As of 30 Jun 24. Select the image to expand the view.

Municipal mutual funds returned to positive levels after recording $15 billion of net inflows in the first half of the year following two consecutive years of fund outflows, according to ICI. While positive, demand for municipal funds remains limited relative to the magnitude of over $120 billion of outflows observed in 2022 and 2023.

Fundamentals
First-quarter 2024 state and local government tax collections grew 2.2% from first-quarter 2023 levels to $487 billion. Among the major state revenue sources, individual income taxes declined 0.7% YoY, while corporate income and sales tax collections increased 1.5% and 0.3% YoY, respectively. Property tax collections, the primary source of revenue for local governments, increased 6.0% YoY to $195 billion. Continued tax collection growth highlights the resiliency of municipal credit, despite signs of slower economic growth.

Exhibit 3: 12-Month Trailing Collections State and Local Revenue Collections
12-Month Trailing Collections State and Local Revenue Collections
Source: Western Asset, Census. Data for major state and local tax revenue is not seasonally adjusted. As of 11 Jun 24 for 1Q24 data.

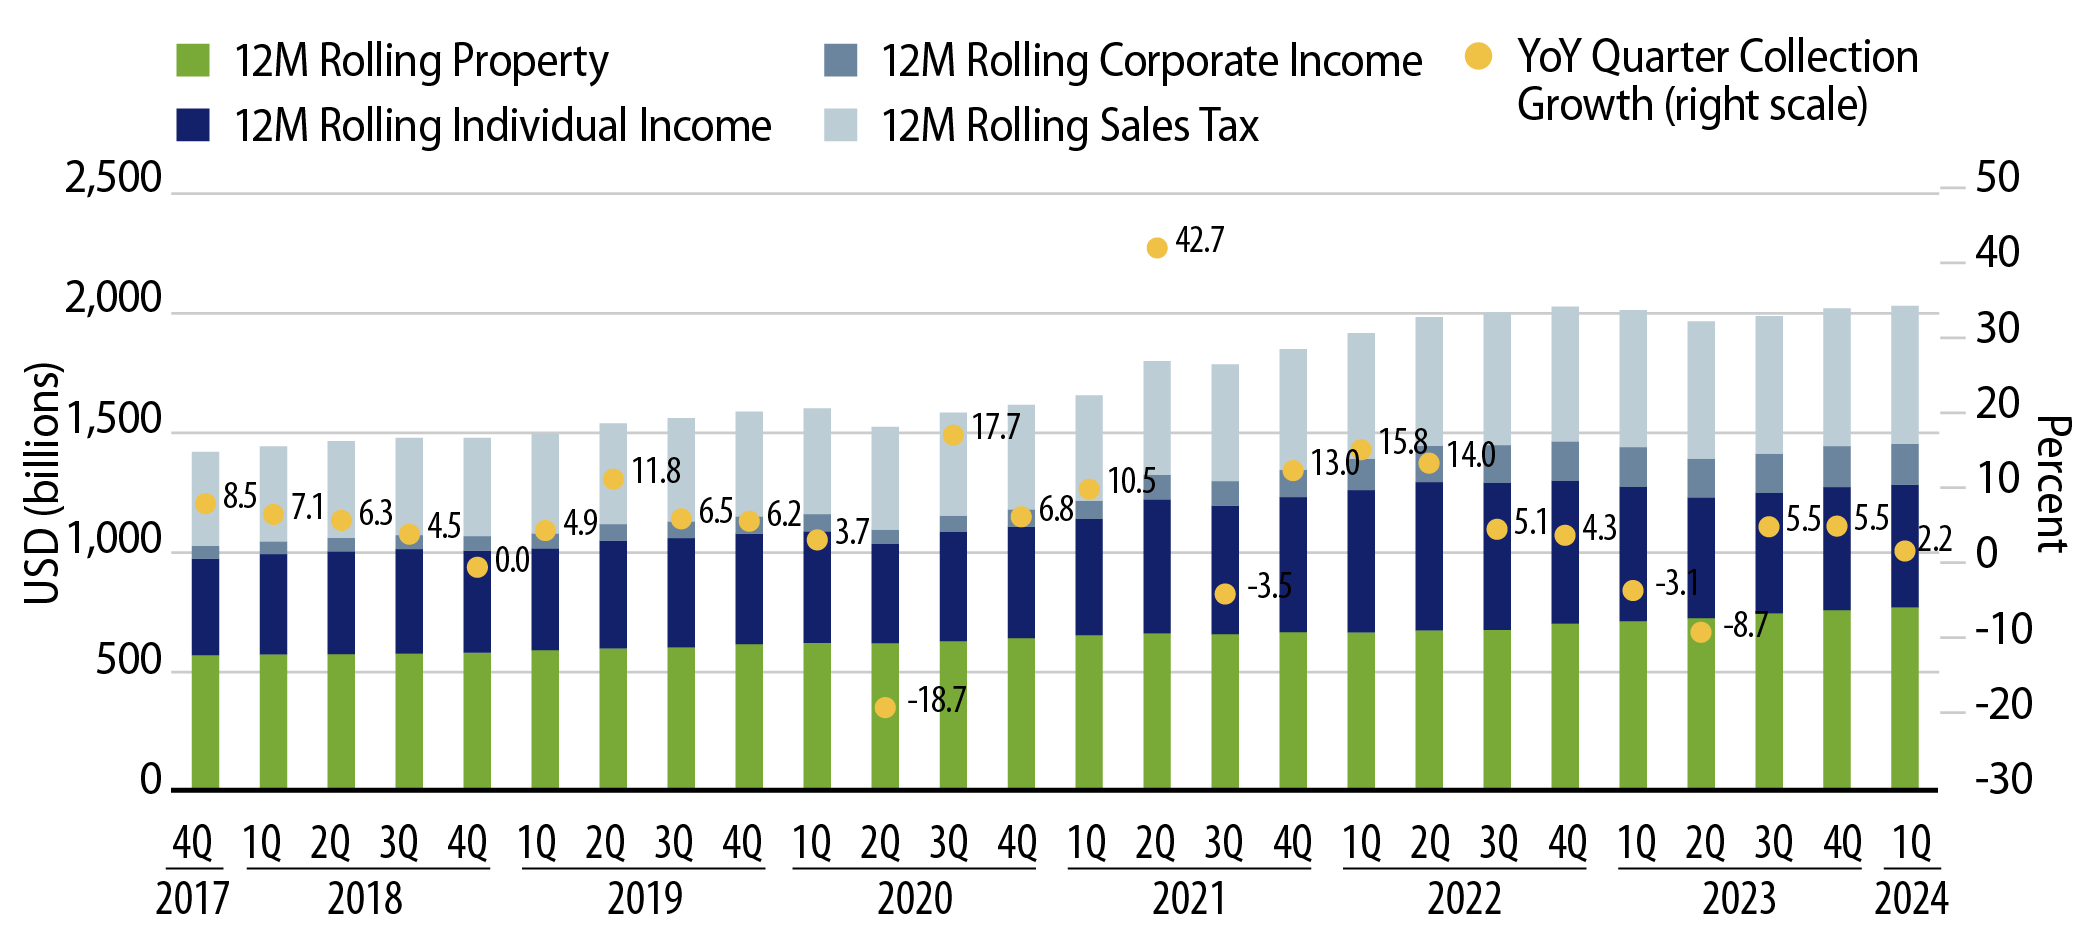
Rating agencies continue to take notice of improved credit fundamentals, with upgrades outpacing downgrades by a factor of over 3-to-1 in the first half of the year. According to Bloomberg data, first-time payment defaults declined 43% YoY to $711 million, isolated to the high-yield municipal segment and led by the continuing care and retirement community sector.

Valuations

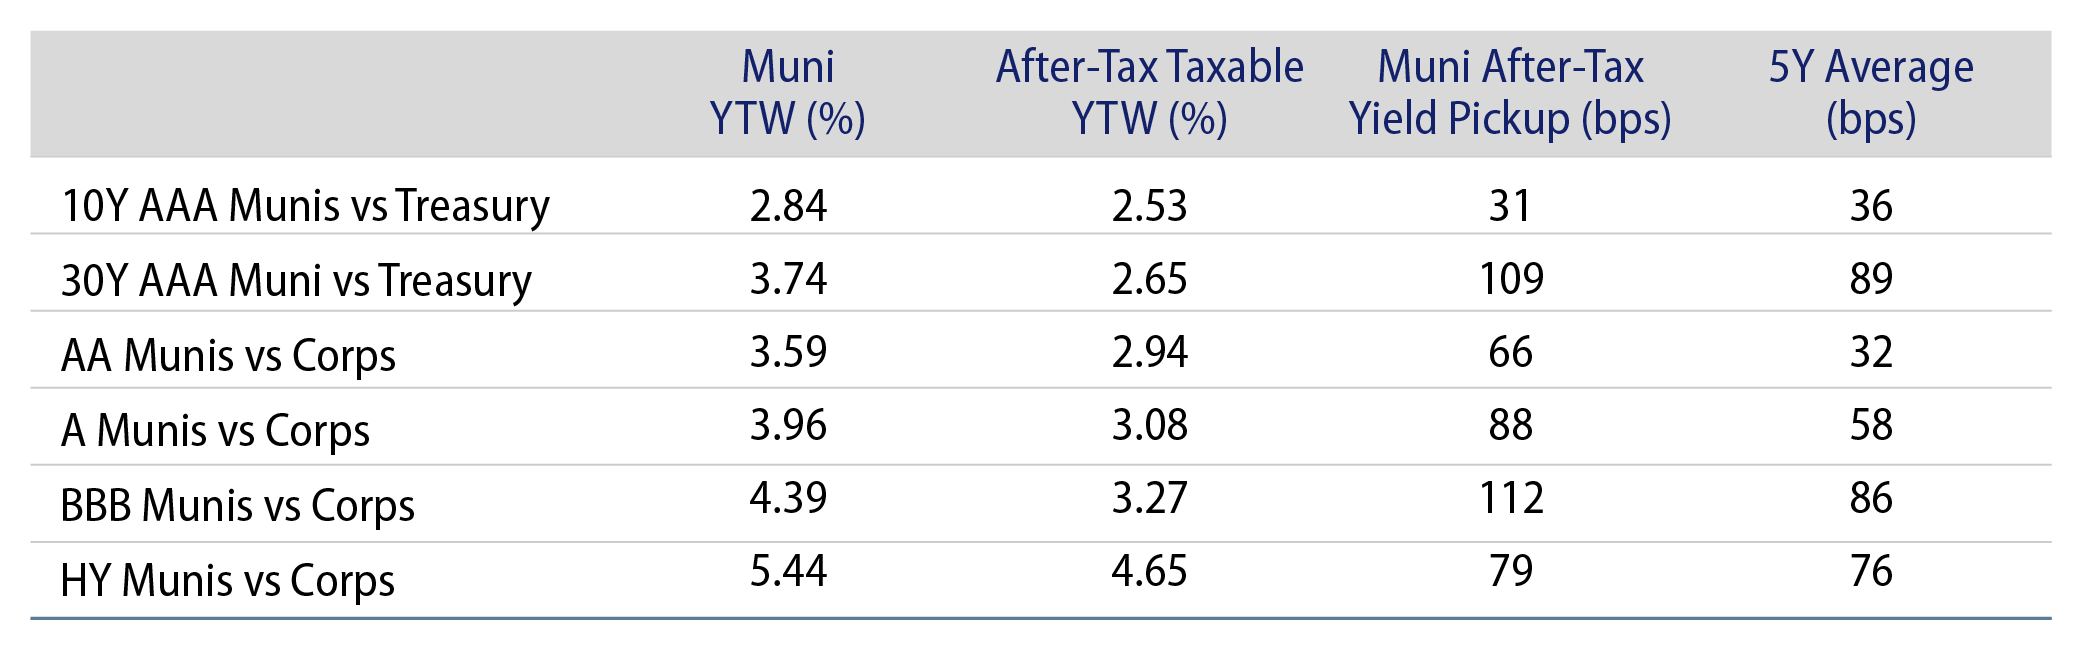
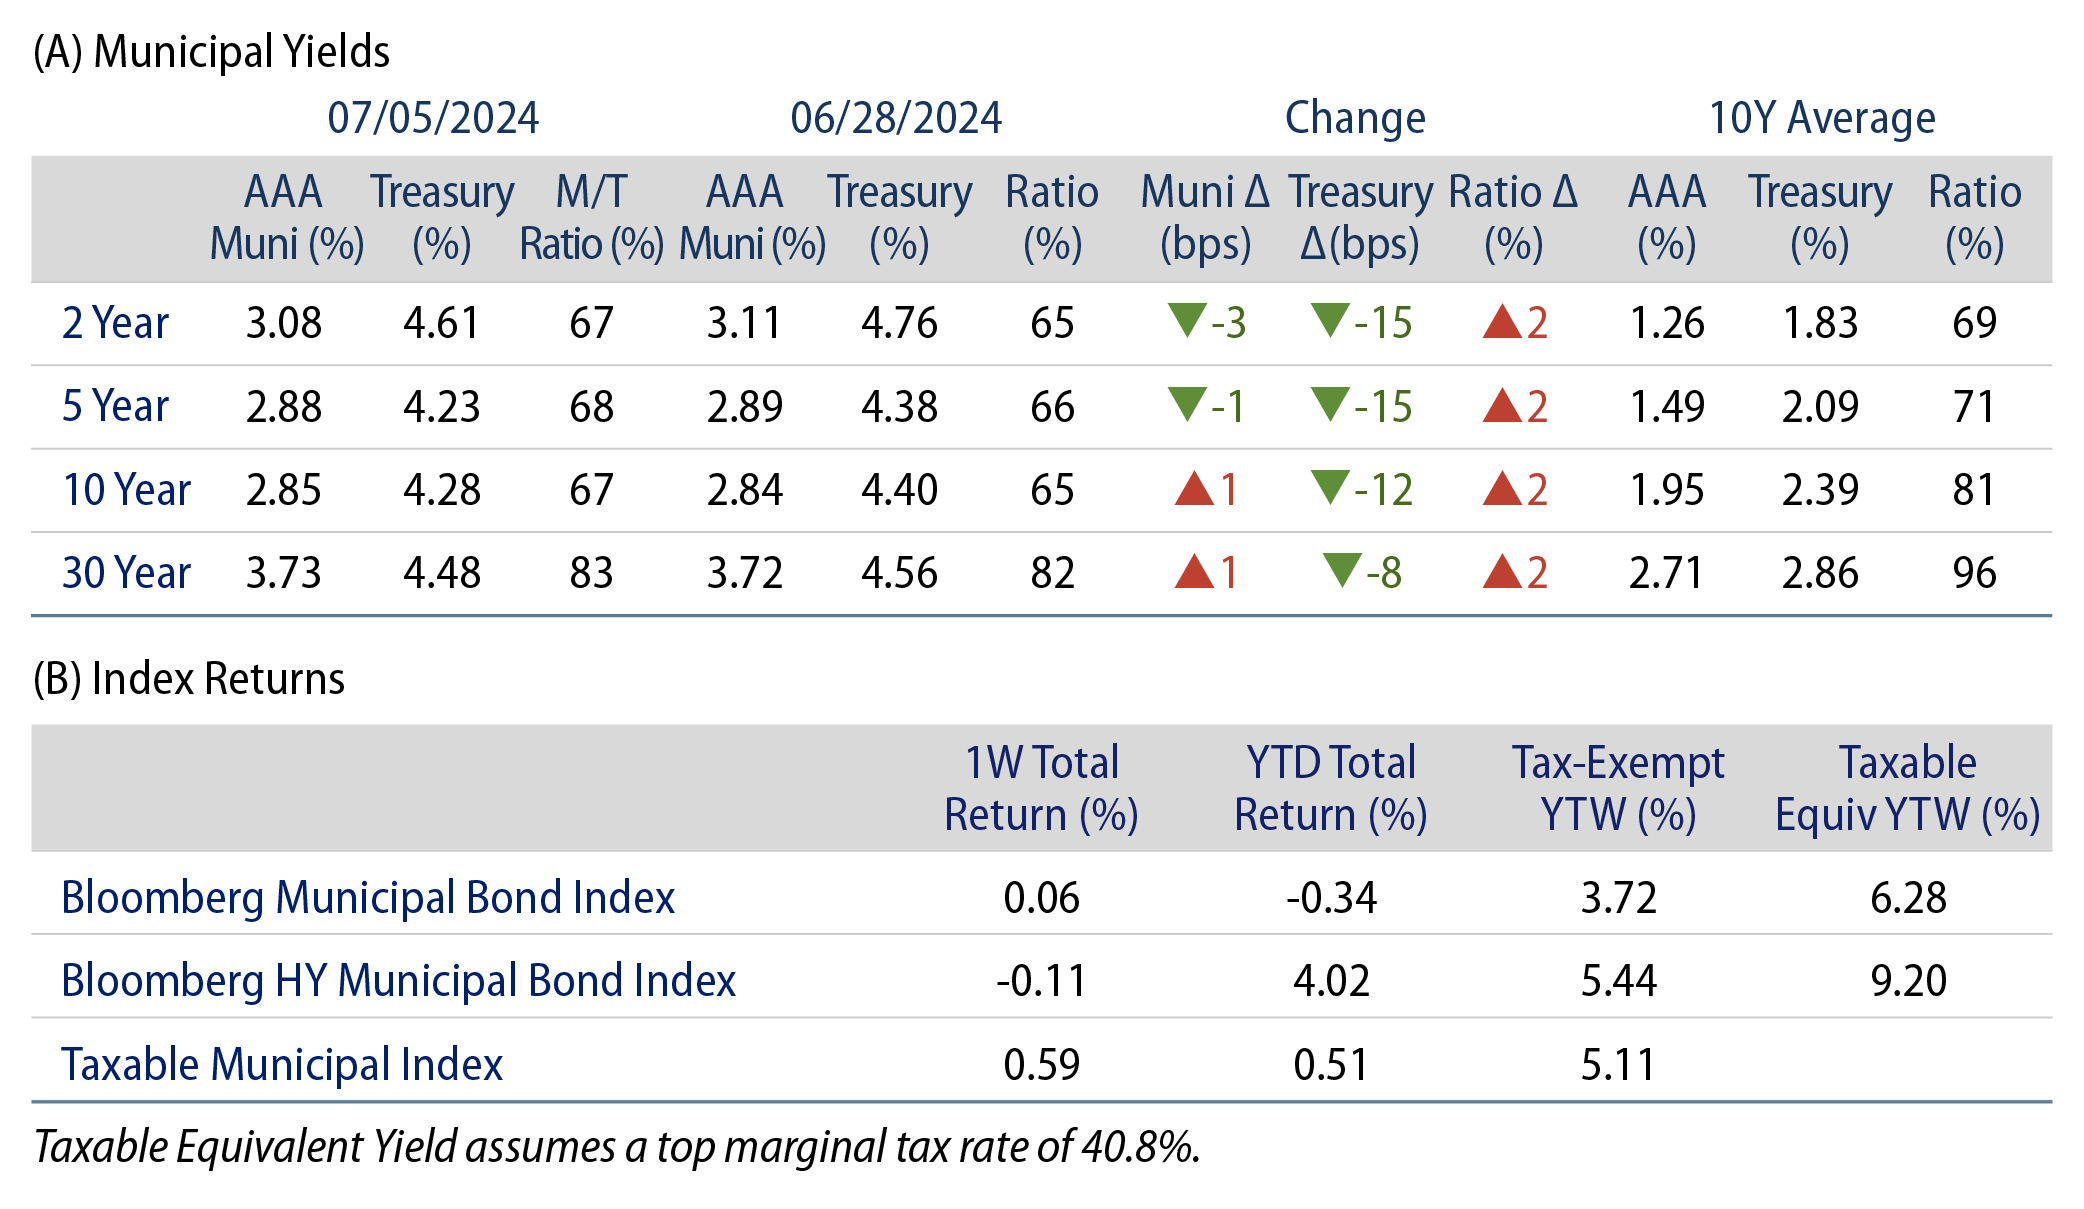
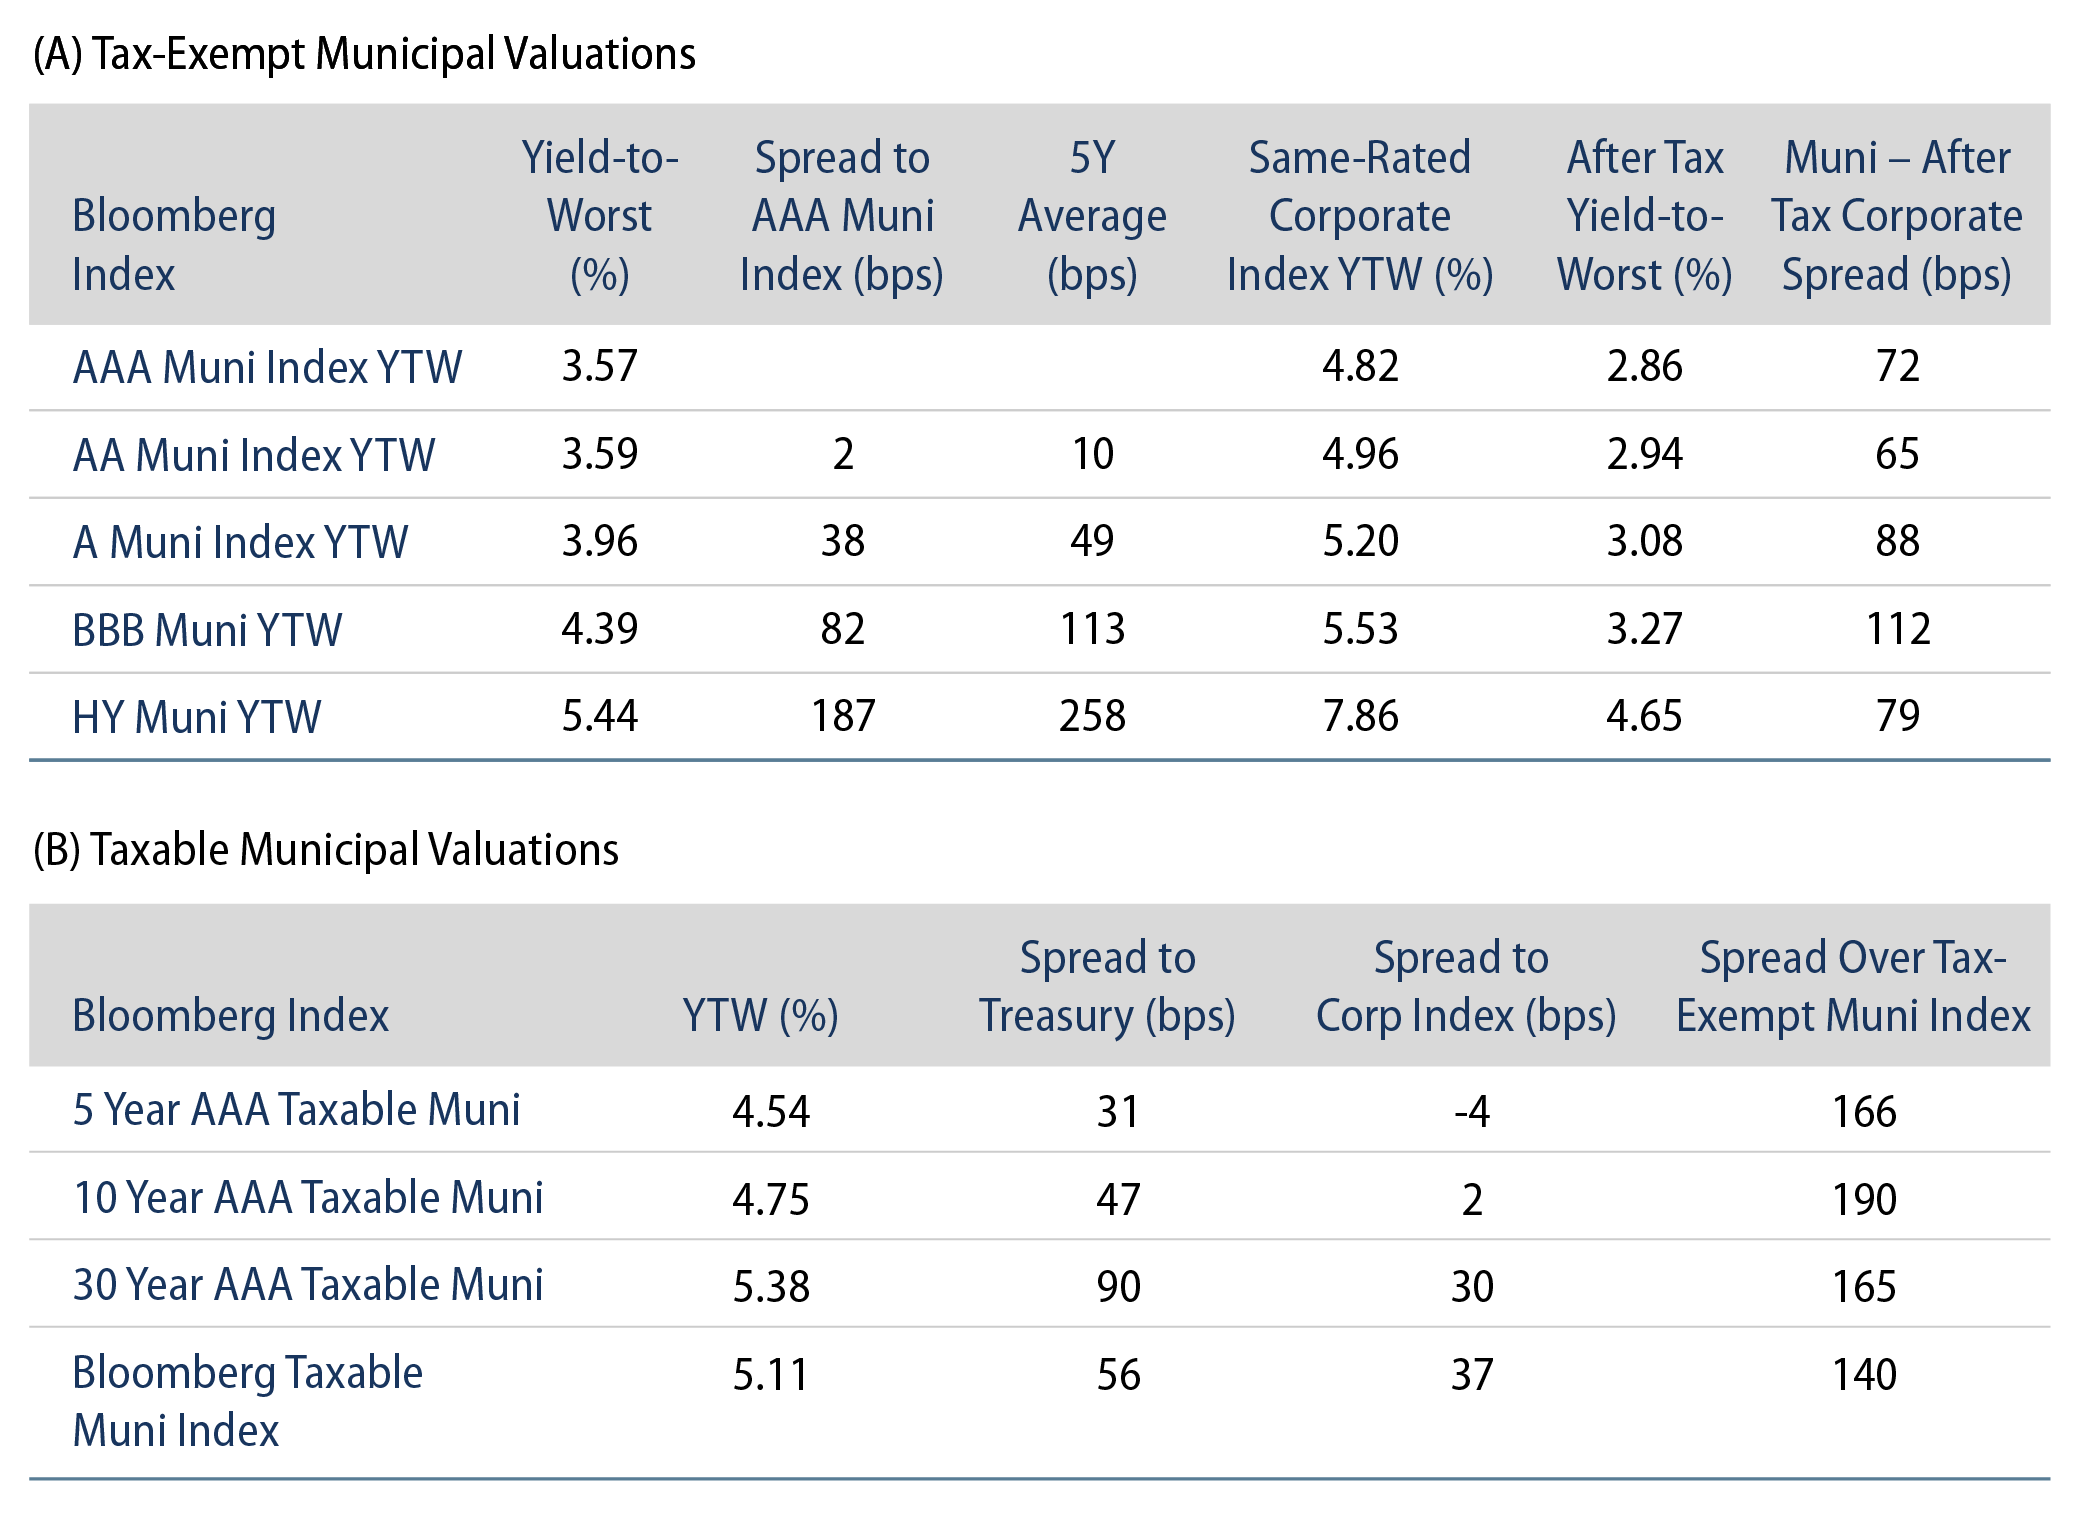
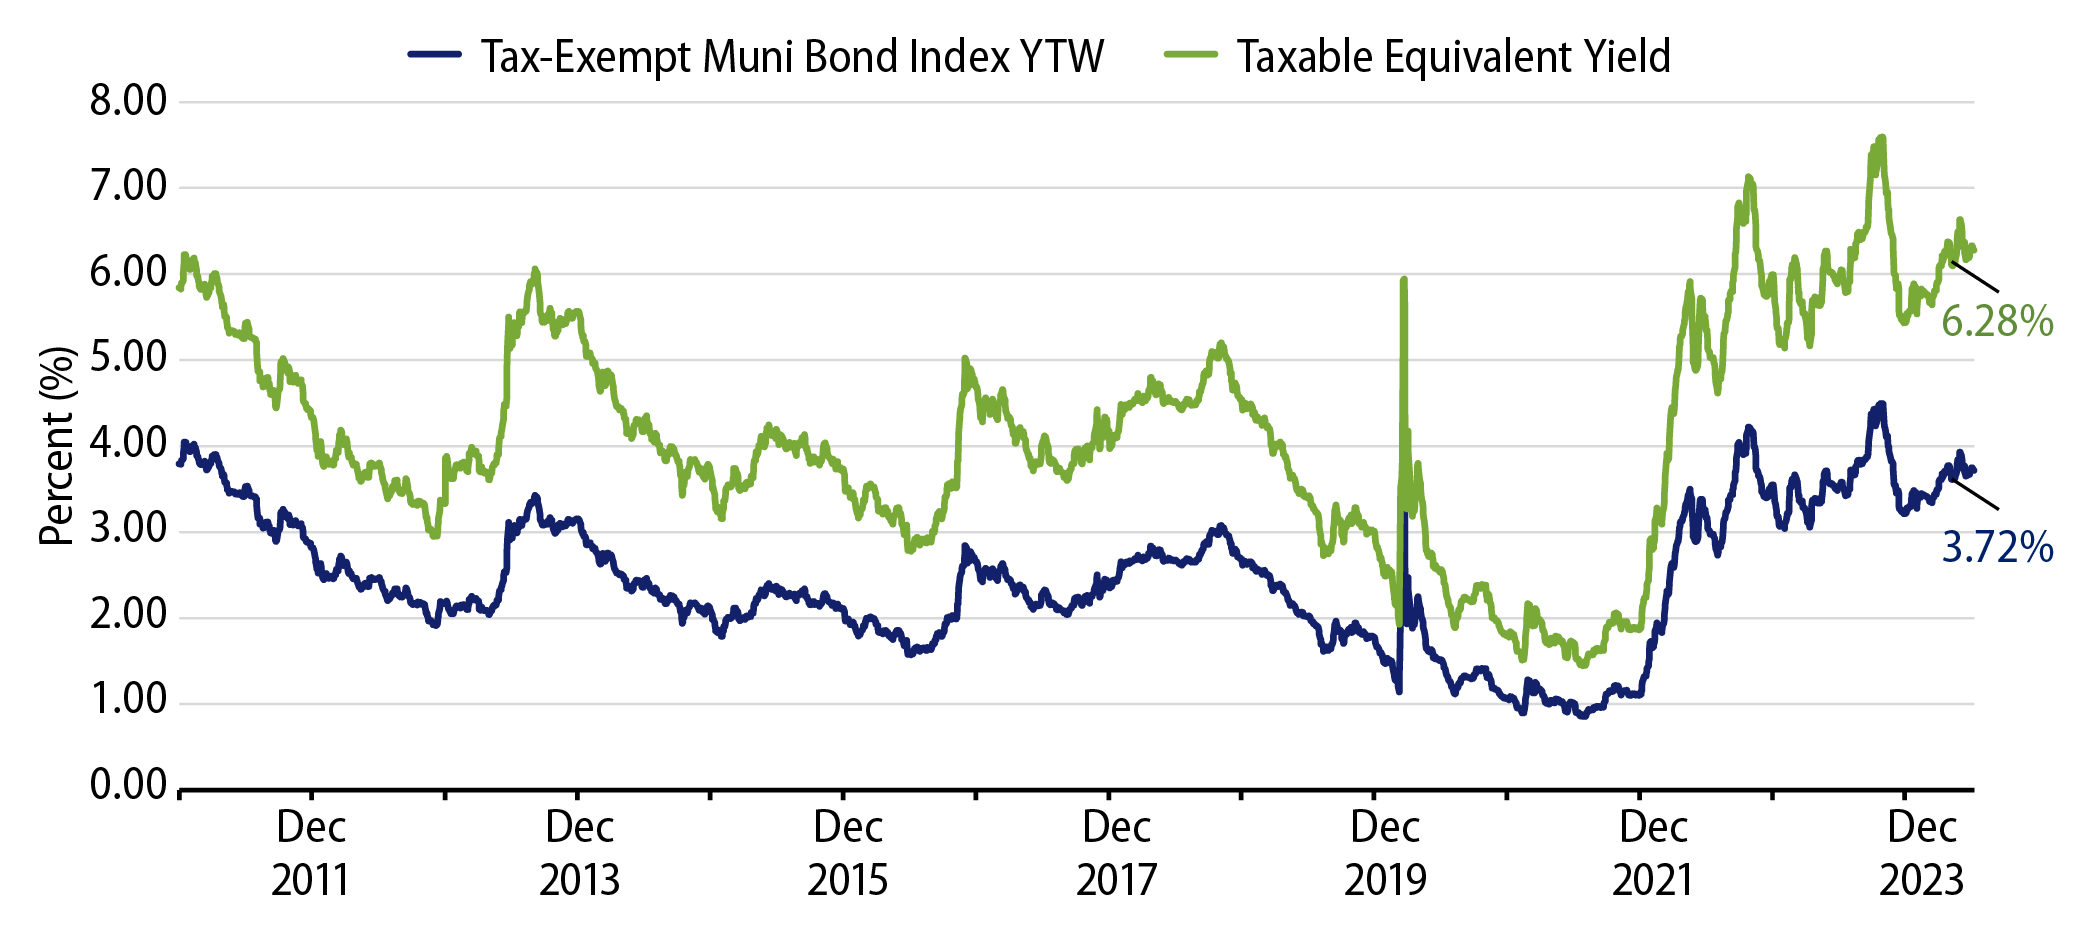
Negative performance YTD has resulted in higher tax-exempt municipal income opportunities and improved relative value of the municipal asset class. So far this year, the average Bloomberg Municipal Bond Index yield to worst (YTW) increased by 50 basis points (bps) to 3.72%, improving the taxable equivalent yield for a top taxpayer to 6.28% (from 5.44%).

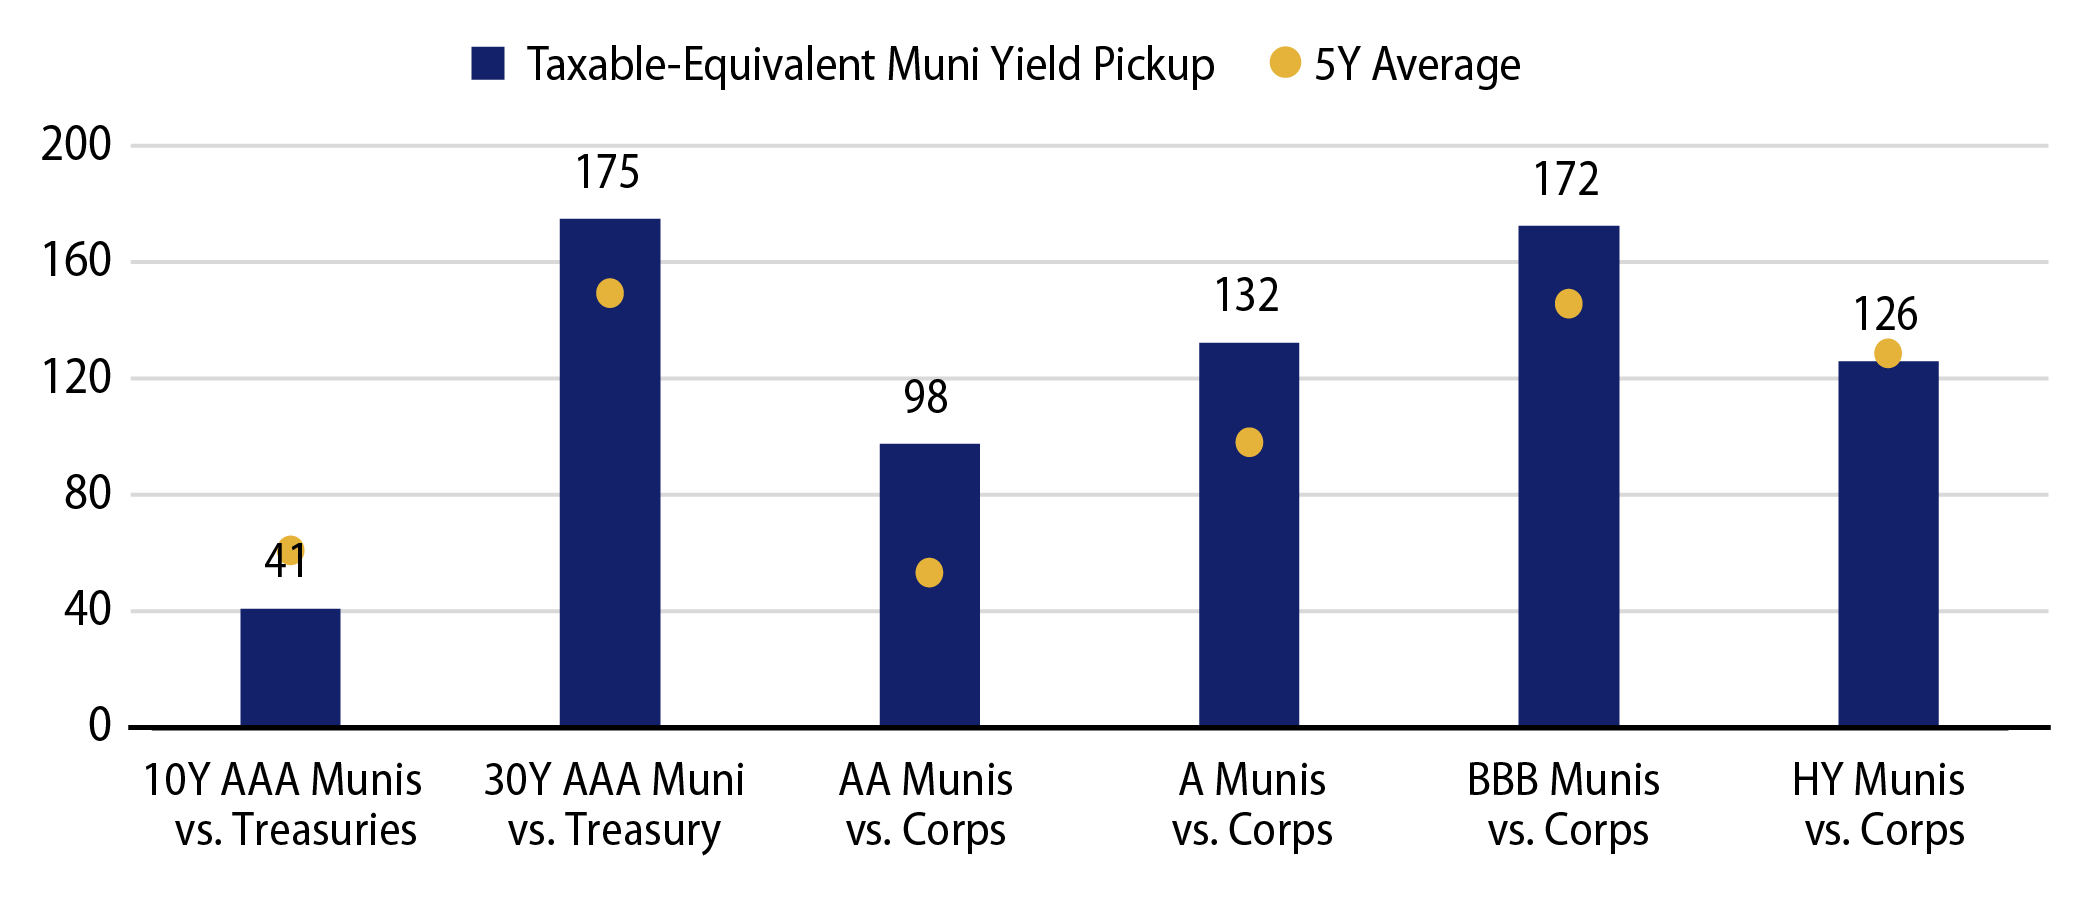
Compared to taxable alternatives, municipals offer a compelling relative value proposition. Longer-duration and lower investment-grade municipal credit offer more than 100 bps of after-tax yield pickup versus like-structured Treasuries and corporate counterparts. Western Asset believes that elevated supply and attractive relative value, in the context of favorable credit fundamentals, offer an attractive entry point for long-term investors who can benefit from long-term tax-exempt income.

Exhibit 4: Taxable-Equivalent Municipal Yield Pickup vs. Five-Year Average
Taxable-Equivalent Municipal Yield Pickup vs. Five-Year Average
Source: Western Asset, Bloomberg. As of 30 Jun 24. Select the image to expand the view.

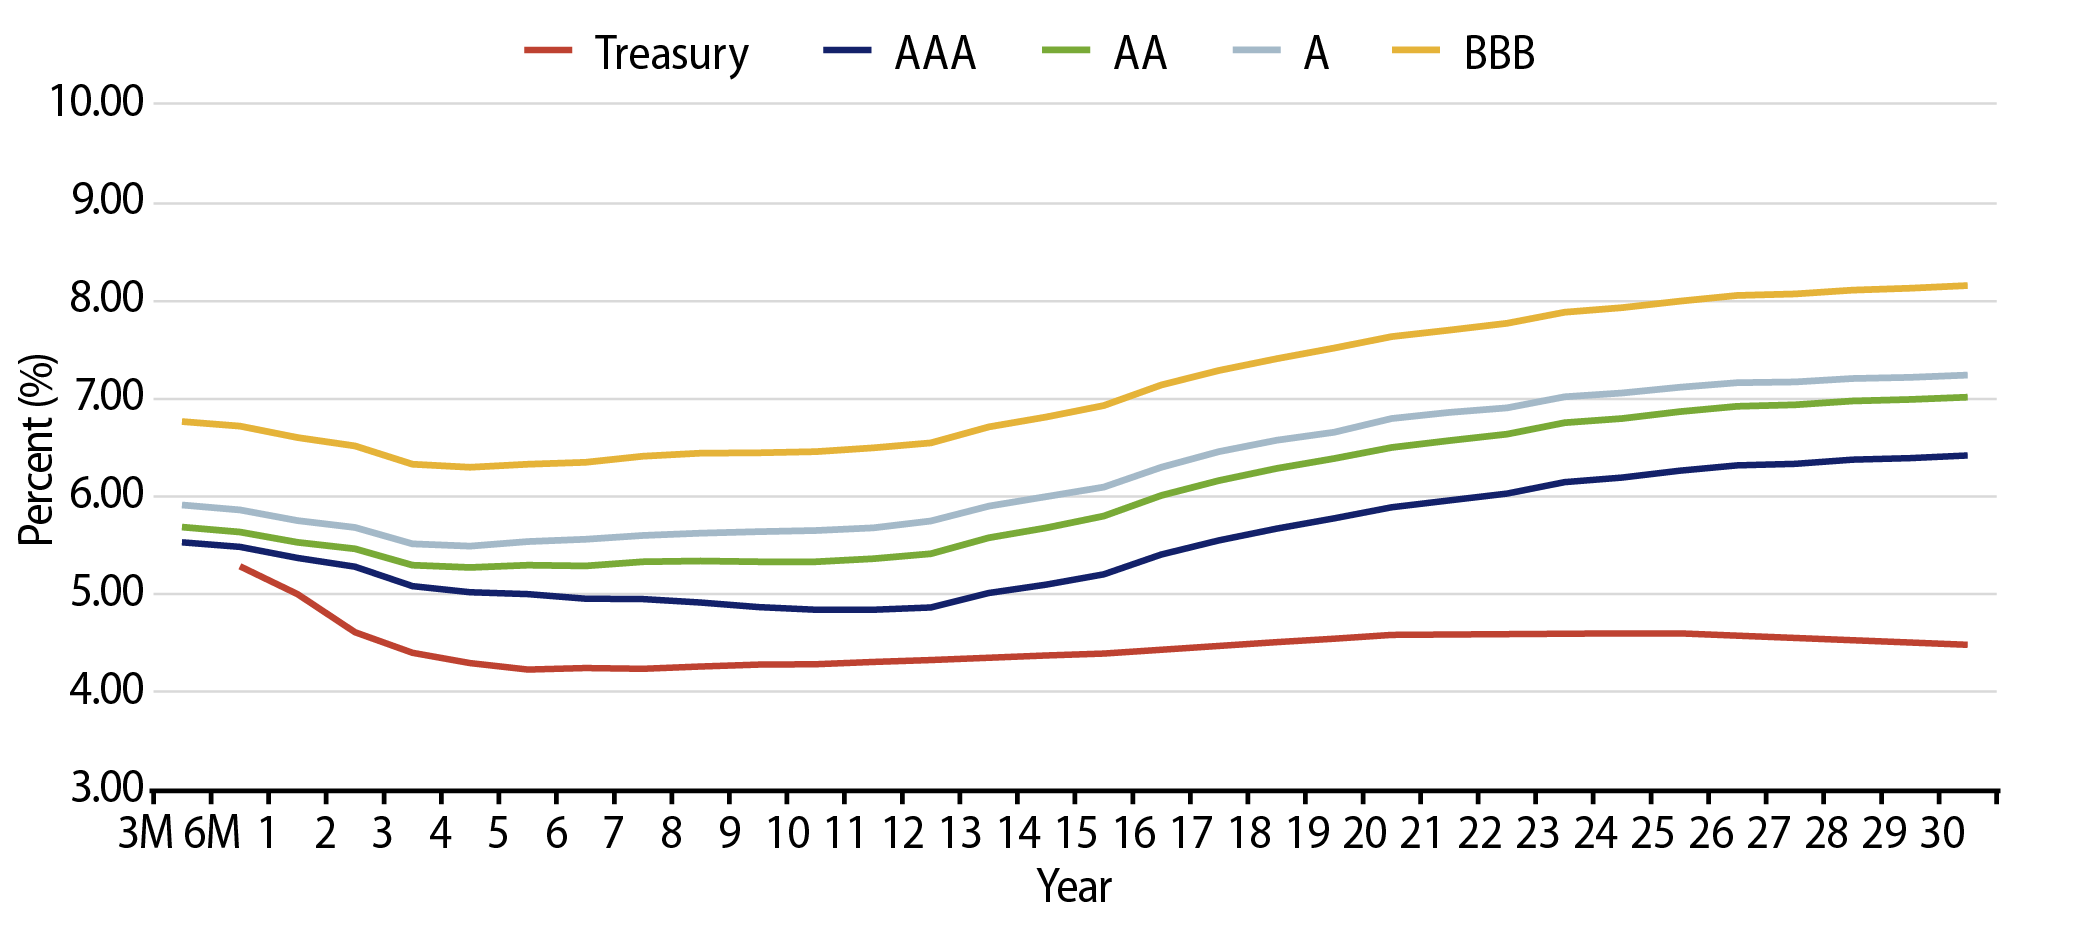
Municipal Credit Curves and Relative Value

Exhibit 5: Muni Credit Curves
Muni Credit Curves
Source: Bloomberg, Western Asset. As of 05 Jul 24. Bloomberg BVAL Municipal Credit Indices (AAA, AA, A, BBB, respectively) and US Sovereign Curves. Taxable-Equivalent Muni Credit Curves consider the top marginal effective tax rate of 40.8%. Select the image to expand the view.
Exhibit 6: Taxable-Equivalent Muni Credit Curves
Taxable-Equivalent Muni Credit Curves
Source: Bloomberg, Western Asset. As of 05 Jul 24. Bloomberg BVAL Municipal Credit Indices (AAA, AA, A, BBB, respectively) and US Sovereign Curves. Taxable-Equivalent Muni Credit Curves consider the top marginal effective tax rate of 40.8%. Select the image to expand the view.
Exhibit 7: AAA Munis vs. Treasuries
AAA Munis vs. Treasuries
Source: Muni Yields: Thomson Reuters MMD, Treasury Yields: Bloomberg. As of 05 Jul 24. Past performance is not a guarantee of future results. It is not possible to invest directly in an Index. Select the image to expand the view.
Exhibit 8: Tax-Exempt and Taxable Muni Valuations
Tax-Exempt and Taxable Muni Valuations
Source: Bloomberg. Yield-to-worst (YTW) is the lowest potential yield that can be received on a bond without the issuer actually defaulting. As of 05 Jul 24. Select the image to expand the view.

Western Asset Key Themes for Muni Investors

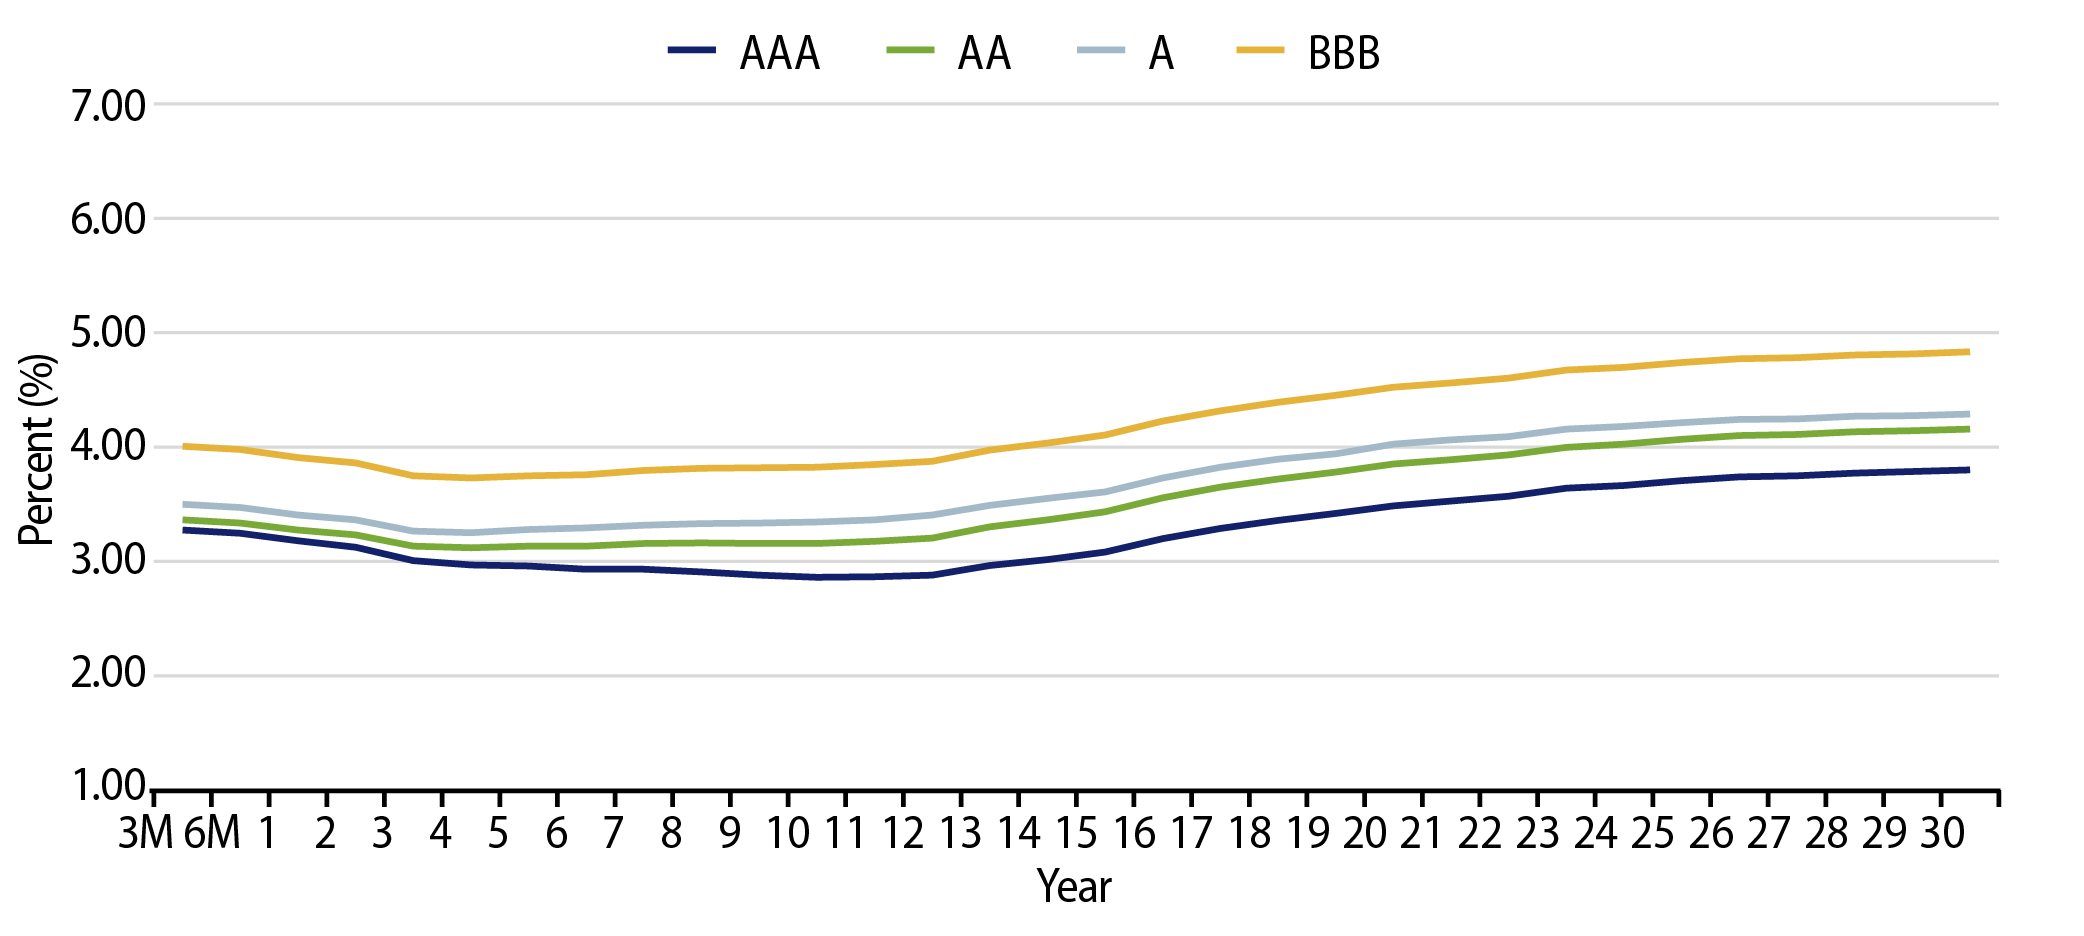
Theme #1: Municipal taxable-equivalent yields are above decade averages.

Exhibit 9: Muni and Taxable-Equivalent Muni Yield-to-Worst
Muni and Taxable-Equivalent Muni Yield-to-Worst
Source: Bloomberg, Western Asset. As of 05 Jul 24. Bloomberg Municipal Bond Index Yield Considering Highest Marginal Tax Rate of 40.8%. Indexes are unmanaged and one cannot directly invest in them. They do not include fees, expenses or sales charges. Past performance is not an indicator or a guarantee of future results. Select the image to expand the view.

Theme #2: The muni yield curve has disinverted in recent weeks, but bar-belled value remains.

Exhibit 10: AAA Municipal vs. Treasury Yield Curves
AAA Municipal vs. Treasury Yield Curves
Source: Bloomberg, Western Asset. As of 05 Jul 24. Bloomberg Valuation Service (BVAL) AAA Muni Curve and US On-/Off-the-Run Sovereign Curve. Indexes are unmanaged and one cannot directly invest in them. They do not include fees, expenses or sales charges. Past performance is not an indicator or a guarantee of future results. Select the image to expand the view.

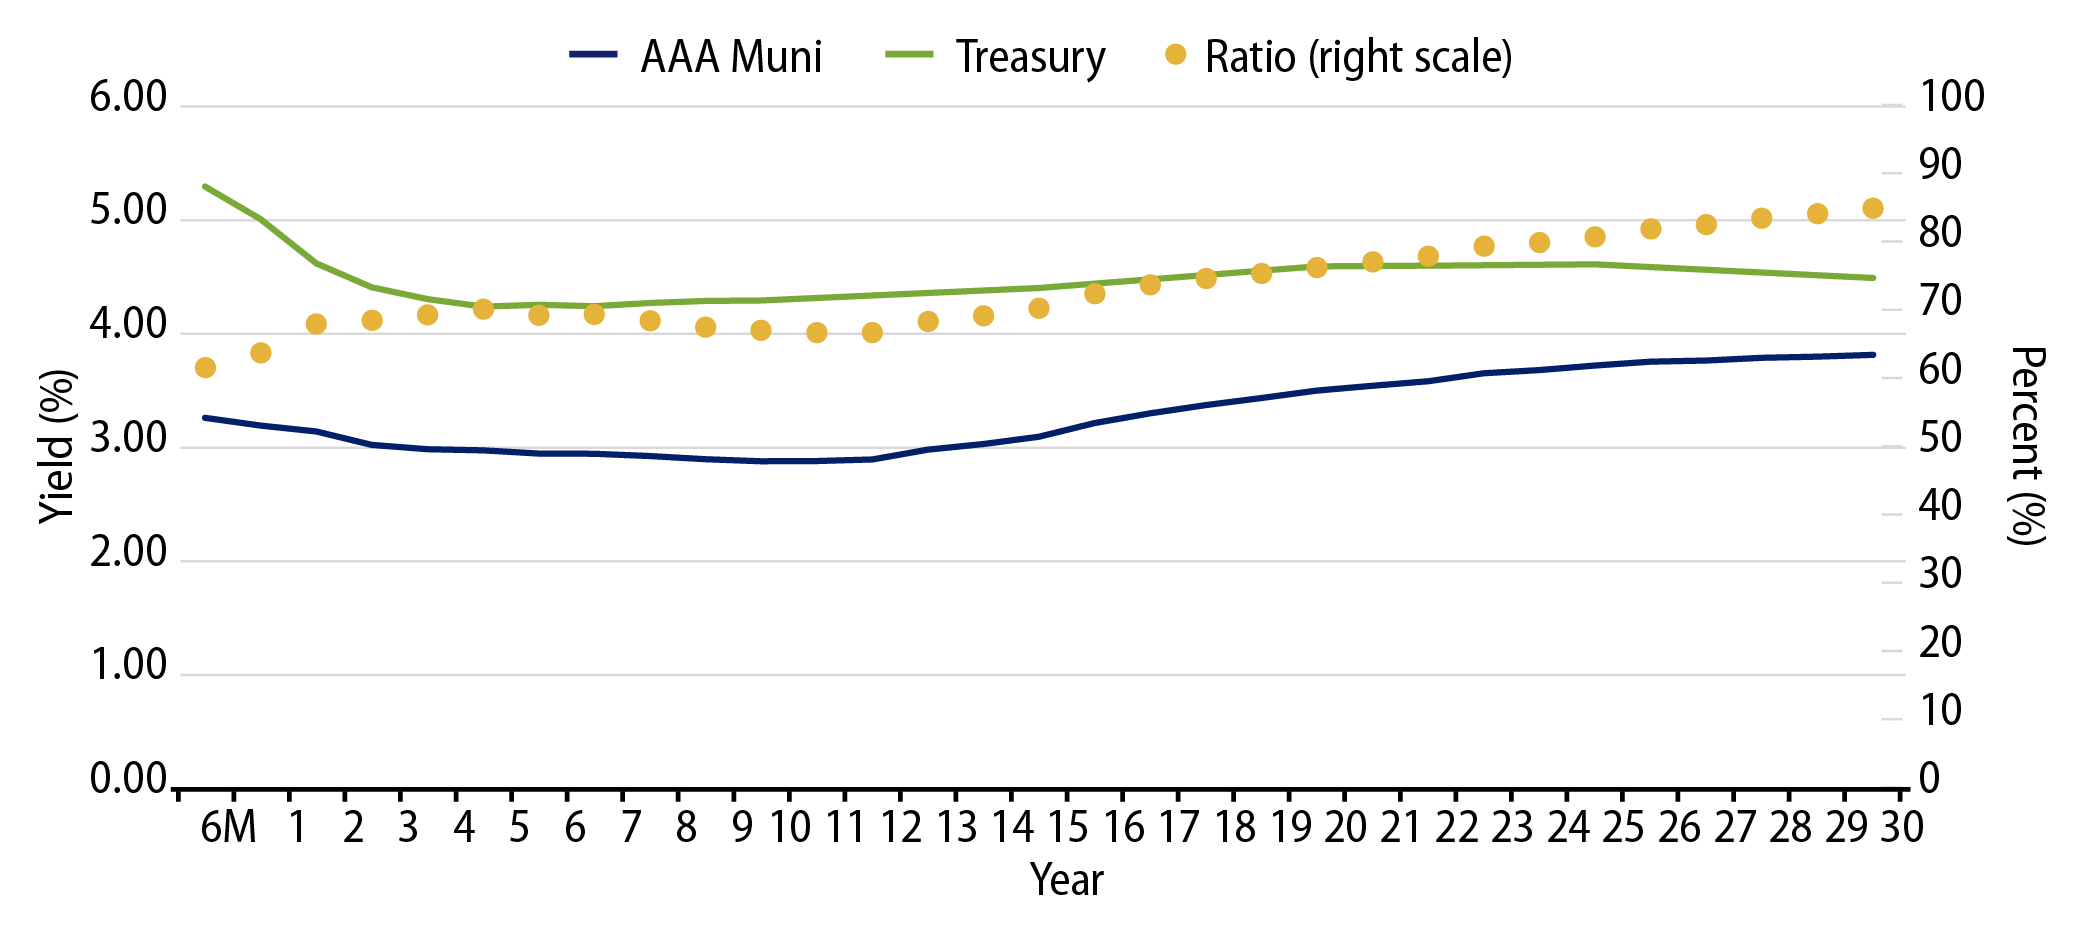
Theme #3: Munis offer attractive after-tax yield pickup versus longer-dated Treasuries and investment-grade corporate credit.

Exhibit 11: Municipal vs. Taxable Fixed-Income Yields by Quality
Municipal vs. Taxable Fixed-Income Yields by Quality
Source: Western Asset, Bloomberg. As 05 Jul 24. 10- and 30-Year comparison reflects Bloomberg Valuation Service (BVAL) AAA Muni Curve and US On-/Off-the-Run Sovereign Curve. AA Muni reflects the Bloomberg AA Muni Bond Index. A Muni reflects the Bloomberg A Muni Bond Index. BBB Muni reflects the Bloomberg BBB Muni Bond Index. HY Muni reflects the Bloomberg High Yield Muni Bond Index. AA Corp reflects the Bloomberg AA Corporate Bond Index. A Corp reflects the Bloomberg A Corporate Bond Index. BBB Corp reflects the Bloomberg BBB Corporate Bond Index. After-tax yield considers top marginal tax rate of 40.8%. Indexes are unmanaged and one cannot directly invest in them. They do not include fees, expenses or sales charges. Past performance is not an indicator or a guarantee of future results. Select the image to expand the view.

© Western Asset Management Company, LLC 2025. The information contained in these materials ("the materials") is intended for the exclusive use of the designated recipient ("the recipient"). This information is proprietary and confidential and may contain commercially sensitive information, and may not be copied, reproduced or republished, in whole or in part, without the prior written consent of Western Asset Management Company ("Western Asset").
Past performance does not predict future returns. These materials should not be deemed to be a prediction or projection of future performance. These materials are intended for investment professionals including professional clients, eligible counterparties, and qualified investors only.
These materials have been produced for illustrative and informational purposes only. These materials contain Western Asset's opinions and beliefs as of the date designated on the materials; these views are subject to change and may not reflect real-time market developments and investment views.
Third party data may be used throughout the materials, and this data is believed to be accurate to the best of Western Asset's knowledge at the time of publication, but cannot be guaranteed. These materials may also contain strategy or product awards or rankings from independent third parties or industry publications which are based on unbiased quantitative and/or qualitative information determined independently by each third party or publication. In some cases, Western Asset may subscribe to these third party's standard industry services or publications. These standard subscriptions and services are available to all asset managers and do not influence rankings or awards in any way.
Investment strategies or products discussed herein may involve a high degree of risk, including the loss of some or all capital. Investments in any products or strategies described in these materials may be volatile, and investors should have the financial ability and willingness to accept such risks.
Unless otherwise noted, investment performance contained in these materials is reflective of a strategy composite. All other strategy data and information included in these materials reflects a representative portfolio which is an account in the composite that Western Asset believes most closely reflects the current portfolio management style of the strategy. Performance is not a consideration in the selection of the representative portfolio. The characteristics of the representative portfolio shown may differ from other accounts in the composite. Information regarding the representative portfolio and the other accounts in the composite are available upon request. Statements in these materials should not be considered investment advice. References, either general or specific, to securities and/or issuers in the materials are for illustrative purposes only and are not intended to be, and should not be interpreted as, recommendation to purchase or sell such securities. Employees and/or clients of Western Asset may have a position in the securities or issuers mentioned.
These materials are not intended to provide, and should not be relied on for, accounting, legal, tax, investment or other advice. The recipient should consult its own counsel, accountant, investment, tax, and any other advisers for this advice, including economic risks and merits, related to making an investment with Western Asset. The recipient is responsible for observing the applicable laws and regulations of their country of residence.
Founded in 1971, Western Asset Management Company is a global fixed-income investment manager with offices in Pasadena, New York, London, Singapore, Tokyo, Melbourne, São Paulo, Hong Kong, and Zürich. Western Asset is a wholly owned subsidiary of Franklin Resources, Inc. but operates autonomously. Western Asset is comprised of six legal entities across the globe, each with distinct regional registrations: Western Asset Management Company, LLC, a registered Investment Adviser with the Securities and Exchange Commission; Western Asset Management Company Ltda. is regulated by Comissão de Valores Mobiliários; Western Asset Management Company Pty Ltd ABN 41 117 767 923 is the holder of the Australian Financial Services License 303160; Western Asset Management Company Pte. Ltd. Co. Reg. No. 200007692R is a holder of a Capital Markets Services License for fund management and regulated by the Monetary Authority of Singapore; Western Asset Management Company Ltd, a registered Financial Instruments Business Operator and regulated by the Financial Services Agency of Japan; and Western Asset Management Company Limited is authorised and regulated by the Financial Conduct Authority ("FCA") (FRN 145930). This communication is intended for distribution to Professional Clients only if deemed to be a financial promotion in the UK as defined by the FCA. This communication may also be intended for certain EEA countries where Western Asset has been granted permission to do so. For the current list of the approved EEA countries please contact Western Asset at +44 (0)20 7422 3000.