Munis Posted Positive Returns Last Week
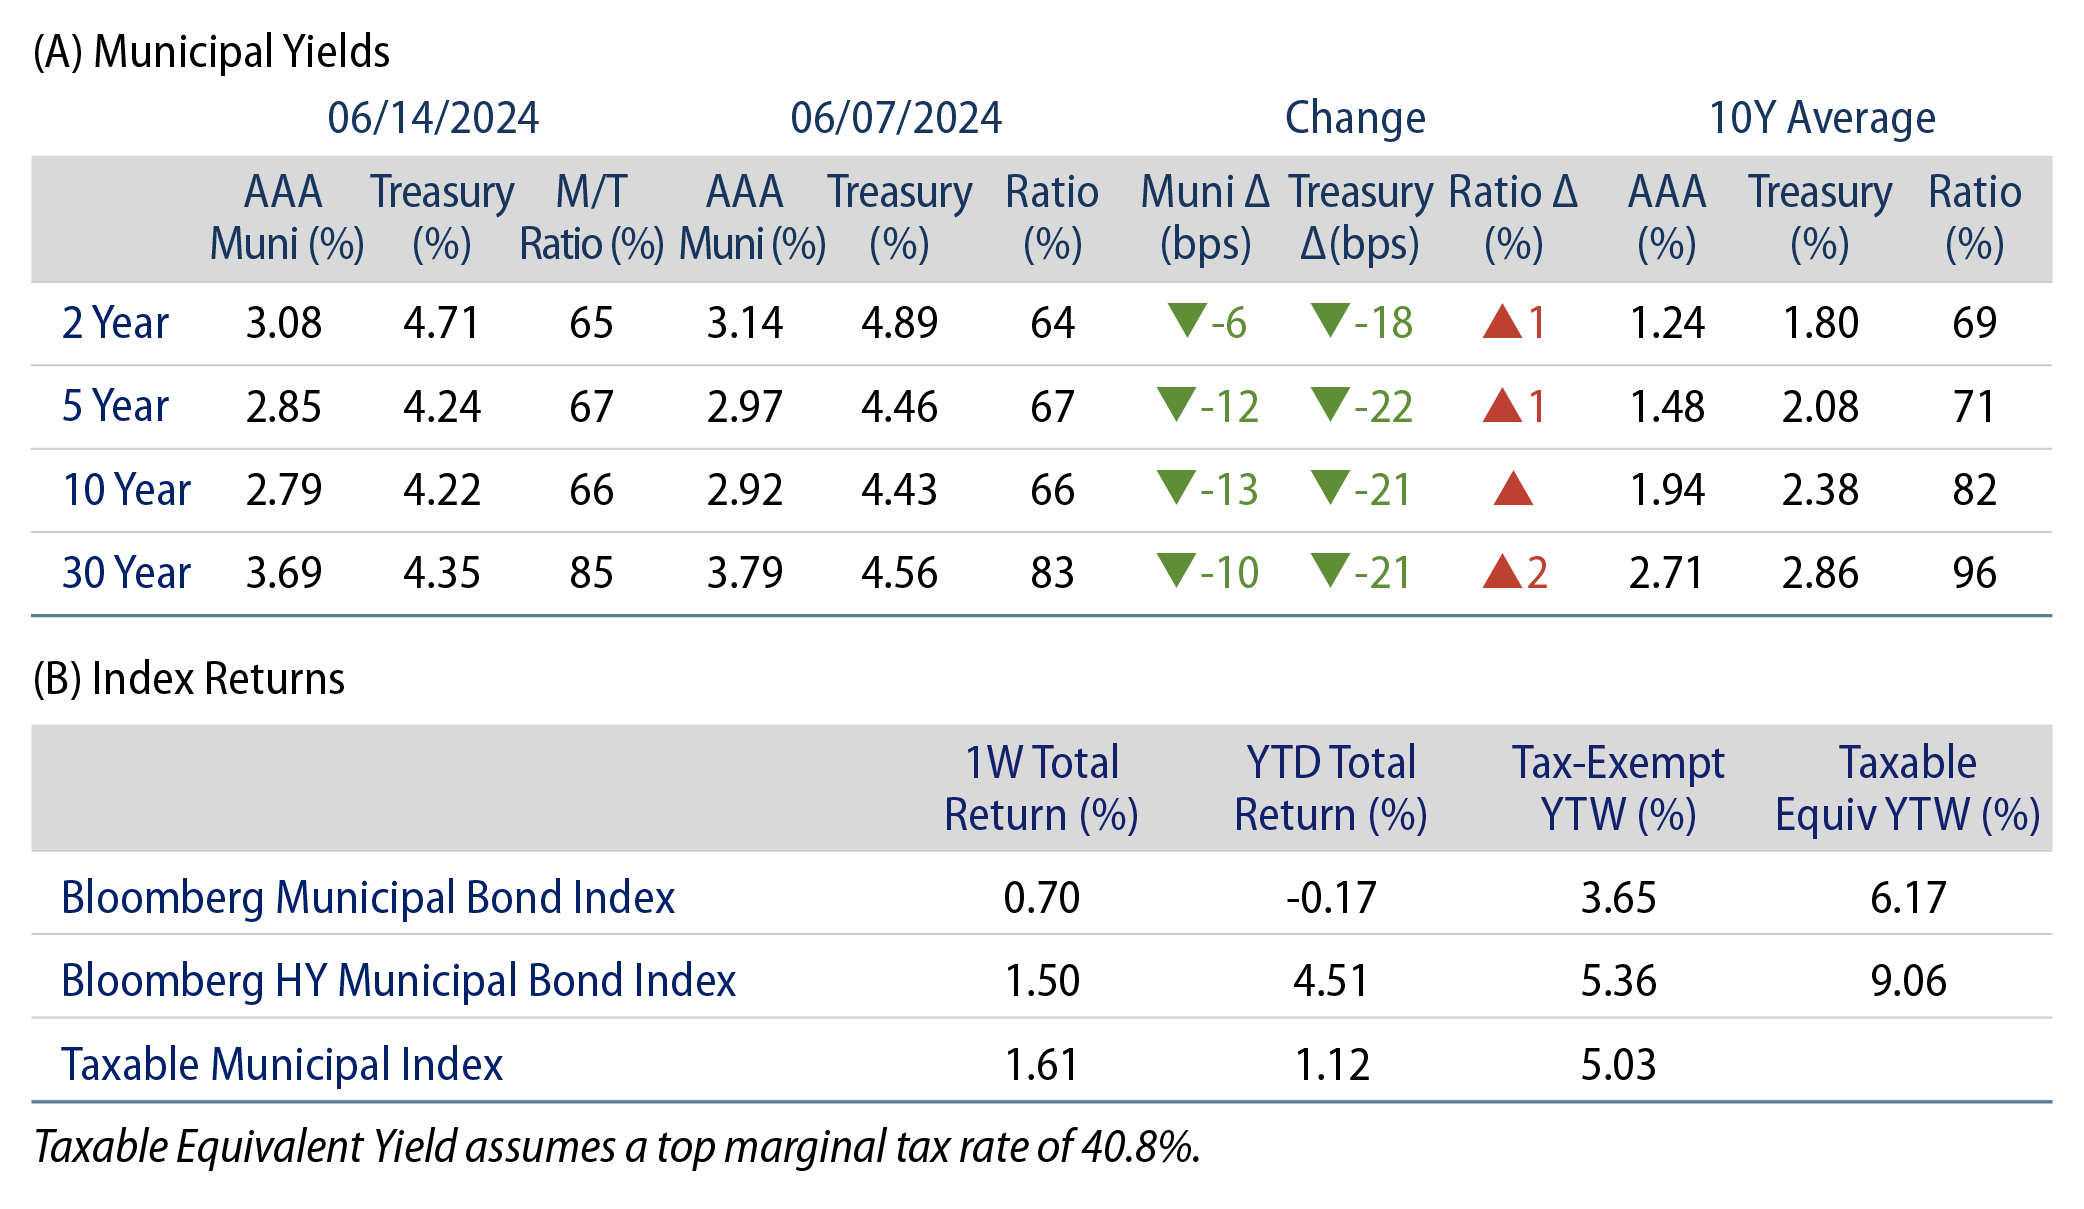
Municipals posted strong returns last week as yields moved lower across the curve. Munis rallied with Treasuries following softer-than-expected inflation data and higher jobless claims. Meanwhile, muni fund flows remained positive amid a sizeable new-issue calendar. The Bloomberg Municipal Index returned 0.70% during the week, the High Yield Muni Index returned 1.50% and the Taxable Muni Index returned 1.61%. This week we discuss Federal Reserve (Fed) municipal holdings data, highlighting shifts in municipal bond demand.
Funds Recorded Inflows Amid an Elevated New-Issue Calendar
Fund Flows: During the week ending June 12, weekly reporting municipal mutual funds recorded $154 million of net inflows, according to Lipper. Long-term funds recorded $272 million of inflows, intermediate funds recorded $19 million of outflows and high-yield funds recorded $202 million of inflows. Short-term funds recorded $15 million of outflows. This week’s inflows led estimated year-to-date (YTD) net inflows higher to $11.8 billion.
Supply: The muni market recorded $9 billion of new-issue volume last week, down 45% from the prior week. YTD issuance of $217 billion is 42% higher than last year’s level, with tax-exempt issuance 46% higher and taxable issuance 7% higher year-over-year. This week’s calendar is expected to remain in line with last week at $9 billion. Largest deals include $1.5 billion New York Transportation Development Corporation (JFK Airport) and $1.1 billion Kentucky Public Energy Authority transactions.
This Week in Munis: Holders of Muni Debt
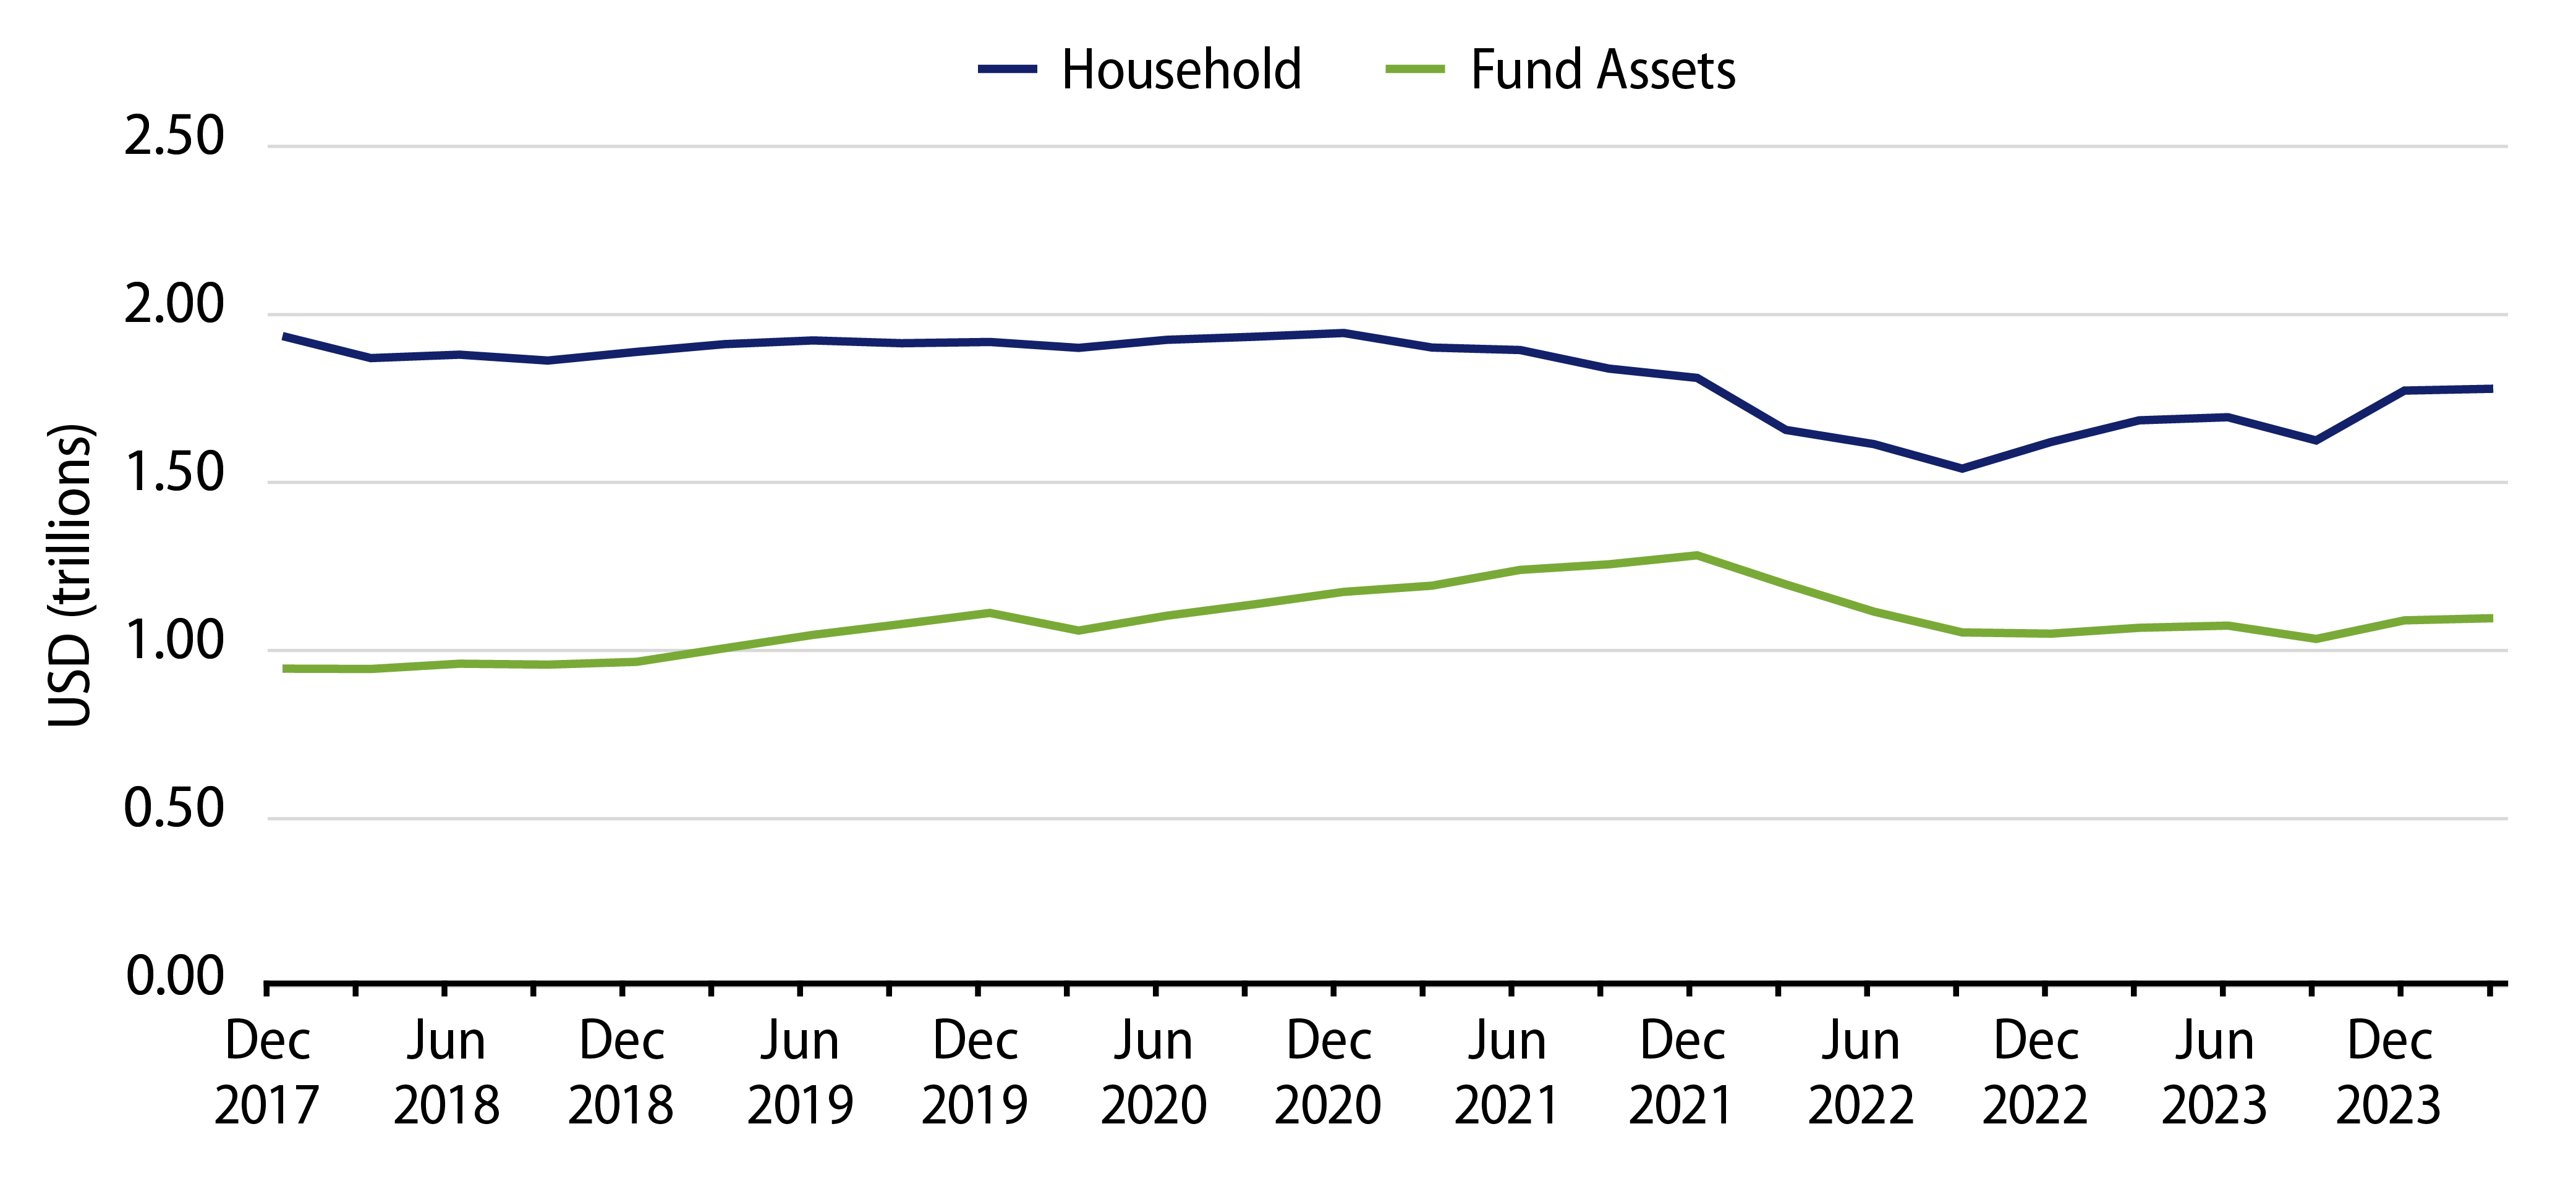
This month, the Fed released its updated municipal holders report for the first quarter of 2024. According to the data, the size of reported municipal bond holdings was relatively unchanged in the first quarter at $4 trillion. However, the market observed an uptick in the pace of retail holdings and a continued decline in institutional holdings.
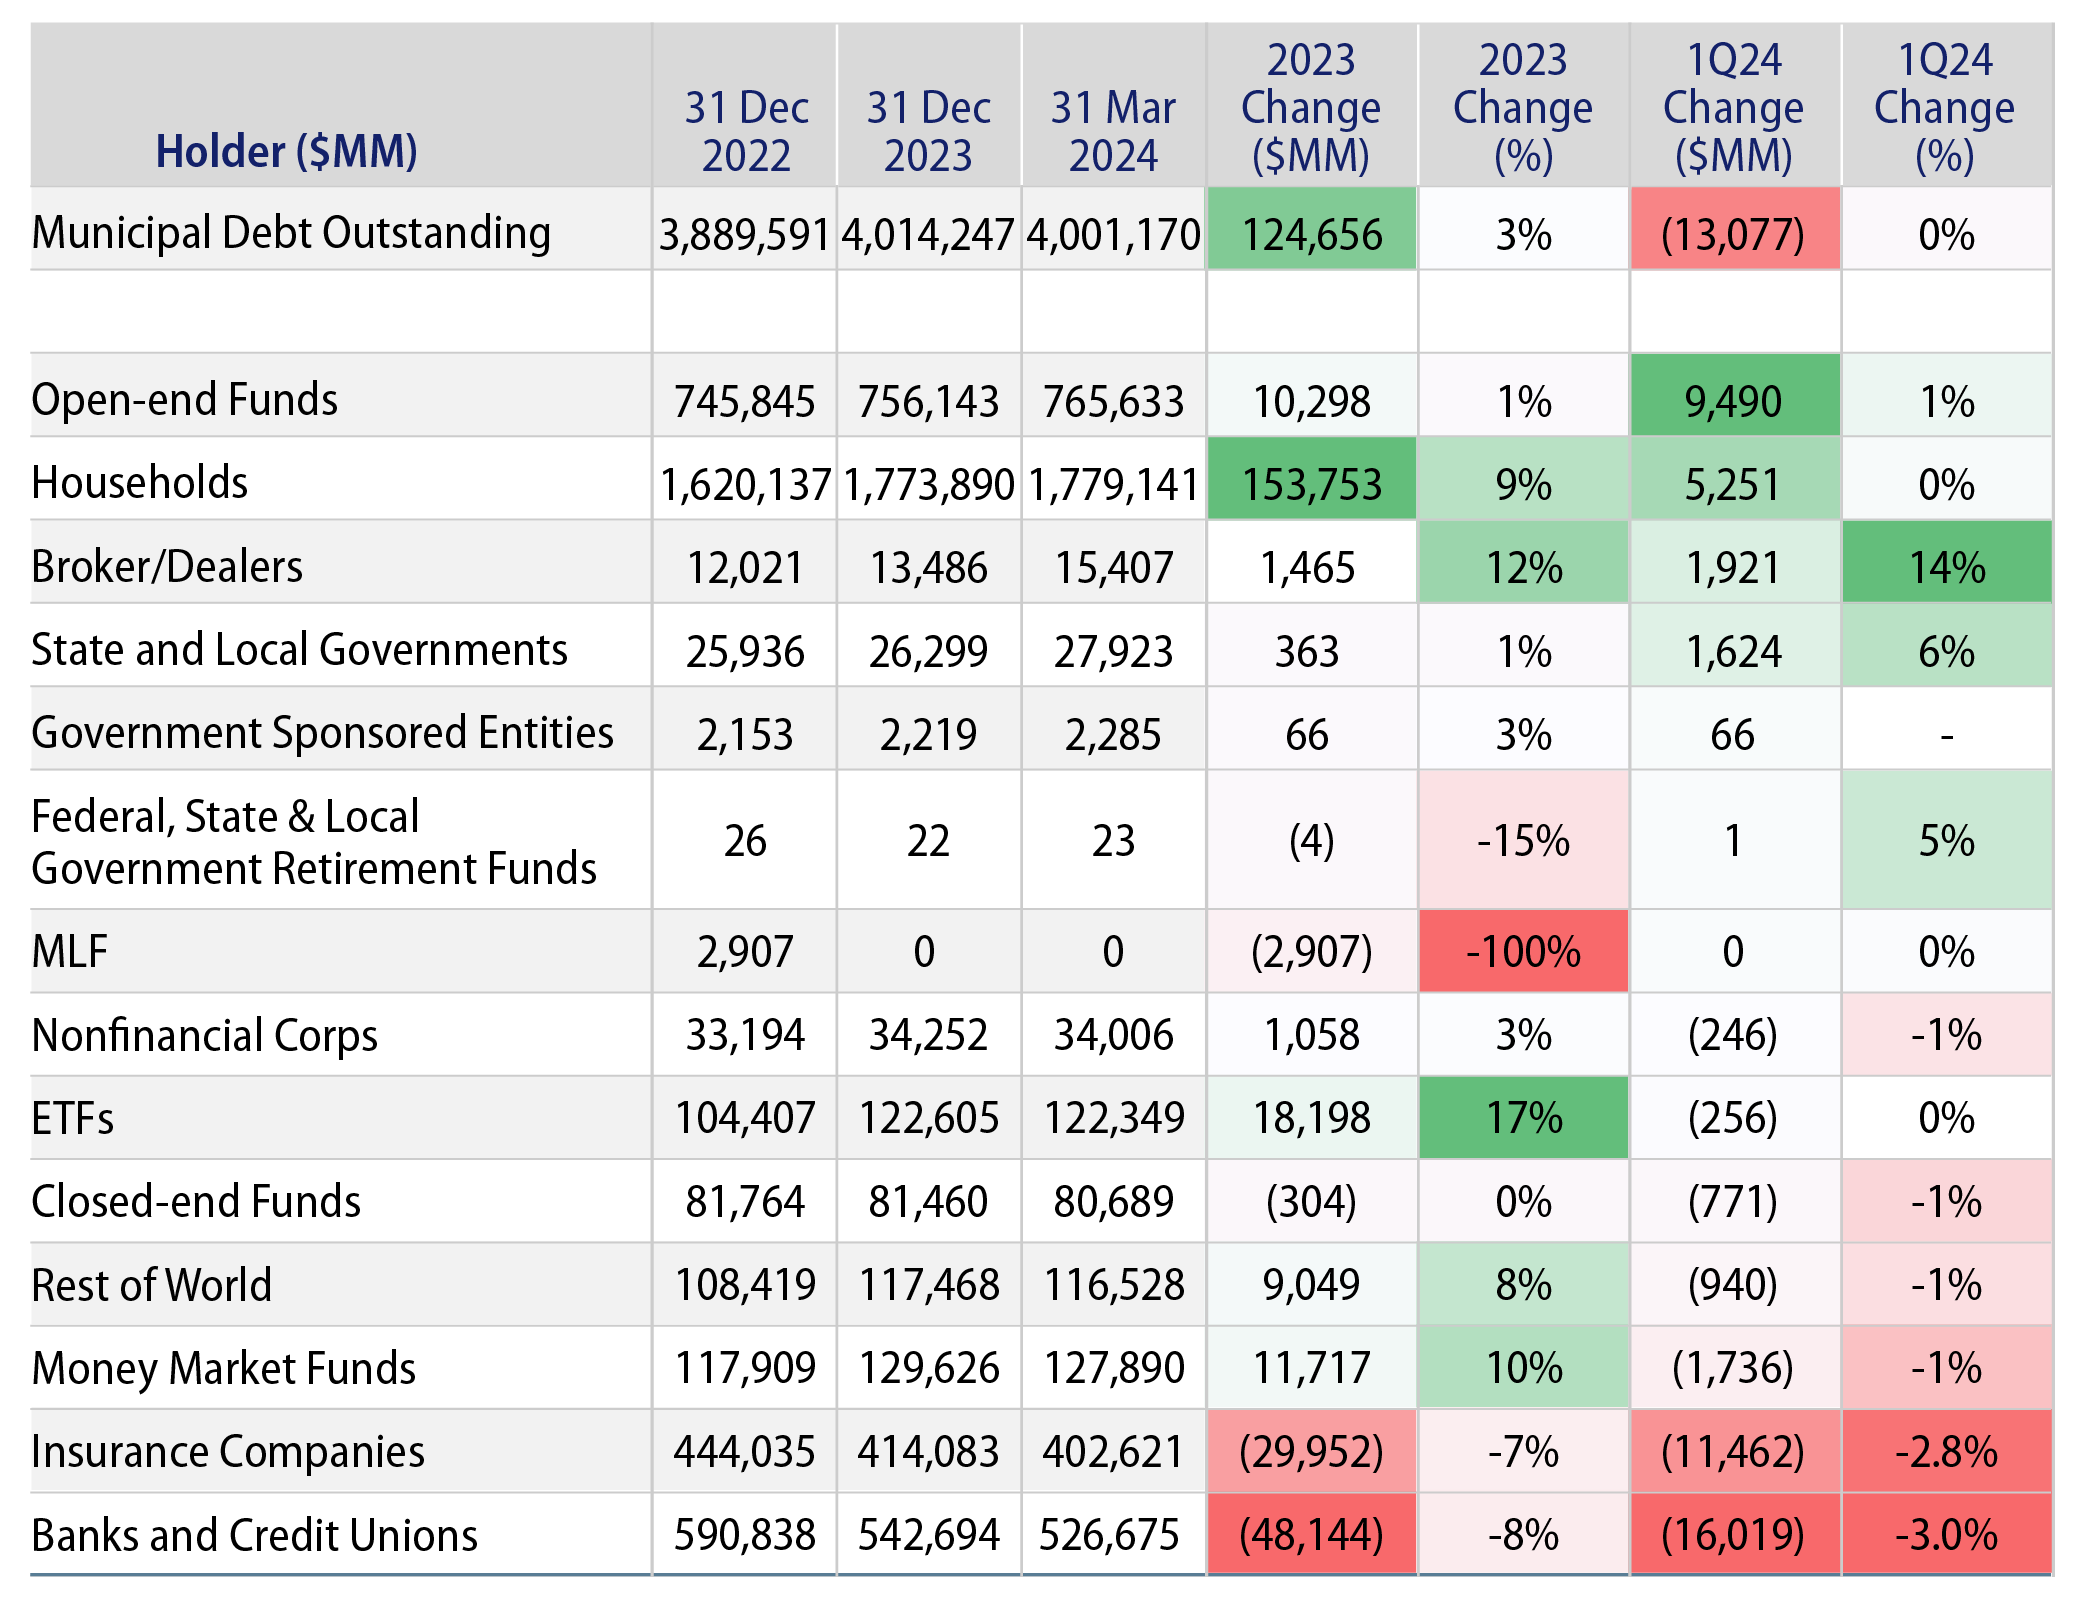
Major individual holders of municipal debt, including funds and household holdings, increased by $12 billion (0.5%) during the quarter. Open-end funds and household holdings increased by $9.5 billion and $5.3 billion, respectively. Meanwhile, money market funds, ETFs and closed-end fund assets declined by $1.7 billion, $256 million and $771 million, respectively. Western Asset attributes the growth in open-end funds and households to investor interest in returning to munis given the higher rate environment, as well as potential repositioning following tax swapping activity that took place in 2023.
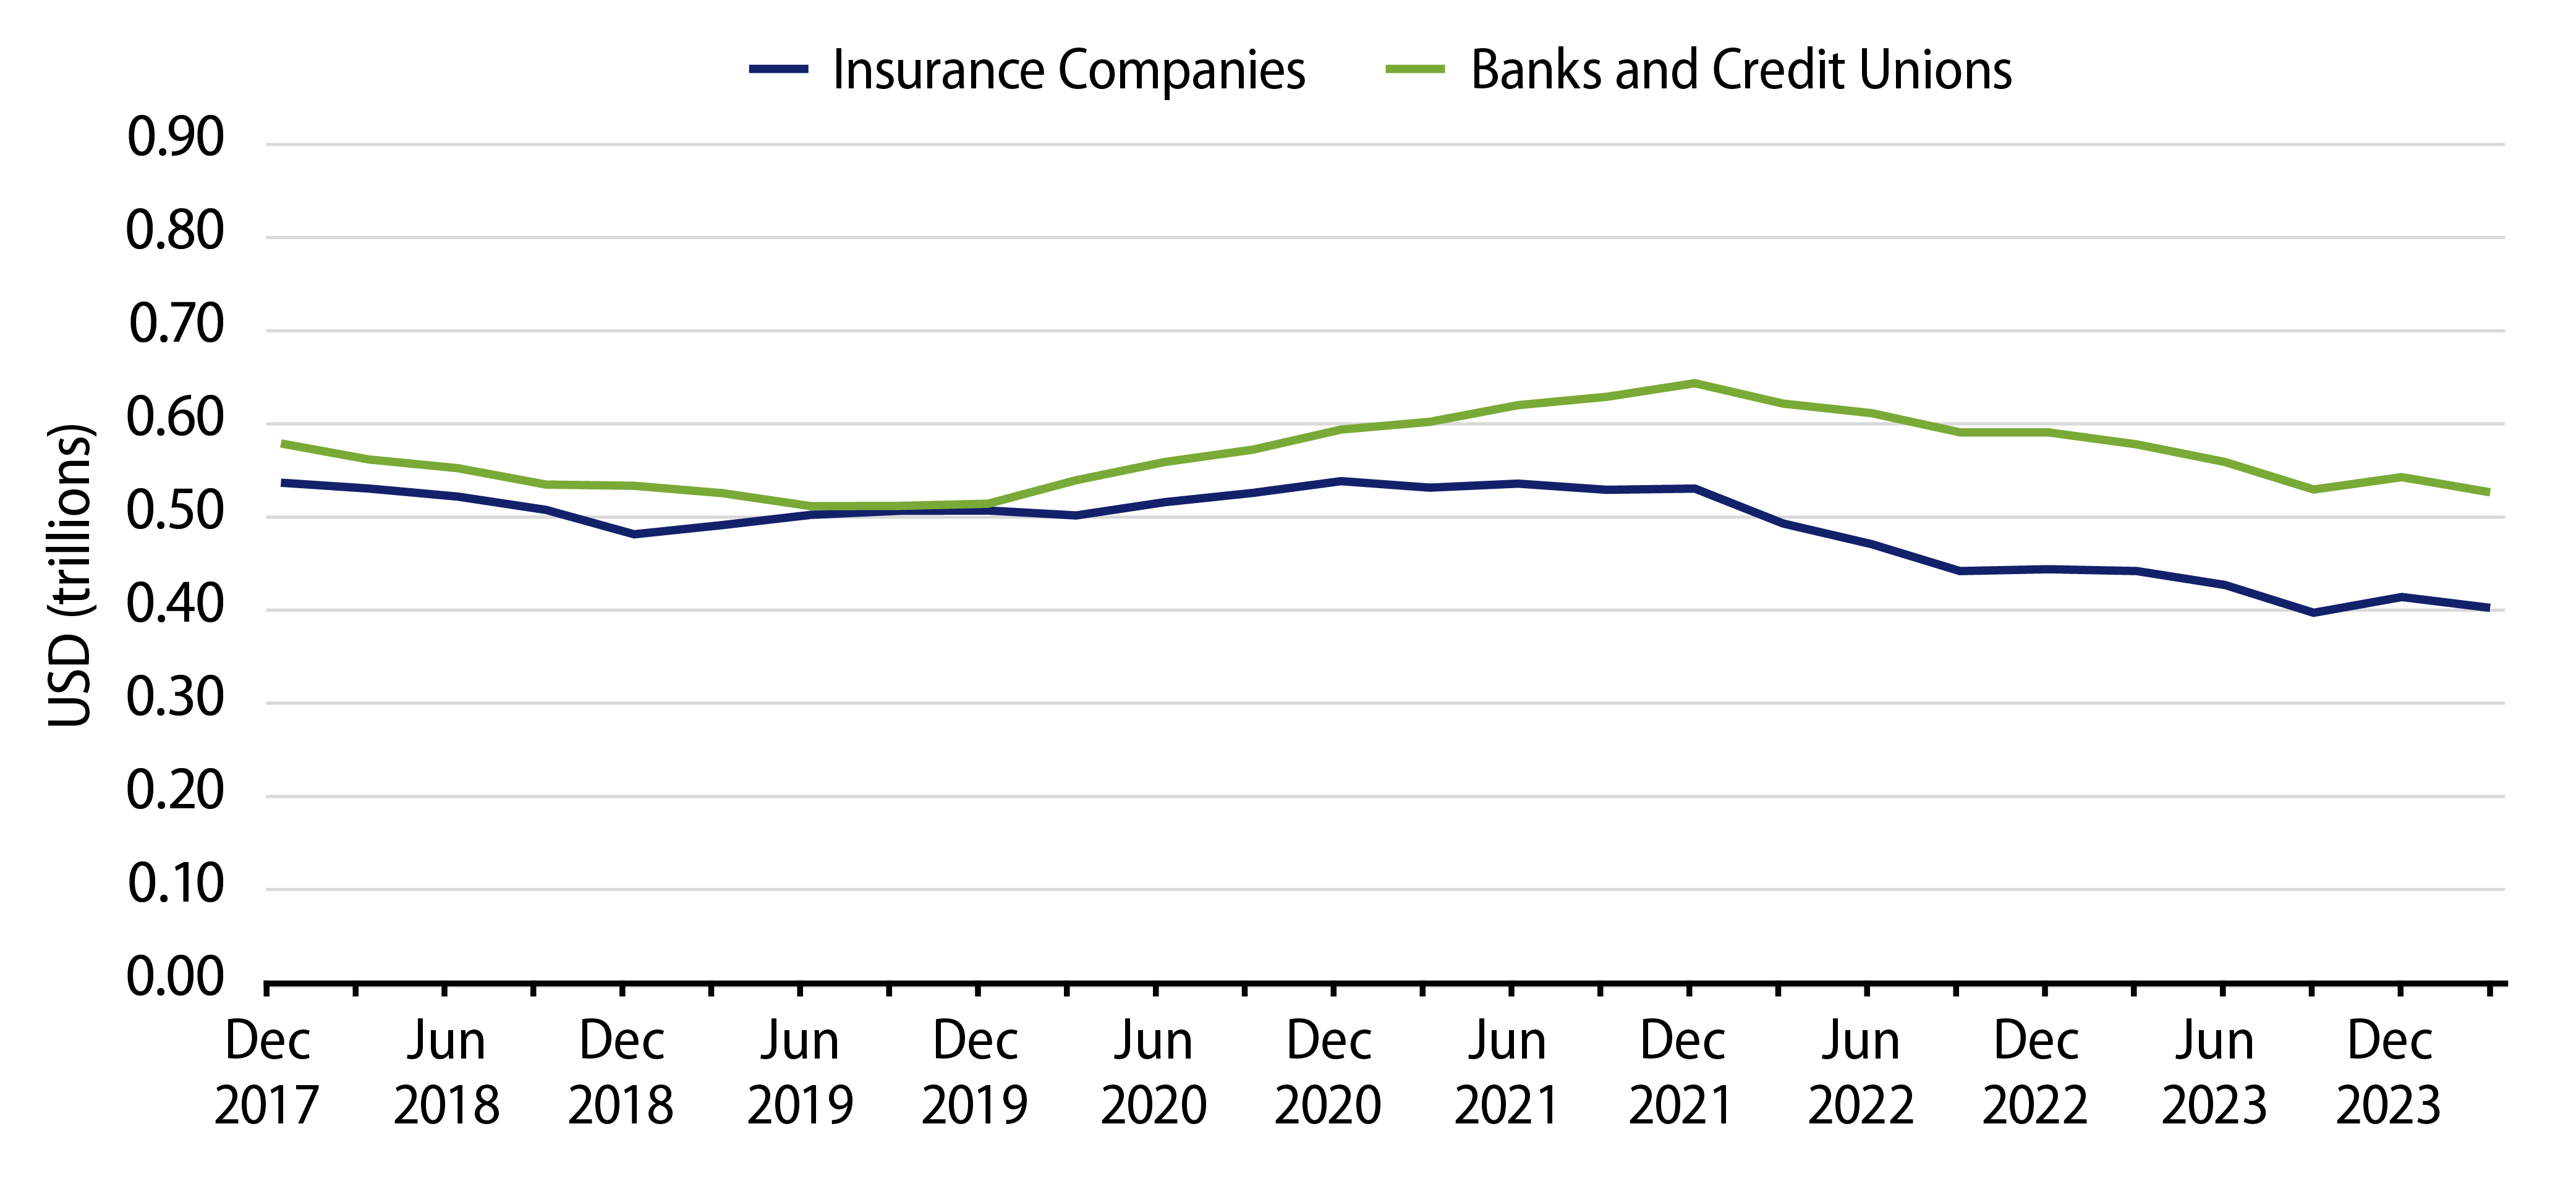
Institutional holders of municipal debt continued to report muni holding declines in the first quarter. Insurance companies reported an $11 billion decline (-3%) in municipal holdings in the first quarter of 2024, following a reported $30 billion decline (-7%) in 2023. Bank holdings decreased by $16 billion (-3%) in the first quarter, following the $48 billion decline (-8%) observed in 2023. The continued drag on institutional municipal holdings is attributable to lower corporate tax rates, increased tender/call activity of taxable municipal debt and bank balance sheet unwinds of longer-duration municipal assets.
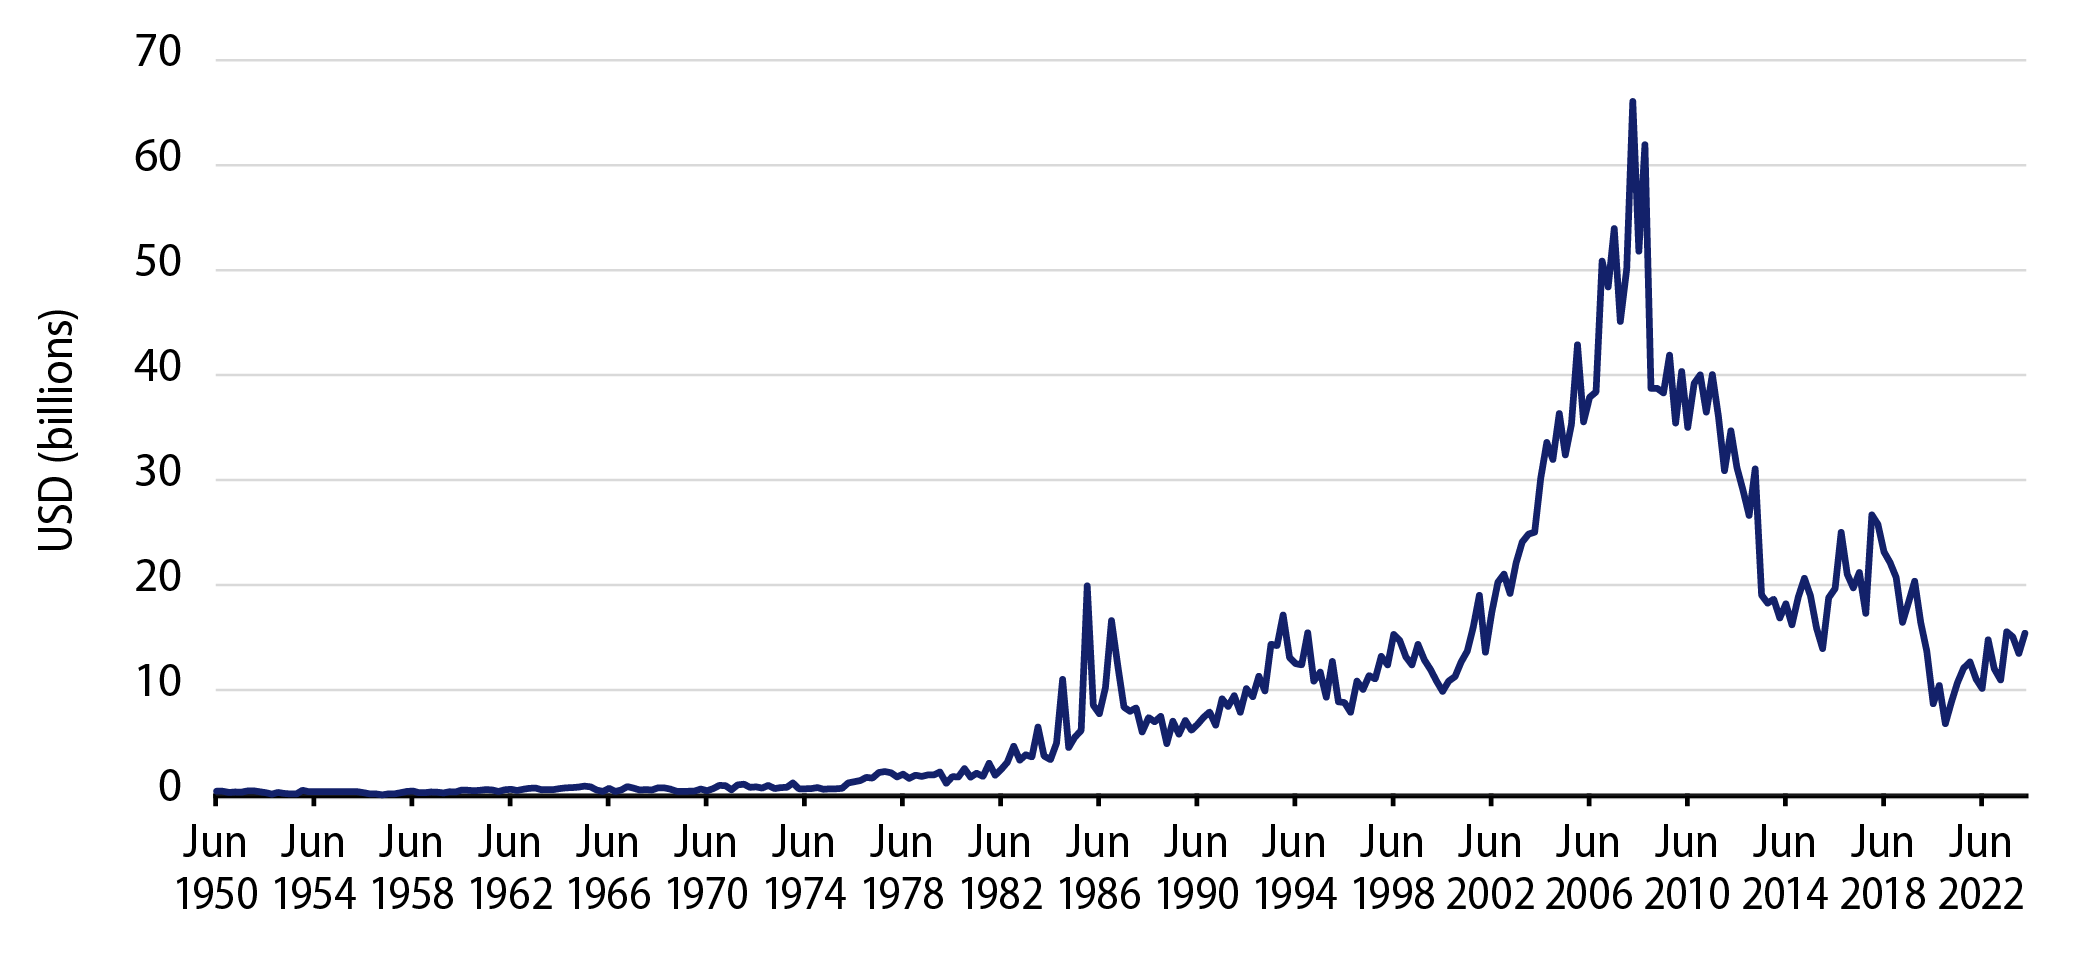
Following years of declining broker/dealer holdings, inventories increased from a low of $6.8 billion in 2020 to $15.4 billion at the end of the first quarter as municipal bond supply has increased this year. While still historically low, the improvement in inventories represents a welcome signal for dealer counterparts to be willing to provide more liquidity to the municipal market.
The Fed data highlights positive signs for municipal demand, as the core retail buyer has signaled the willingness to re-enter the market this year. However, a more concentrated asset base, given the growth in assets held by individuals at the expense of institutions, can lead to potential volatility amid shifts in market sentiment. Western Asset believes active managers that can navigate liquidity amid bouts of volatility stand to benefit from these changing market dynamics.
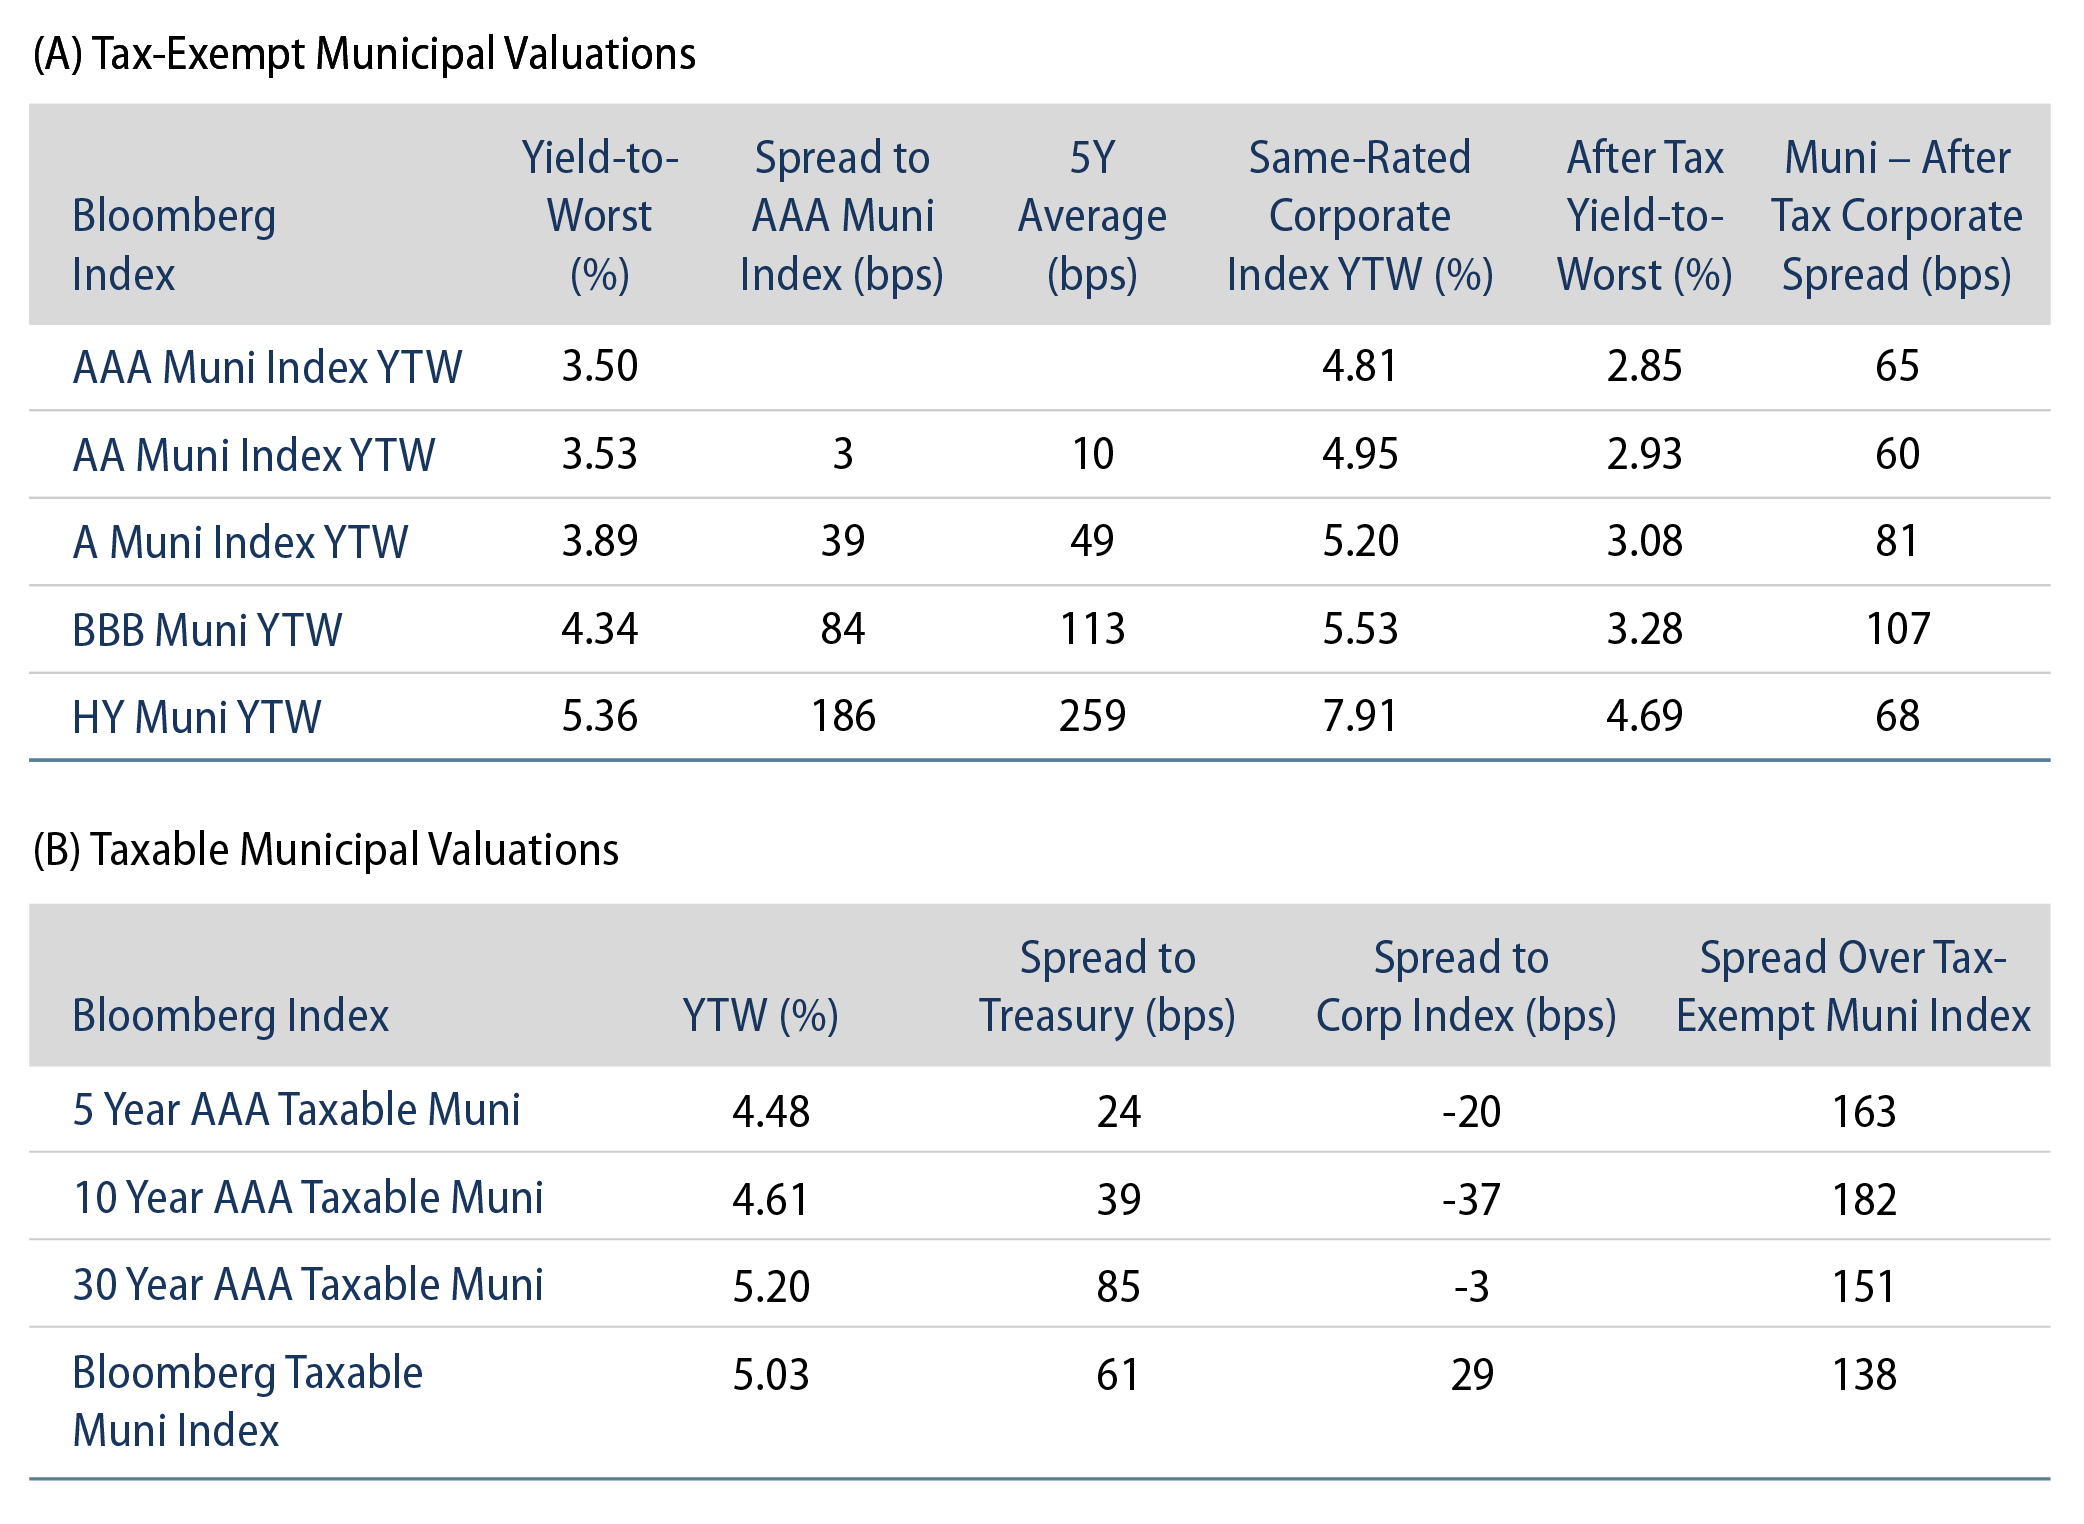
Municipal Credit Curves and Relative Value
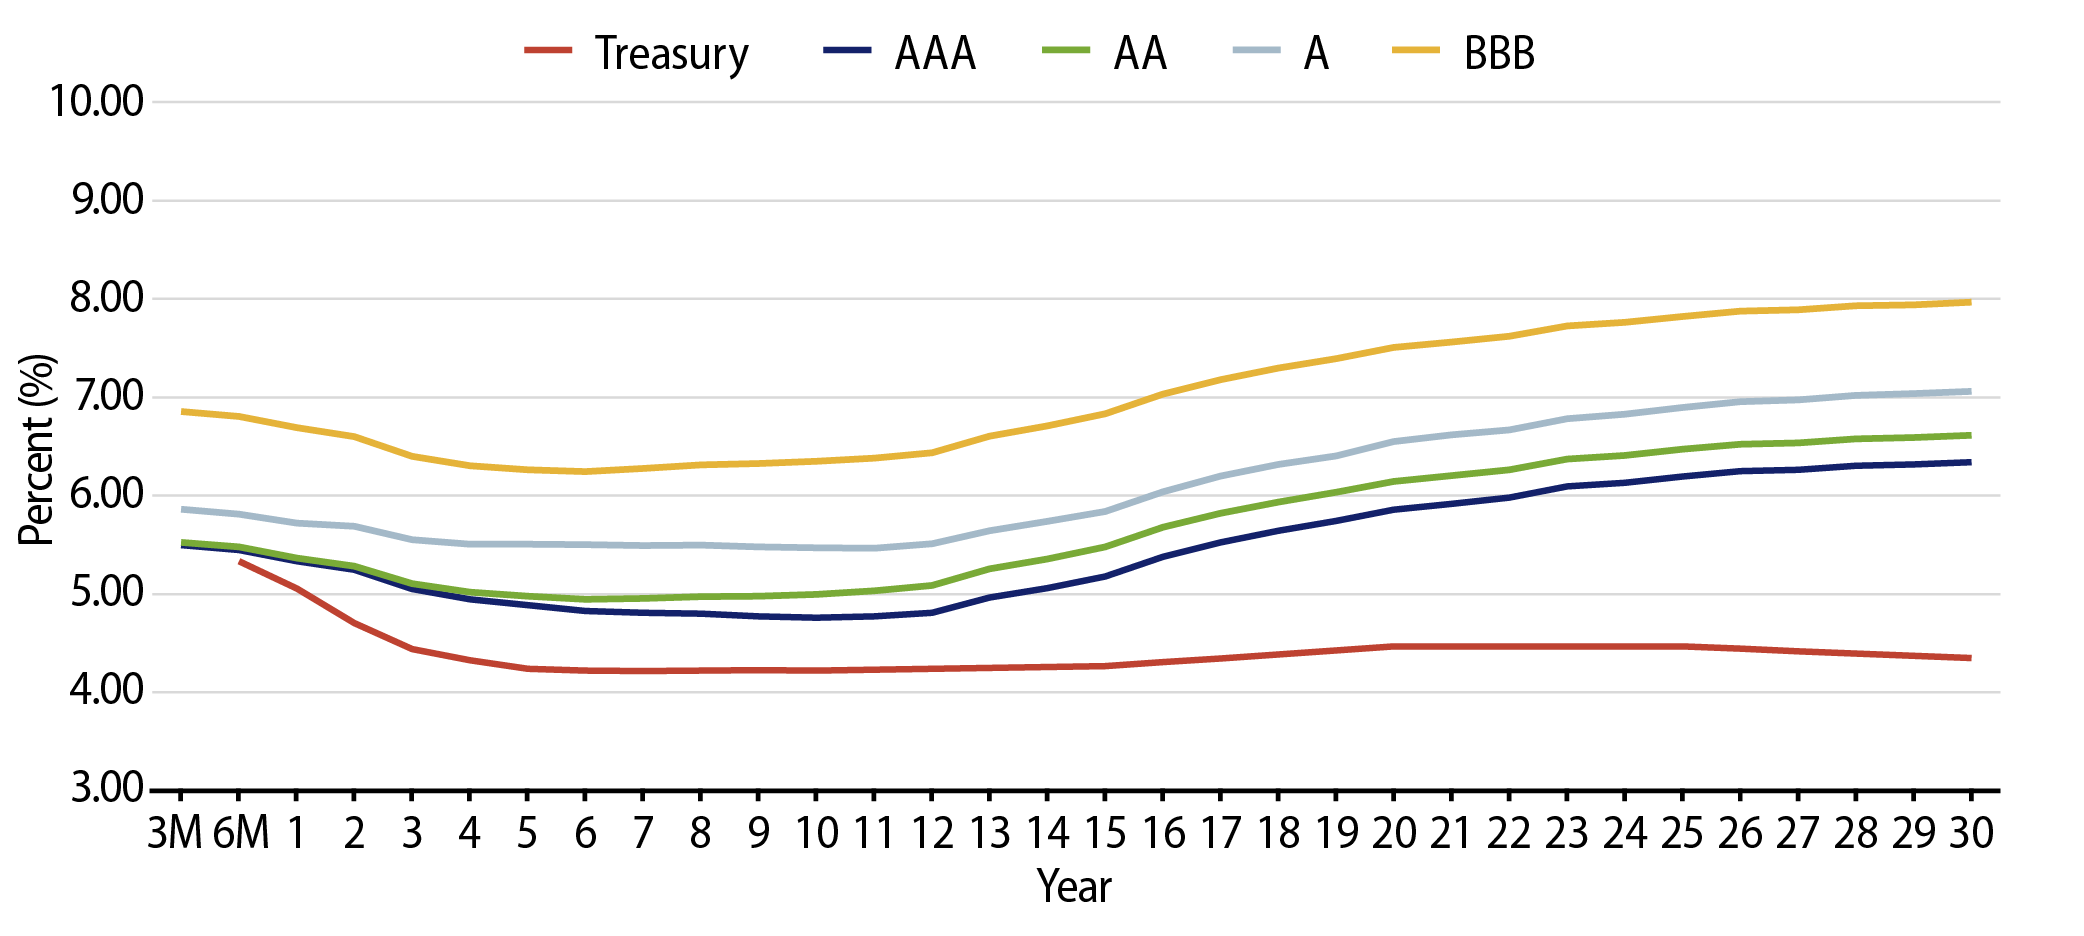
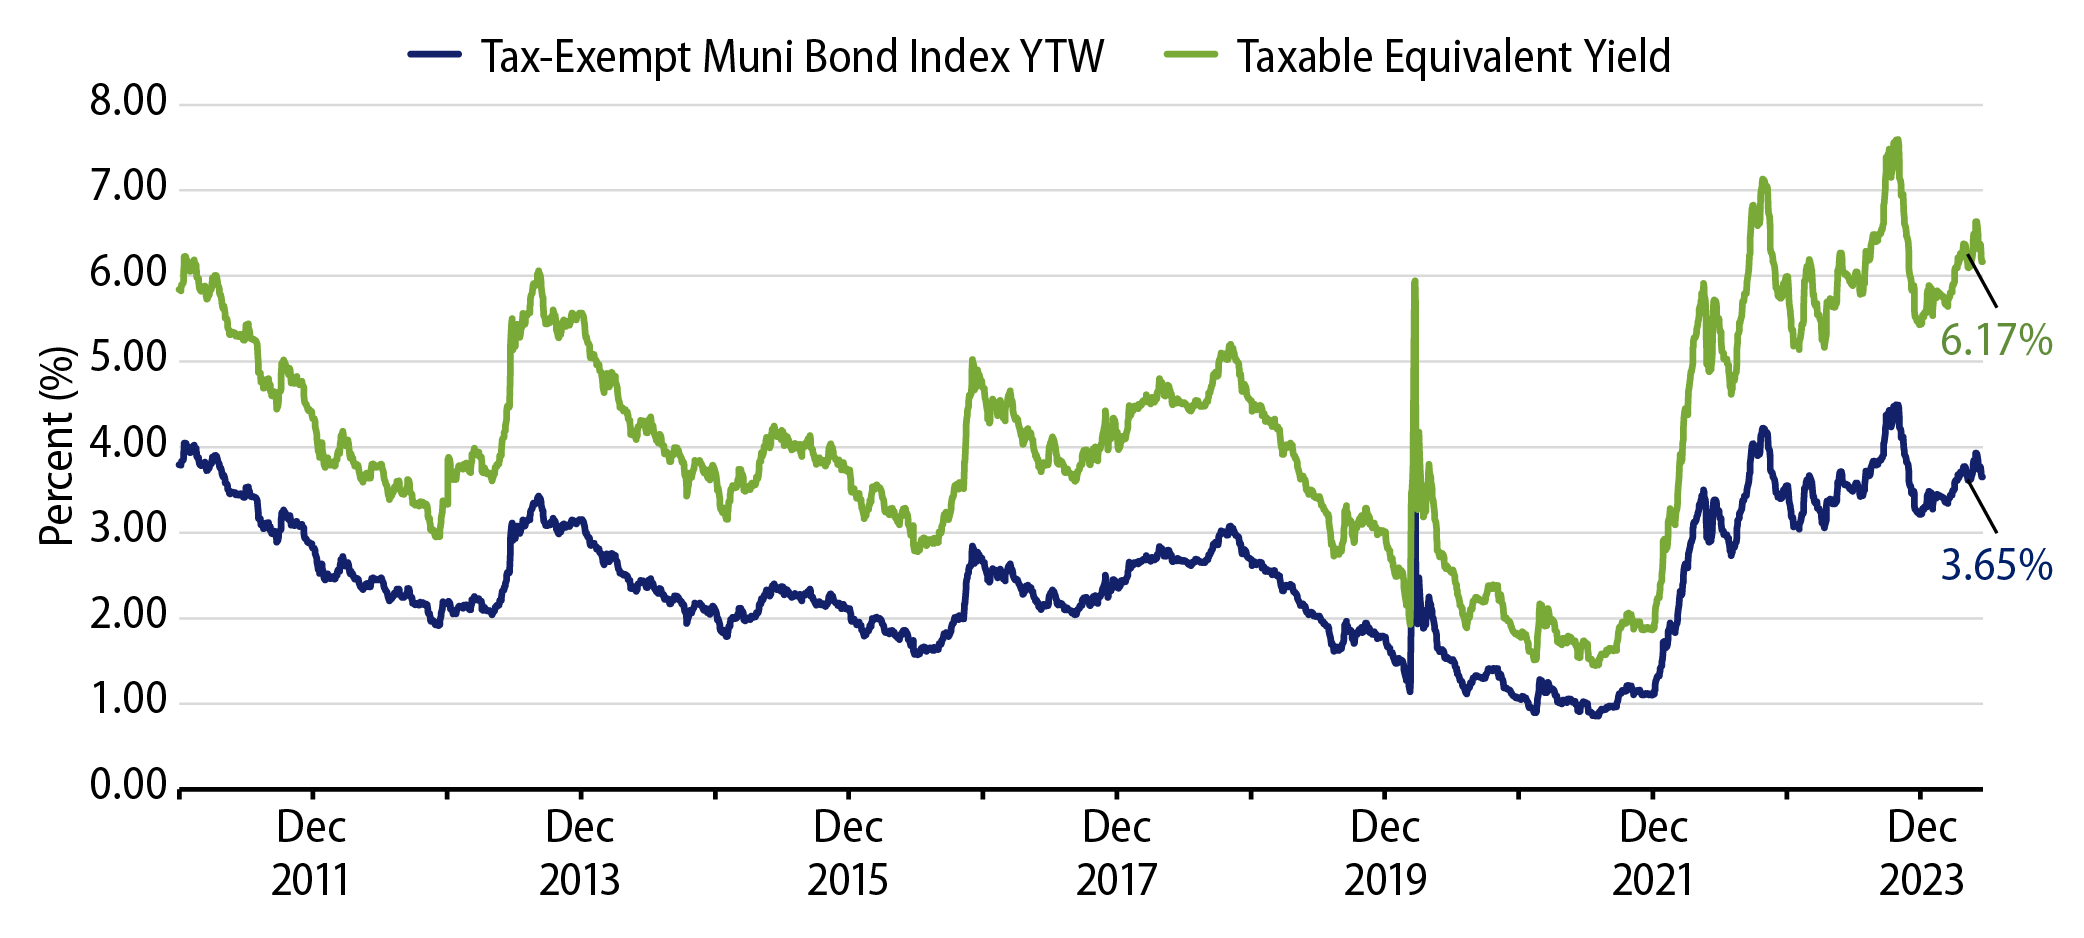
Theme #1: Municipal taxable-equivalent yields are above decade averages.
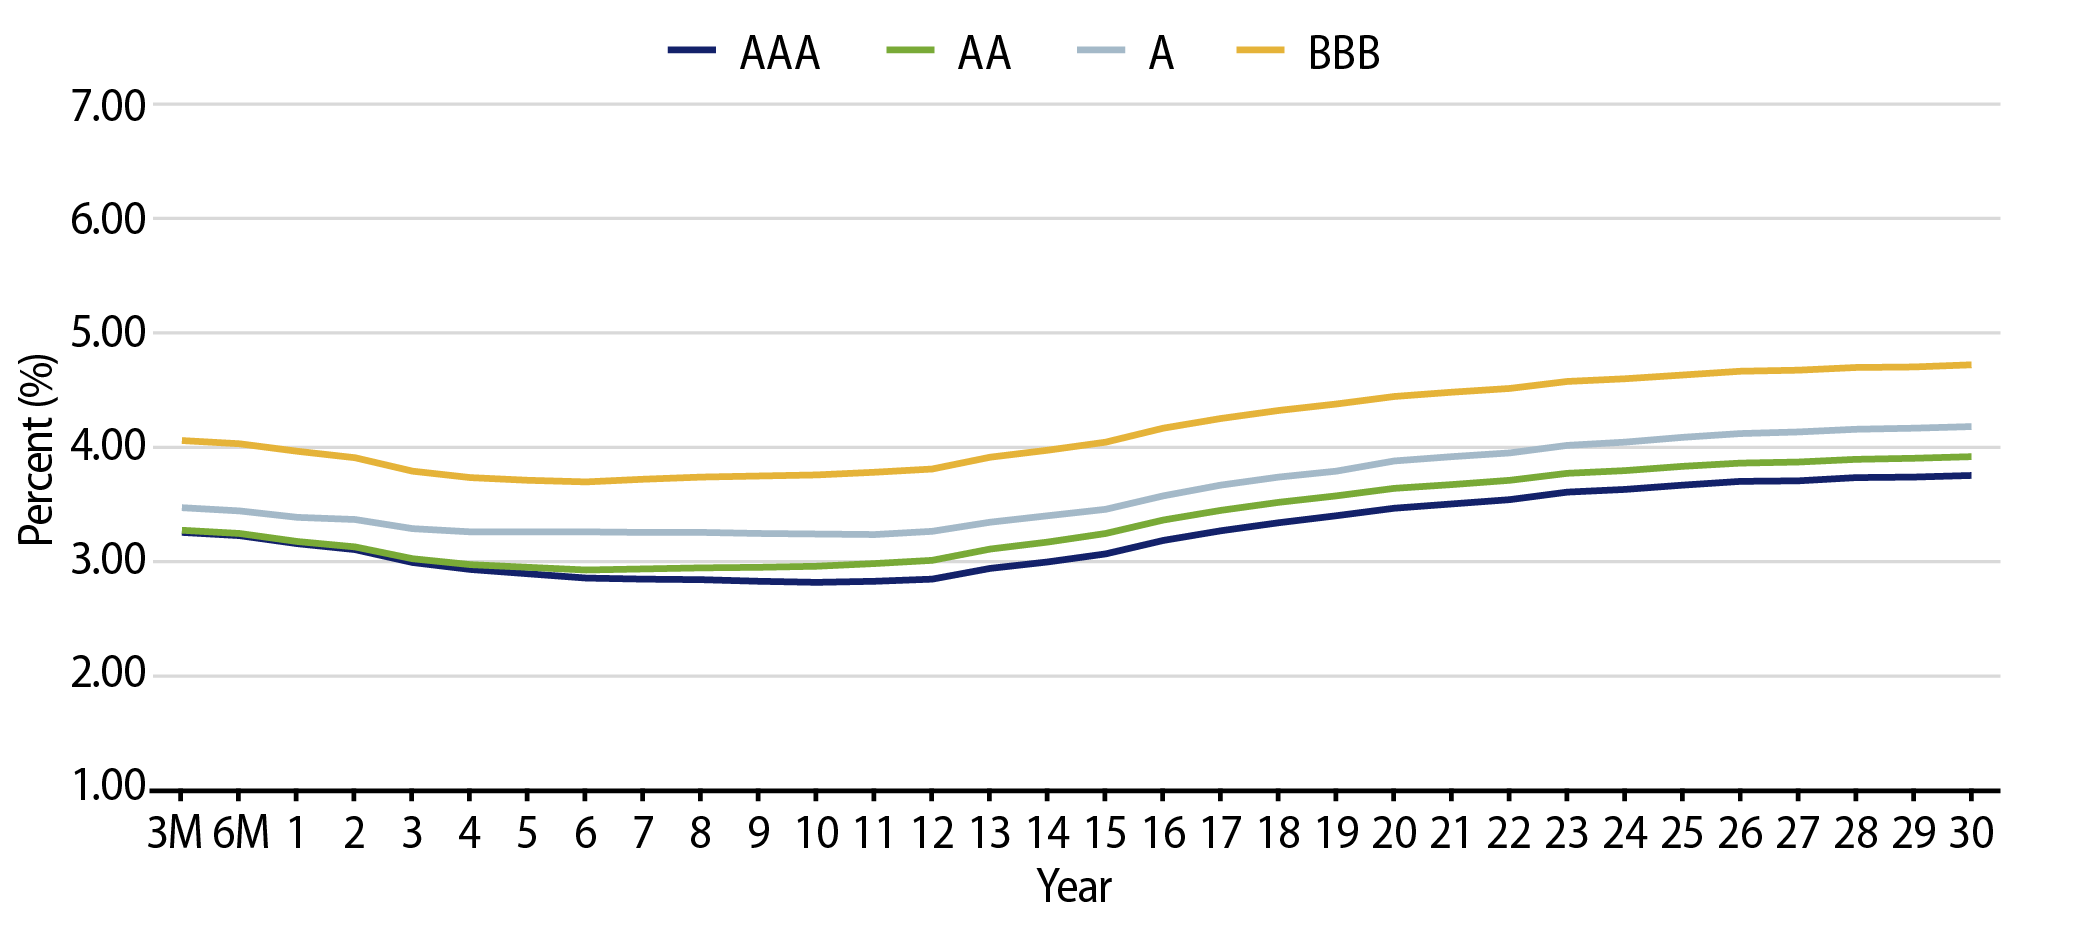
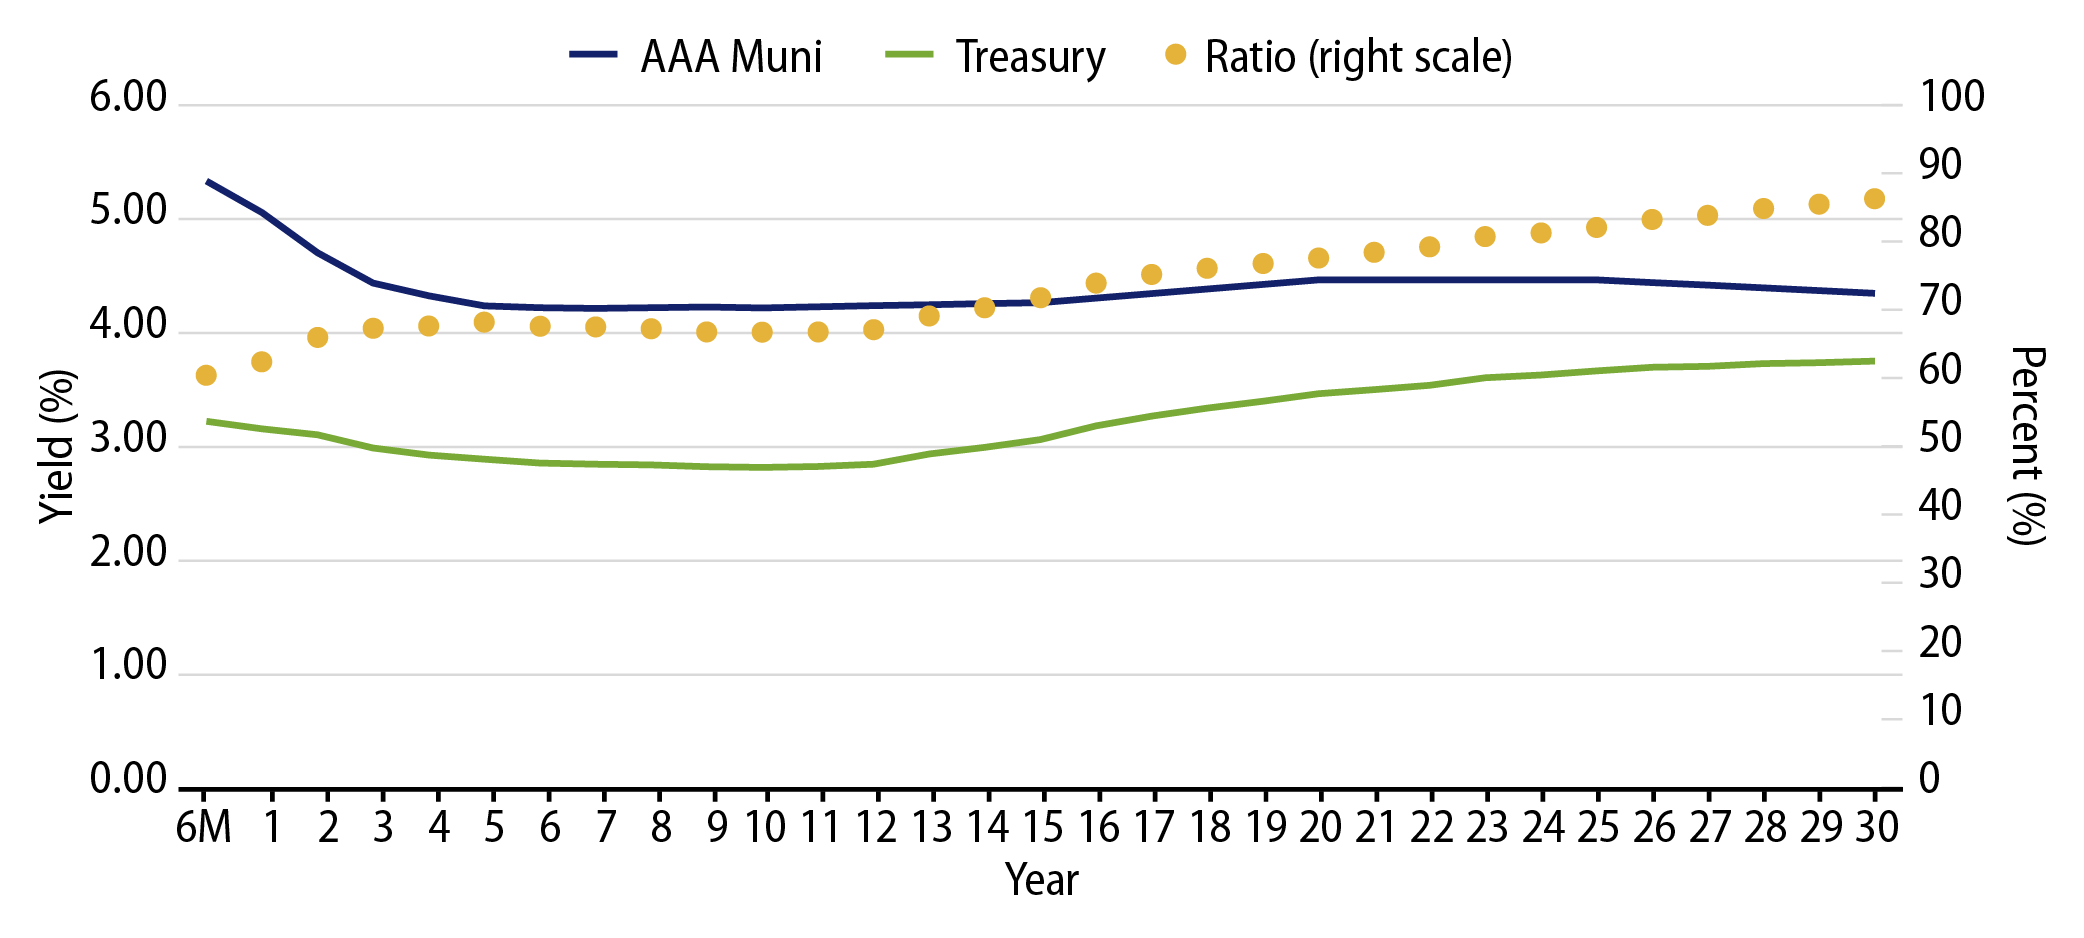
Theme #2: The muni yield curve has disinverted in recent weeks.
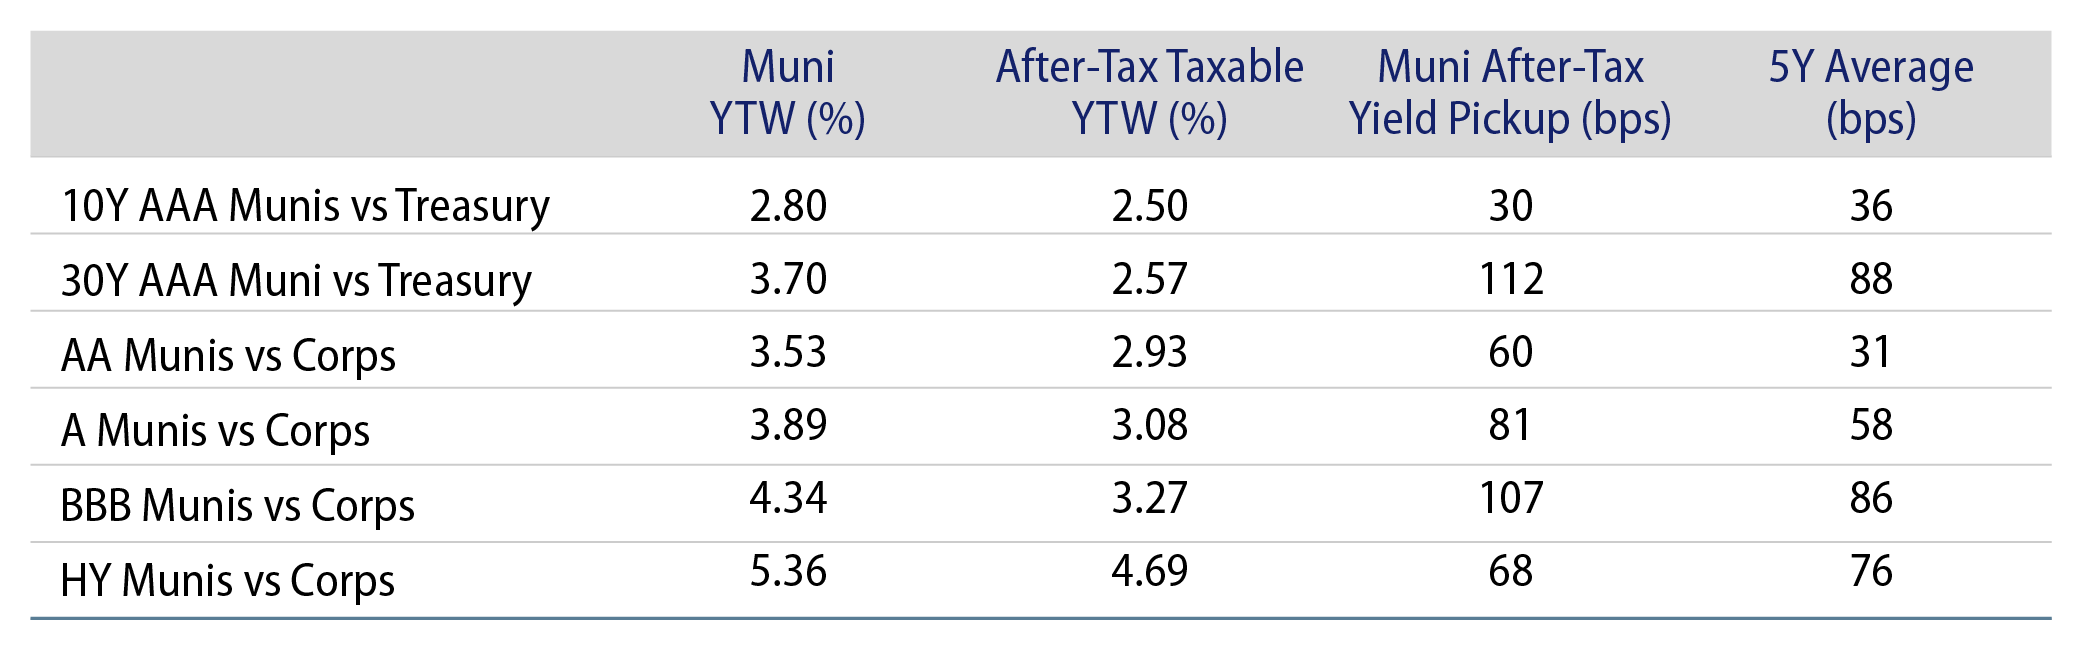
Theme #3: Munis offer attractive after-tax yield pickup versus Treasuries and corporate credit.