skip navigation
Blog

Stay up to date on timely topics and market events. Subscribe to our Blog now.

MARKETS
12 March 2024

Weekly Municipal Monitor—Fed Pivot

By Sam Weitzman

Stay up to date on timely topics and market events. Subscribe to our Blog now.

Municipals Posted Positive Returns Last Week

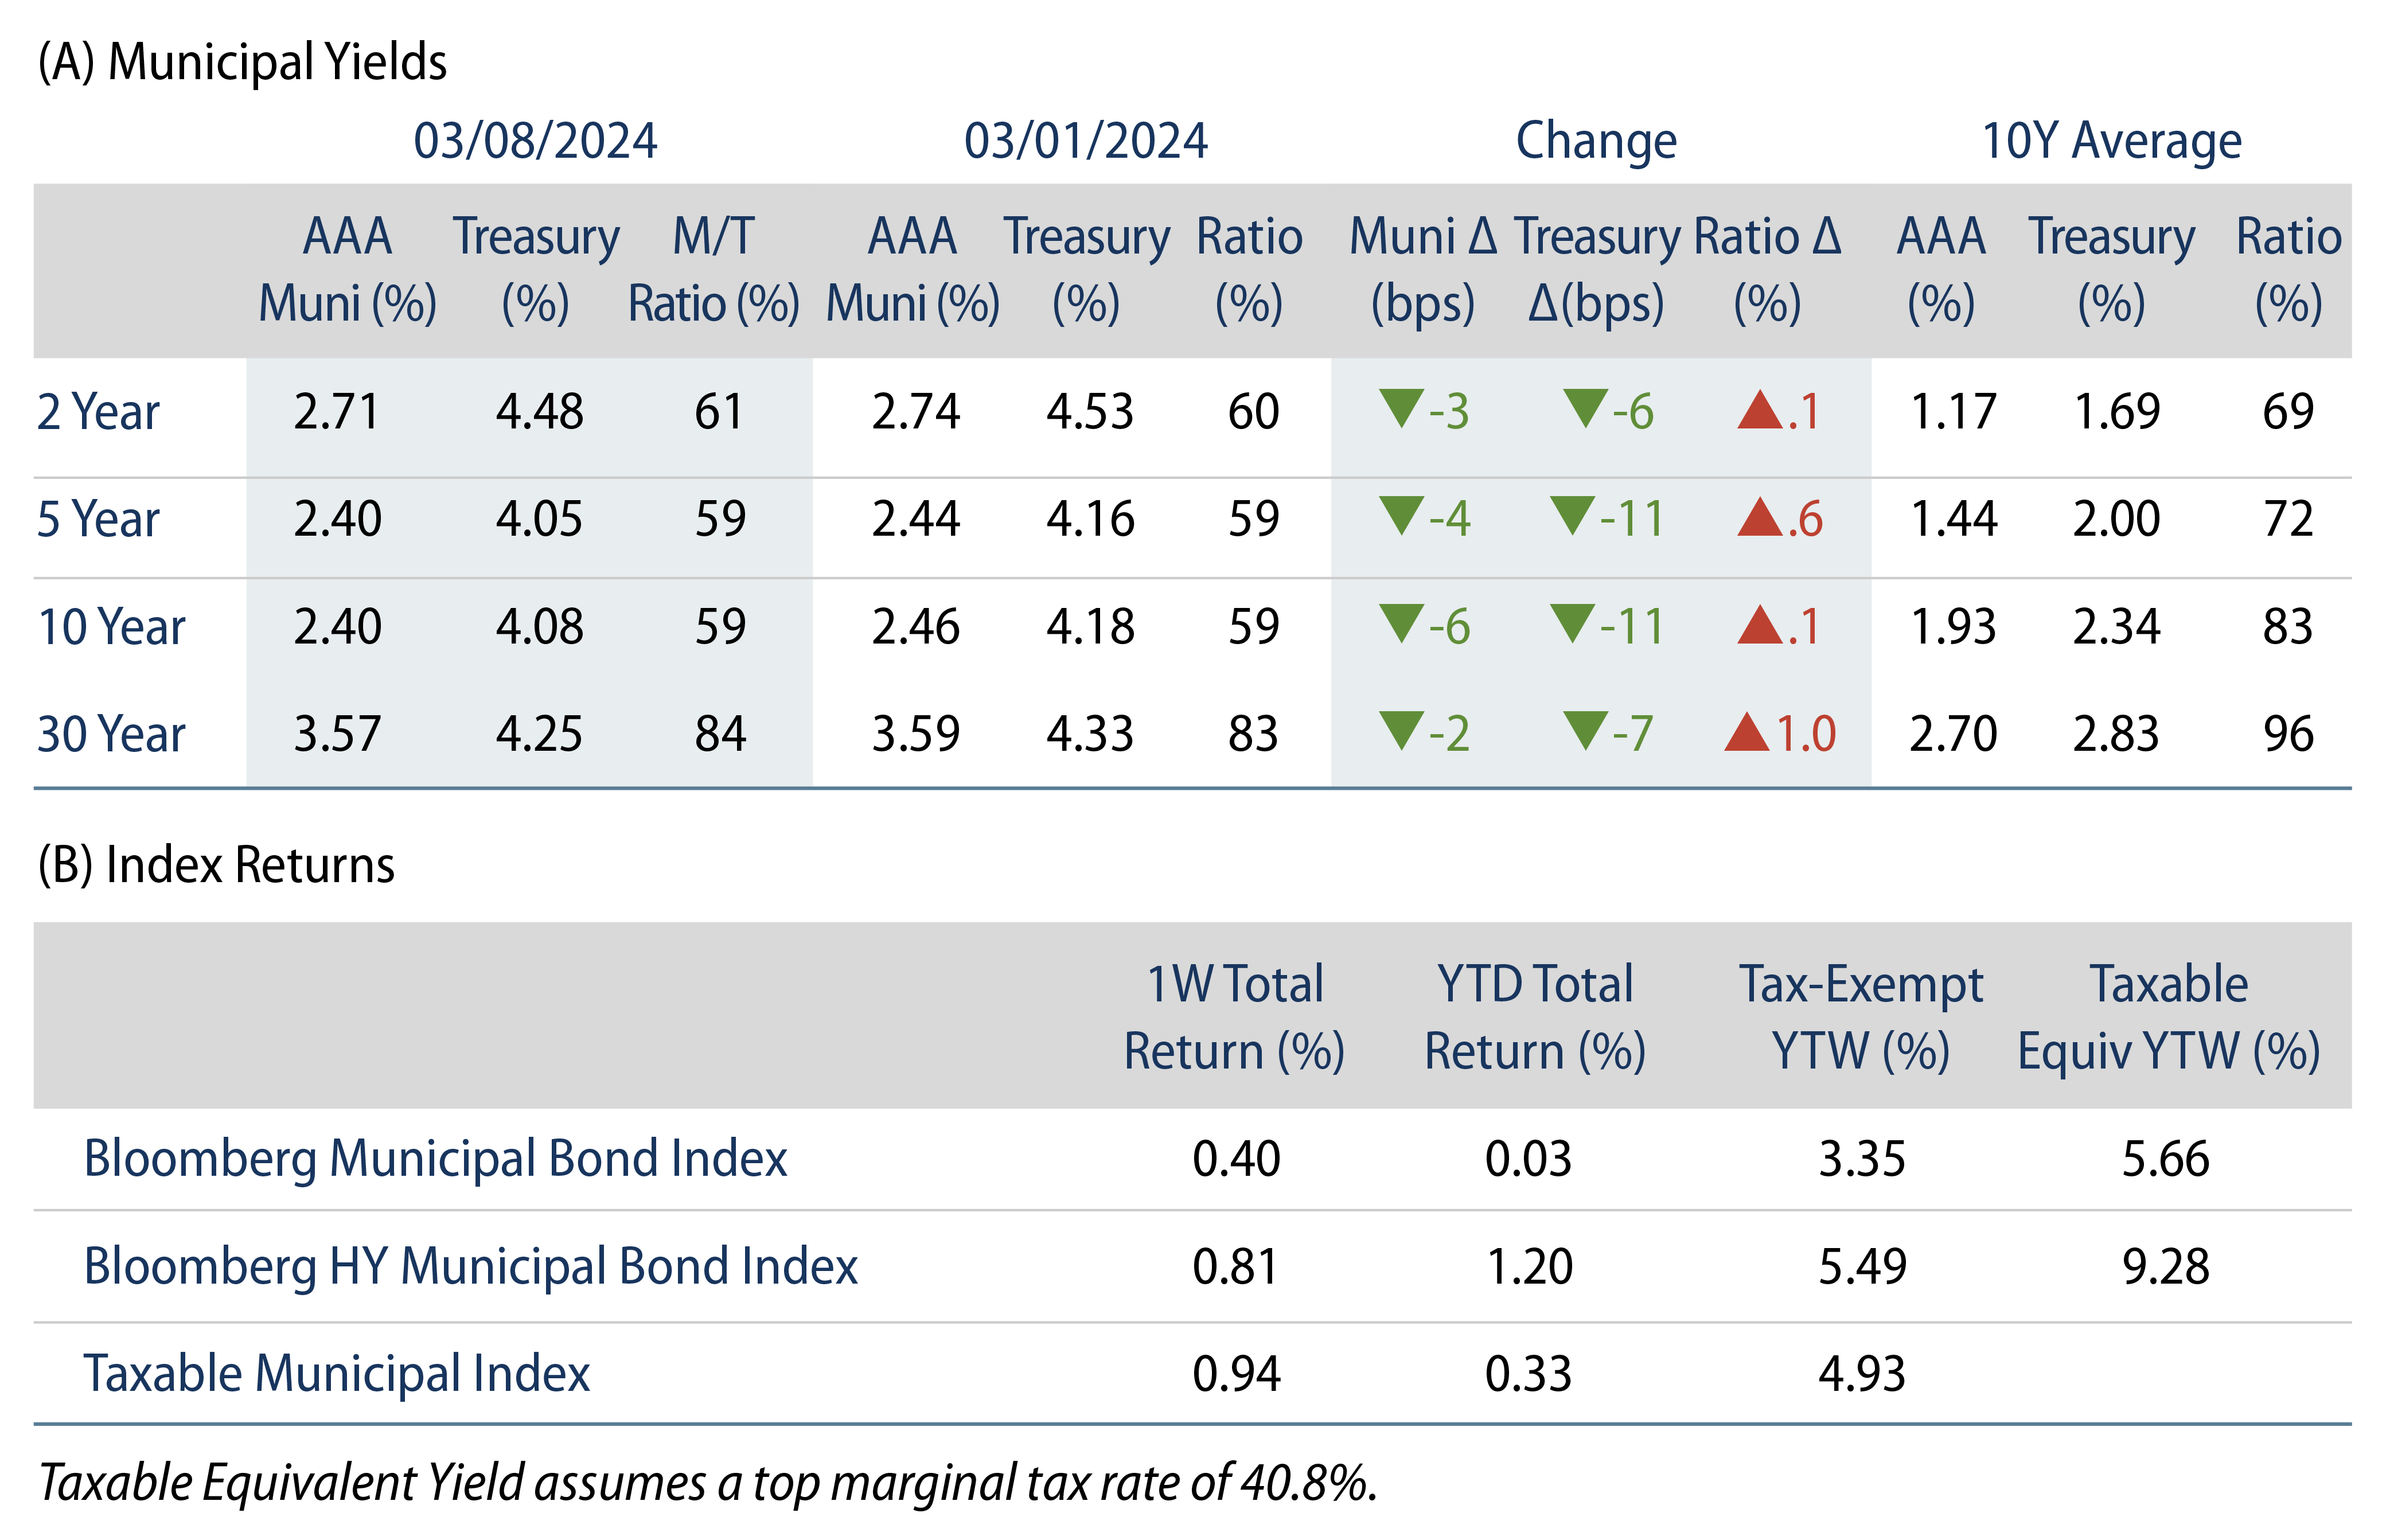
Munis posted positive returns and modestly underperformed the Treasury rally as yields moved lower on weaker economic data earlier in the week, ultimately culminating with significant downward payroll revisions that offset the stronger-than-expected February payrolls data. High-grade muni yields moved lower across the curve. Muni supply and demand trends moved higher during the week. The Bloomberg Municipal Index returned 0.40% during the week, the High Yield Muni Index returned 0.81% and the Taxable Muni Index returned 0.94%. This week we highlight historical performance prior to and following historical fed funds rate cuts.

Technicals Continued to Shift with Higher Supply and Demand

Fund Flows: During the week ending March 6, weekly reporting municipal mutual funds recorded $869 million of net inflows, according to Lipper. Long-term funds recorded $893 million of inflows, intermediate funds recorded $113 million of inflows and high-yield funds recorded $436 million of inflows. Short-term funds posted outflows of $65 million. Last week’s inflows lead estimated year-to-date (YTD) net inflows higher to $5.5 billion.

Supply: The muni market recorded $9.5 billion of new-issue volume last week, up 13% from the prior week. YTD issuance of $73 billion is 55% higher from last year’s level, with tax-exempt issuance 58% higher and taxable issuance 28% higher year-over-year. This week’s calendar is expected to increase to increase to $12 billion. Largest deals include $3 billion Dormitory Authority of the State of New York Personal Income Tax and $1.7 billion Commonspirit Health transactions.

This Week in Munis: Fed Pivot

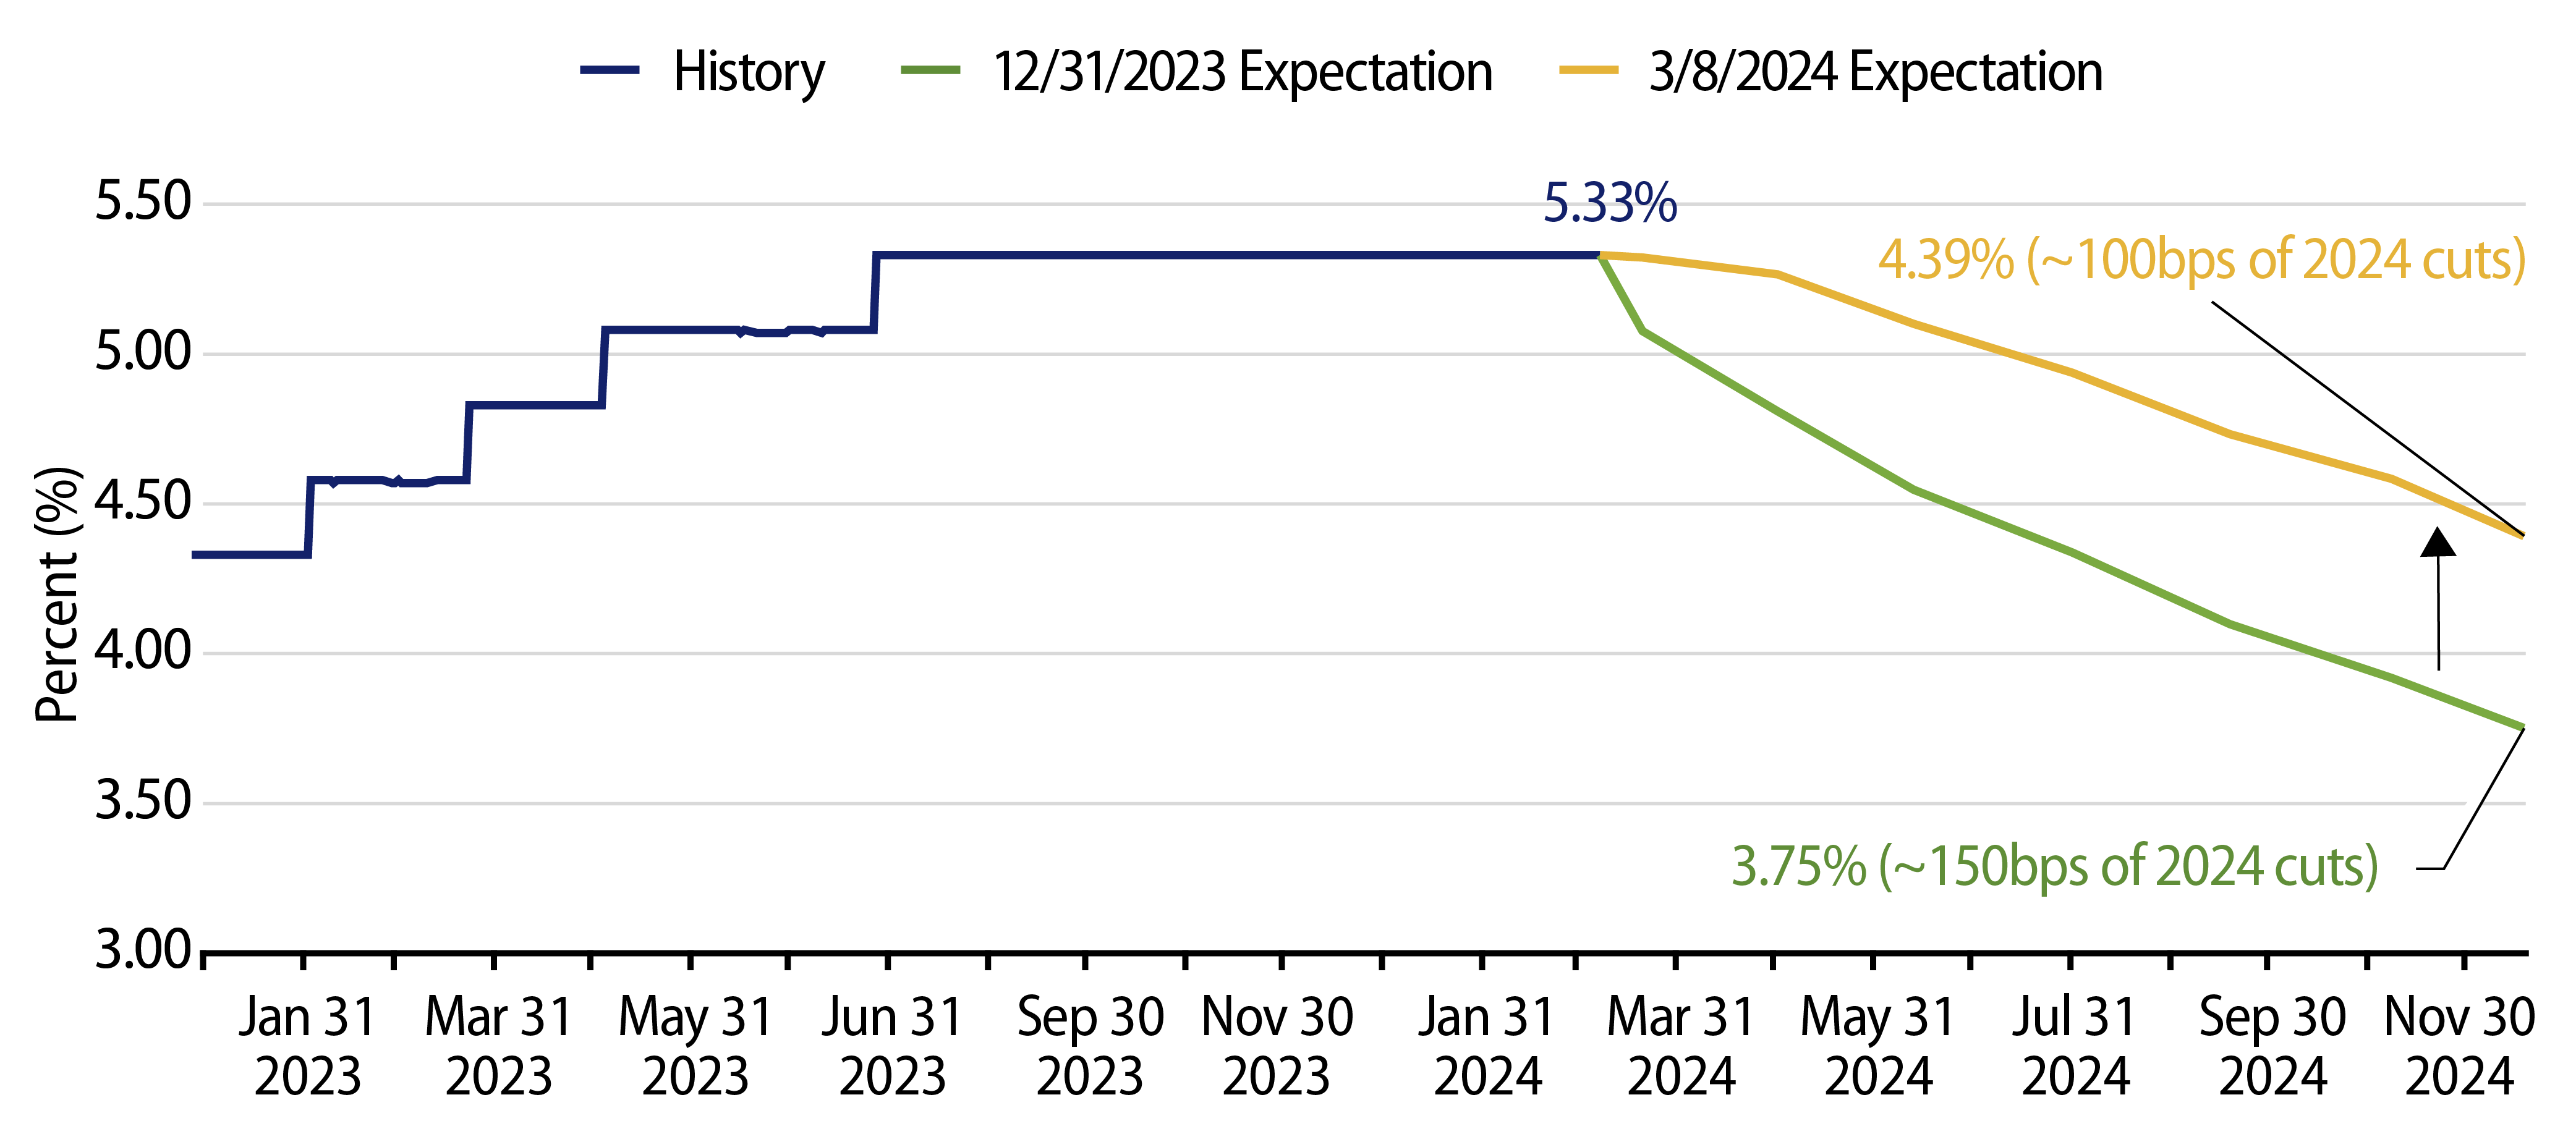
As inflation moderated at the end of 2023 and the Federal Reserve (Fed) telegraphed the end of its hiking cycle, market expectations implied as many as 150 basis points (bps) (1.50%) of 2024 rate cuts at year-end. Economic data has since remained resilient YTD, and 2024 expected rate cuts were reduced to 100 bps as of last week, leading to additional uncertainty around the timing and magnitude of cuts this year.

Exhibit 1: Fed Funds Rate Market Implied Probability
Explore Fed Funds Rate Market Implied Probability
Source: Western Asset, Bloomberg. Fed Target (middle of) and Implied Rate. As of 08 Mar 24. Select the image to expand the view.

Resilient economic data and a lower probability of a near-term rate cut could lead potential muni investors to wait for the Fed to cut rates before investing in the asset class. However, history has highlighted that those who wait until or after the rate cut could experience less favorable outcomes than those who have entered the market ahead of the cut. Considering the past eight initial rate cuts, Bloomberg Municipal Bond Index 12-month total returns averaged 7.24% in the six months ahead of cuts, while averaging just 3.23% in the six months that followed the initial cut.

Exhibit 2: 12-Month Bloomberg Muni Bond Index Performance Before, At and After First Cuts
Explore 12-Month Bloomberg Muni Bond Index Performance Before, At and After First Cuts
Source: Western Asset, Bloomberg Municipal Bond Index. One-year forward returns within six months of the last eight initial fed funds rate cuts (1/16/1981, 10/2/1984, 6/1/1989, 7/6/1995, 9/29/1998, 1/3/2001, 9/18/2007, 8/1/2019). “ff”: following Fed rate cuts. As of 08 Mar 24. Select the image to expand the view.

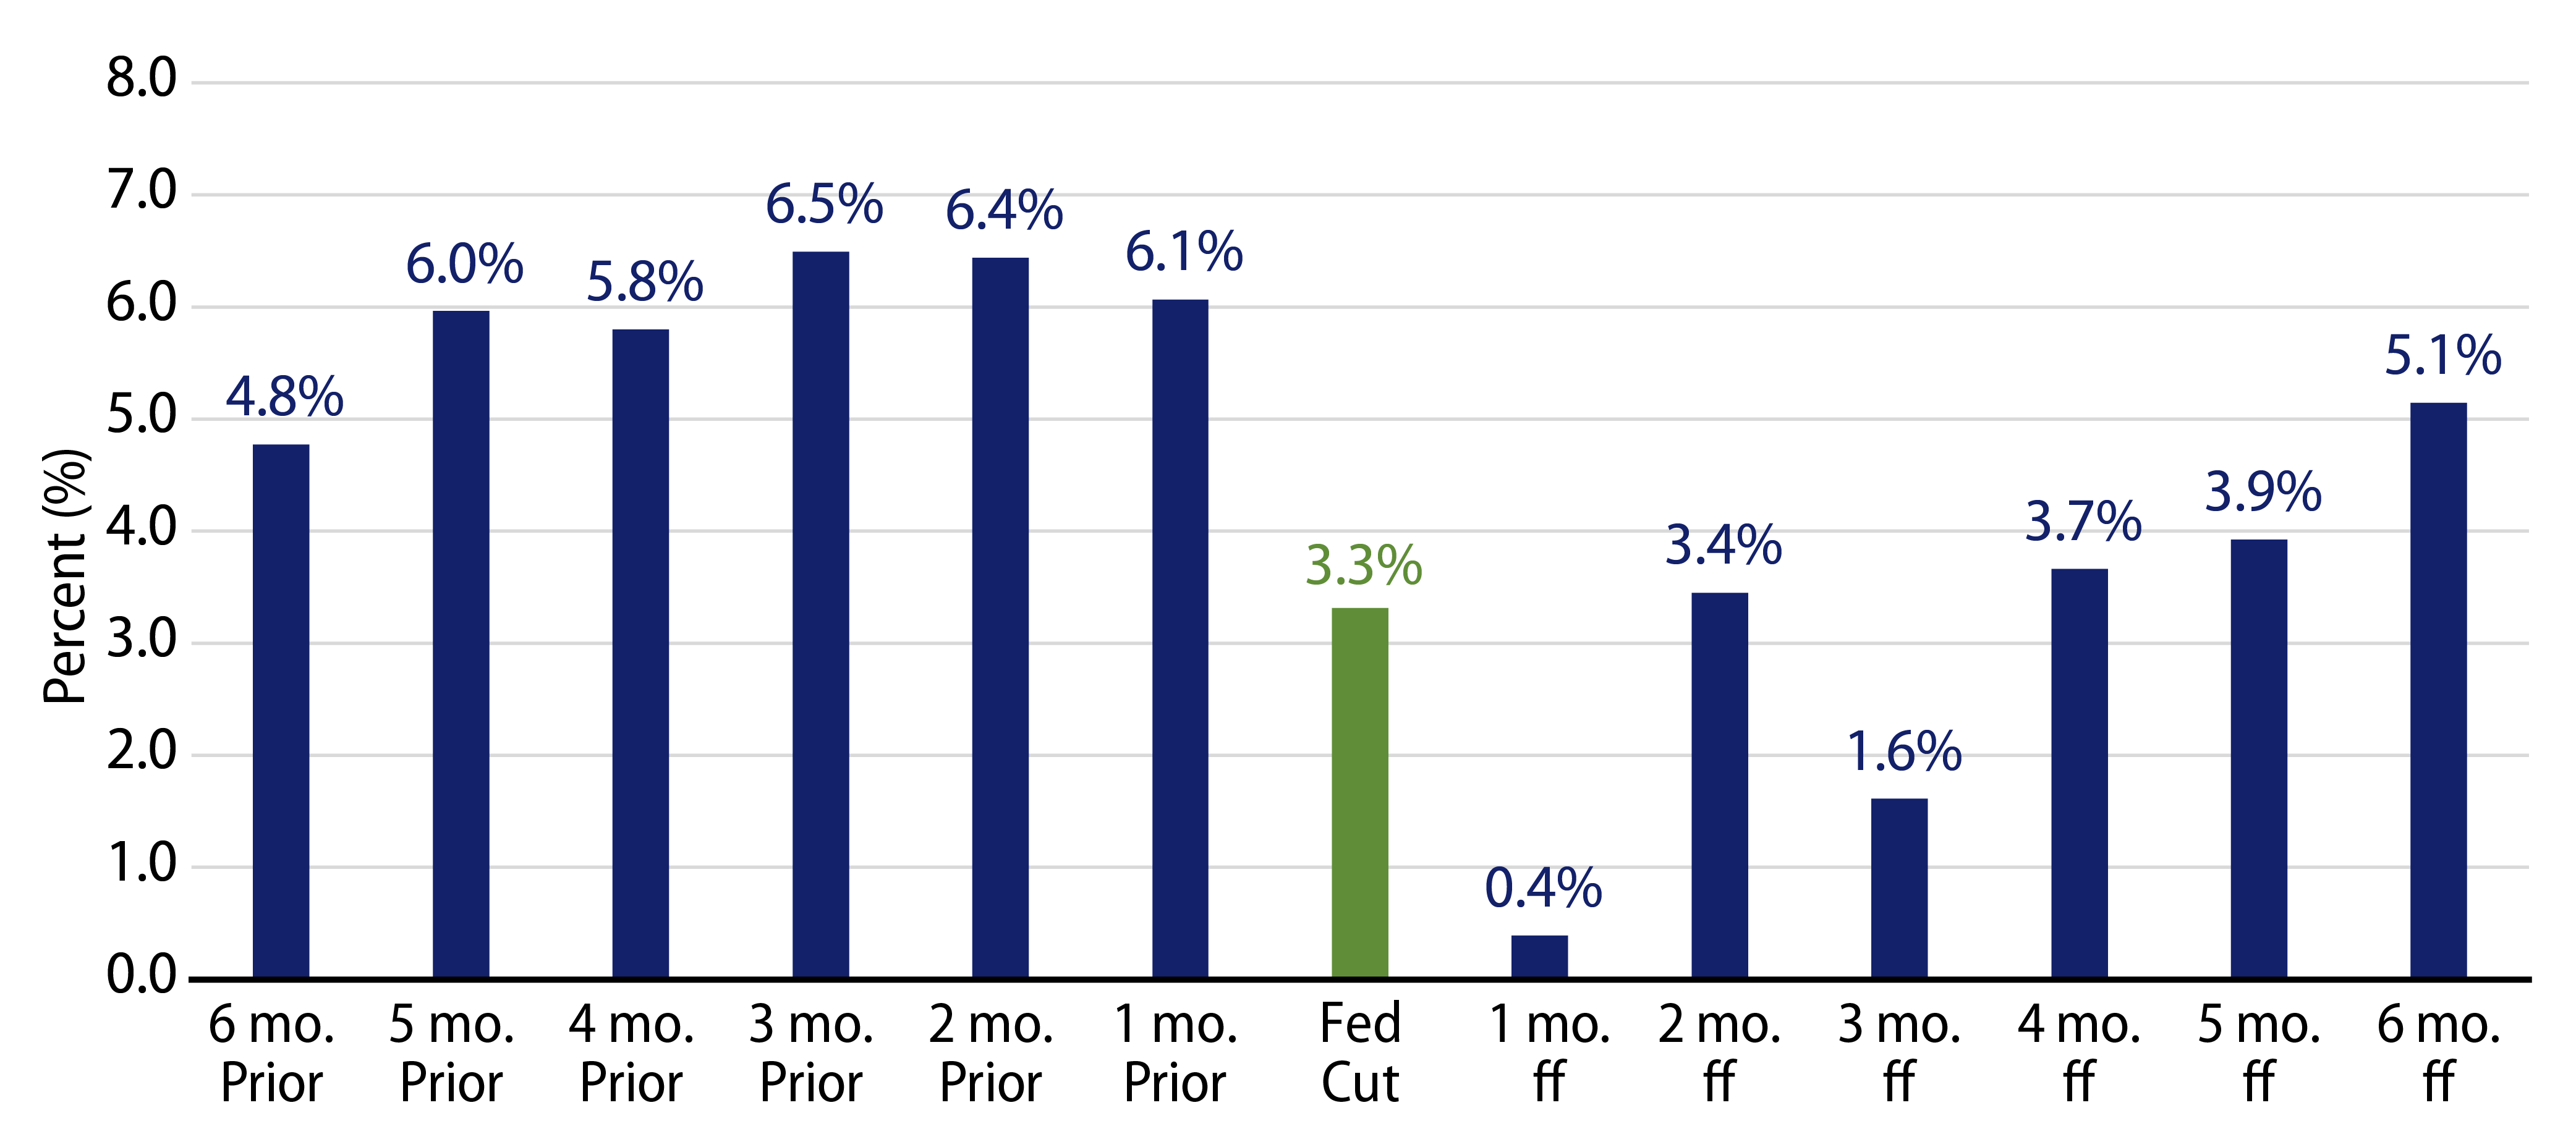
While Western Asset believes the Fed will cut rates in 2024, the timing and magnitude could remain in flux. While it may not feel like it, this year’s resilient economic conditions that have moved projected rate cut expectations out three to six months could provide a silver lining and bode well for municipal allocations that are benefiting from higher tax-exempt income levels. If past is precedent, and there can be no guarantee that it is, investors waiting to put cash to work until Fed cuts transpire could be better served by investing prior to the rate cut.

Municipal Credit Curves and Relative Value

Exhibit 3: Muni Credit Curves
Explore Muni Credit Curves
Source: Bloomberg, Western Asset. As of 08 Mar 24. Bloomberg BVAL Municipal Credit Indices (AAA, AA, A, BBB, respectively) and US Sovereign Curves. Taxable-Equivalent Muni Credit Curves consider the top marginal effective tax rate of 40.8%. Select the image to expand the view.
Exhibit 4: Taxable-Equivalent Muni Credit Curves
Explore Taxable-Equivalent Muni Credit Curves
Source: Bloomberg, Western Asset. As of 08 Mar 24. Bloomberg BVAL Municipal Credit Indices (AAA, AA, A, BBB, respectively) and US Sovereign Curves. Taxable-Equivalent Muni Credit Curves consider the top marginal effective tax rate of 40.8%. Select the image to expand the view.
Exhibit 5: AAA Munis versus Treasuries
Explore AAA Munis versus Treasuries
Source: Muni Yields: Thomson Reuters MMD, Treasury Yields: Bloomberg. As of 08 Mar 24. Past performance is not a guarantee of future results. It is not possible to invest directly in an Index. Select the image to expand the view.
Exhibit 6: Tax-Exempt and Taxable Muni Valuations
Explore Tax-Exempt and Taxable Muni Valuations
Source: Bloomberg. Yield-to-worst (YTW) is the lowest potential yield that can be received on a bond without the issuer actually defaulting. As of 08 Mar 24. Select the image to expand the view.

Western Asset Key Themes for Muni Investors

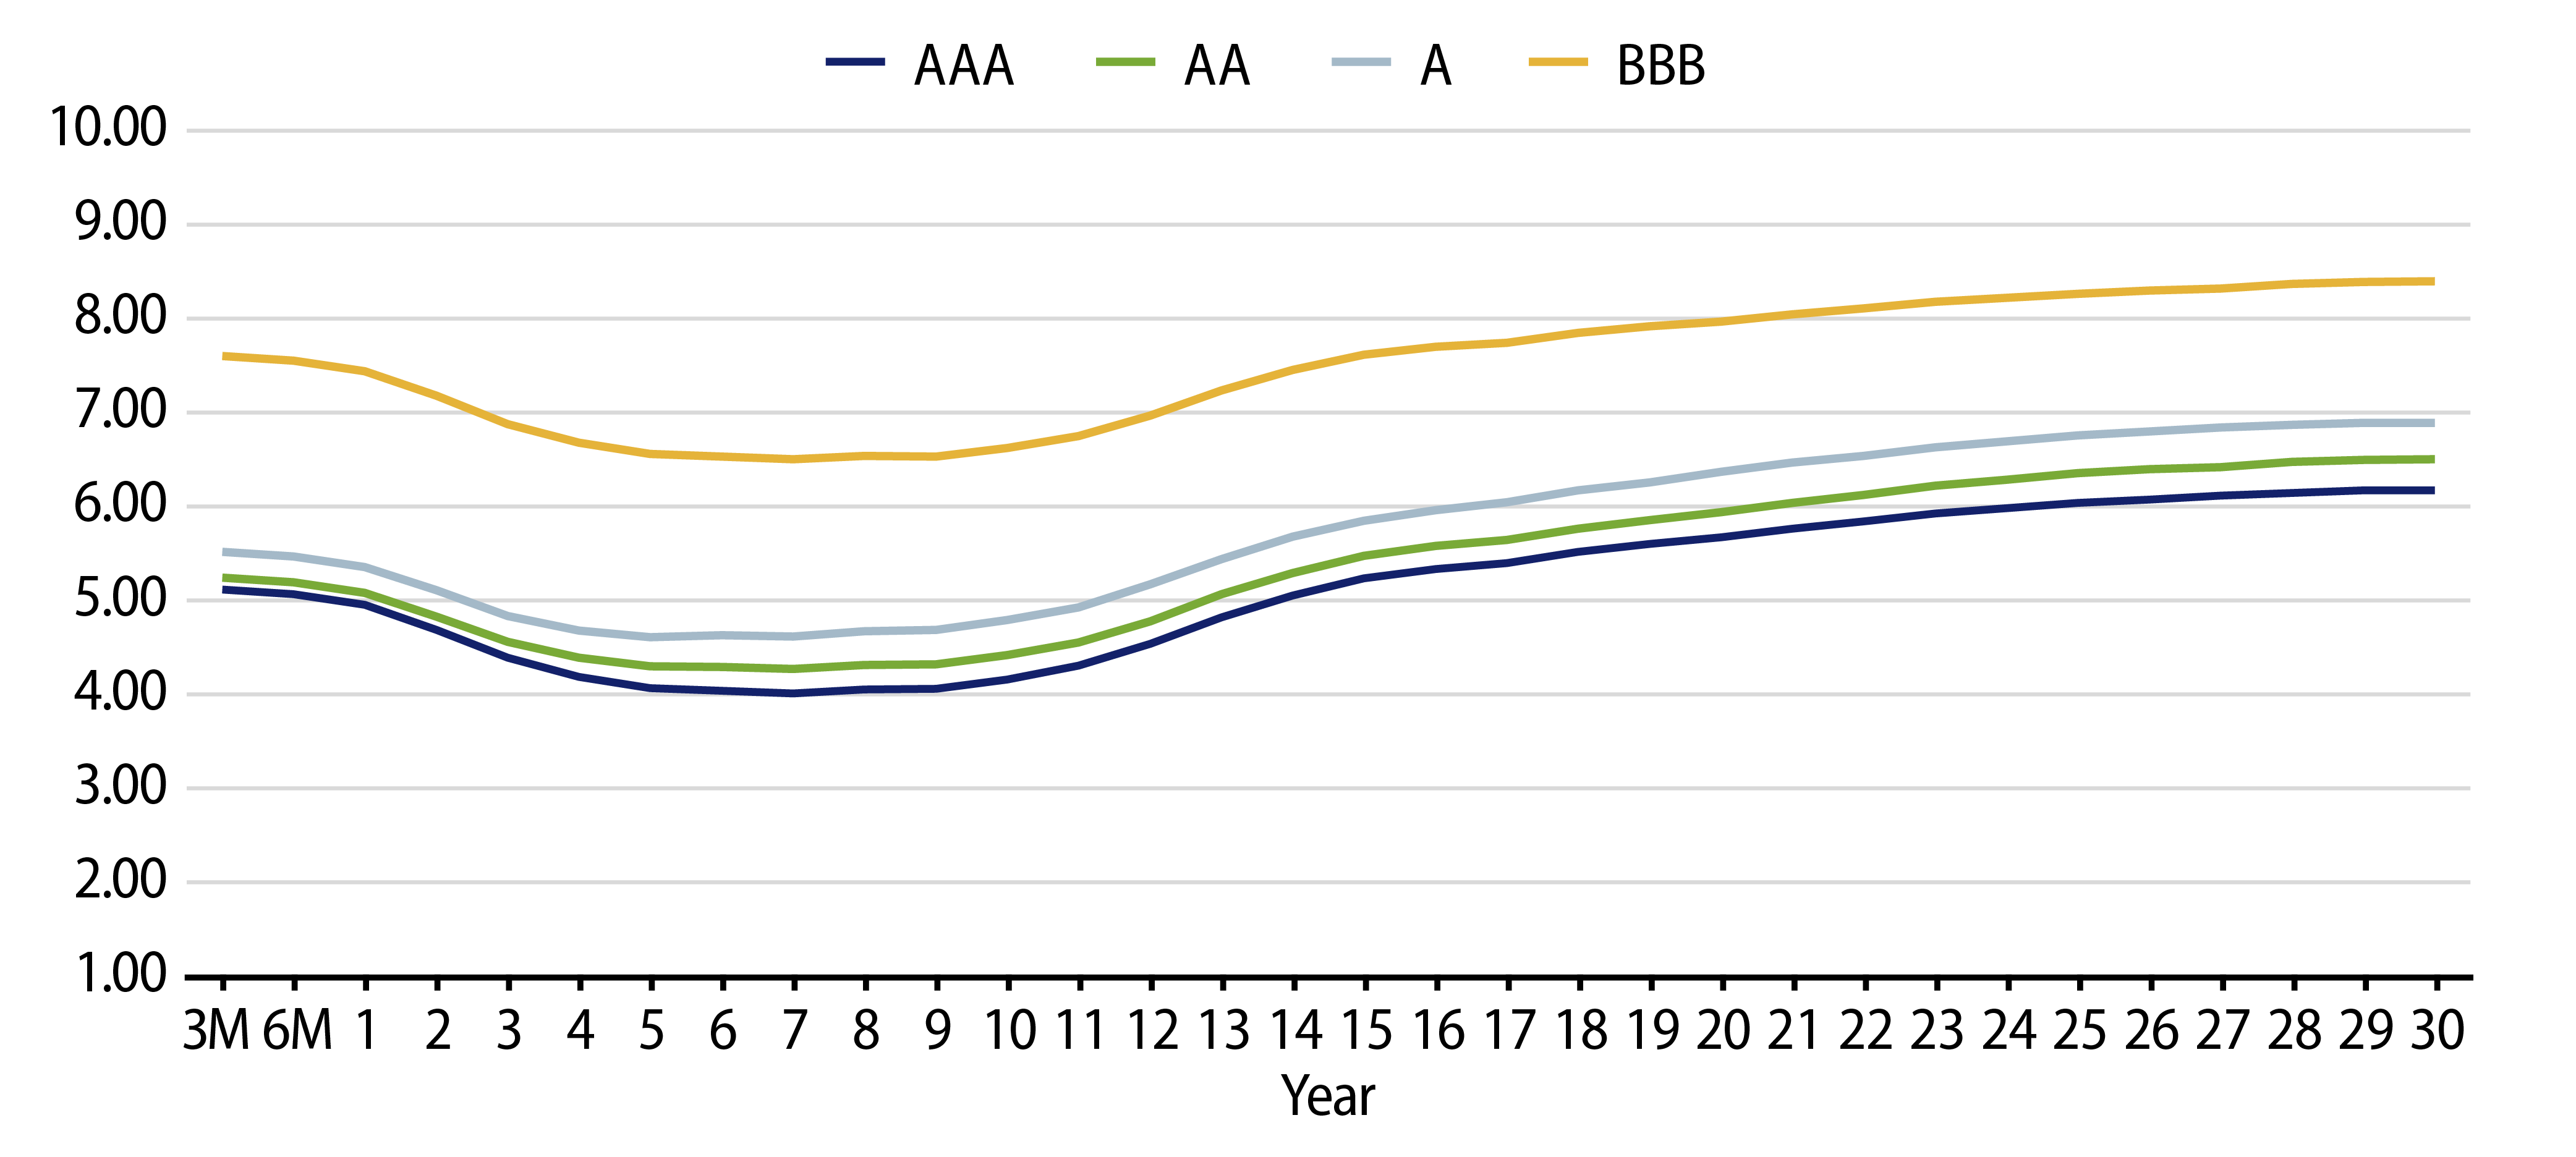
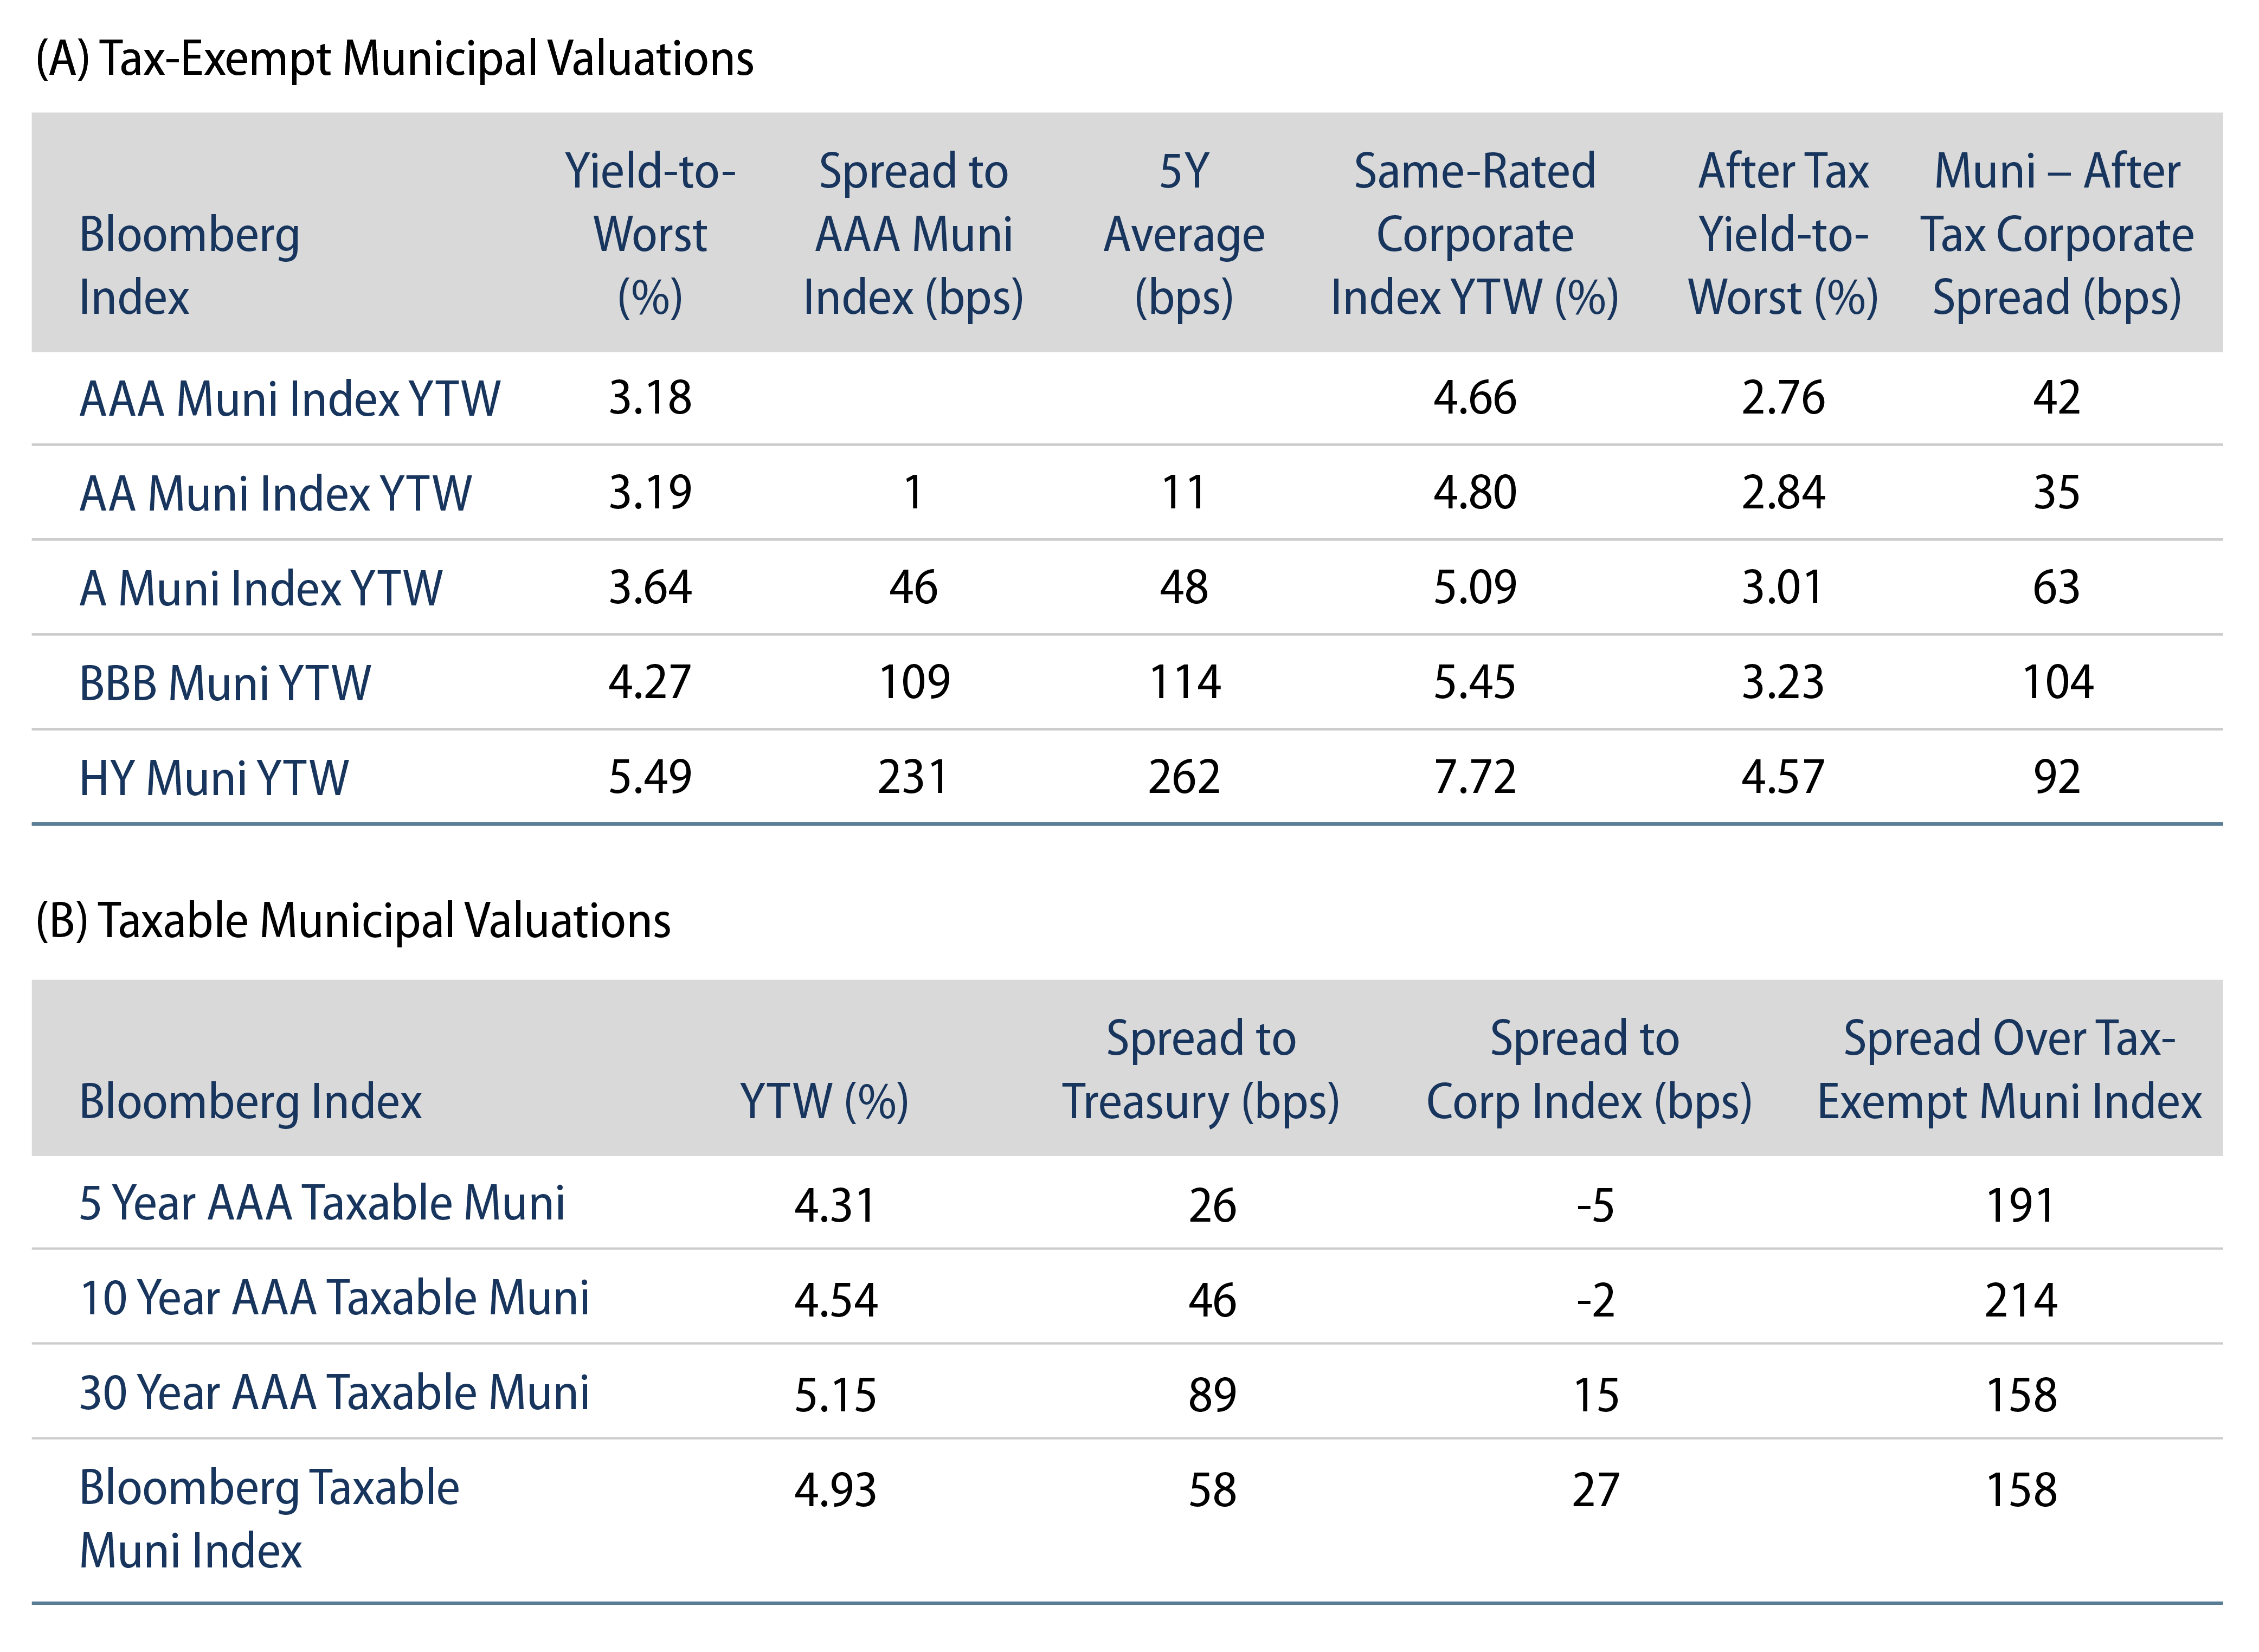
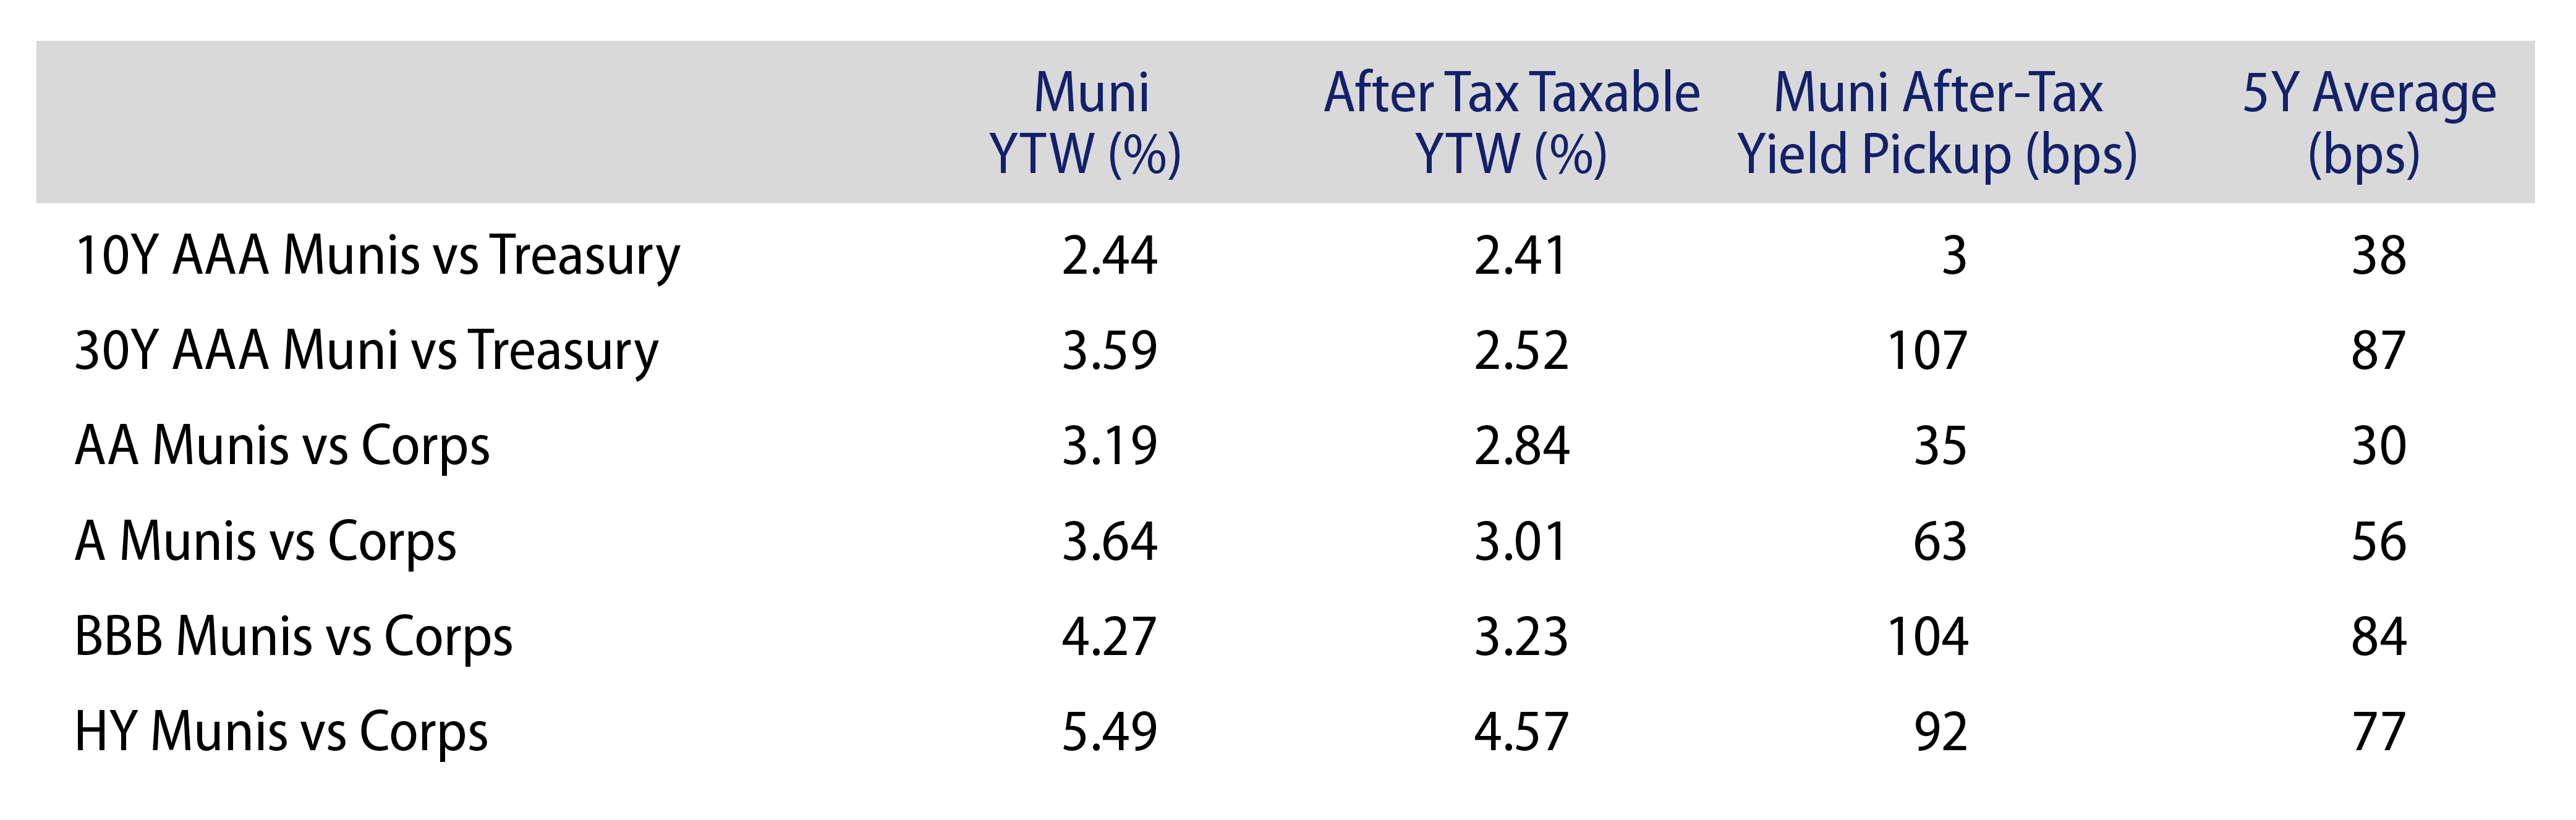
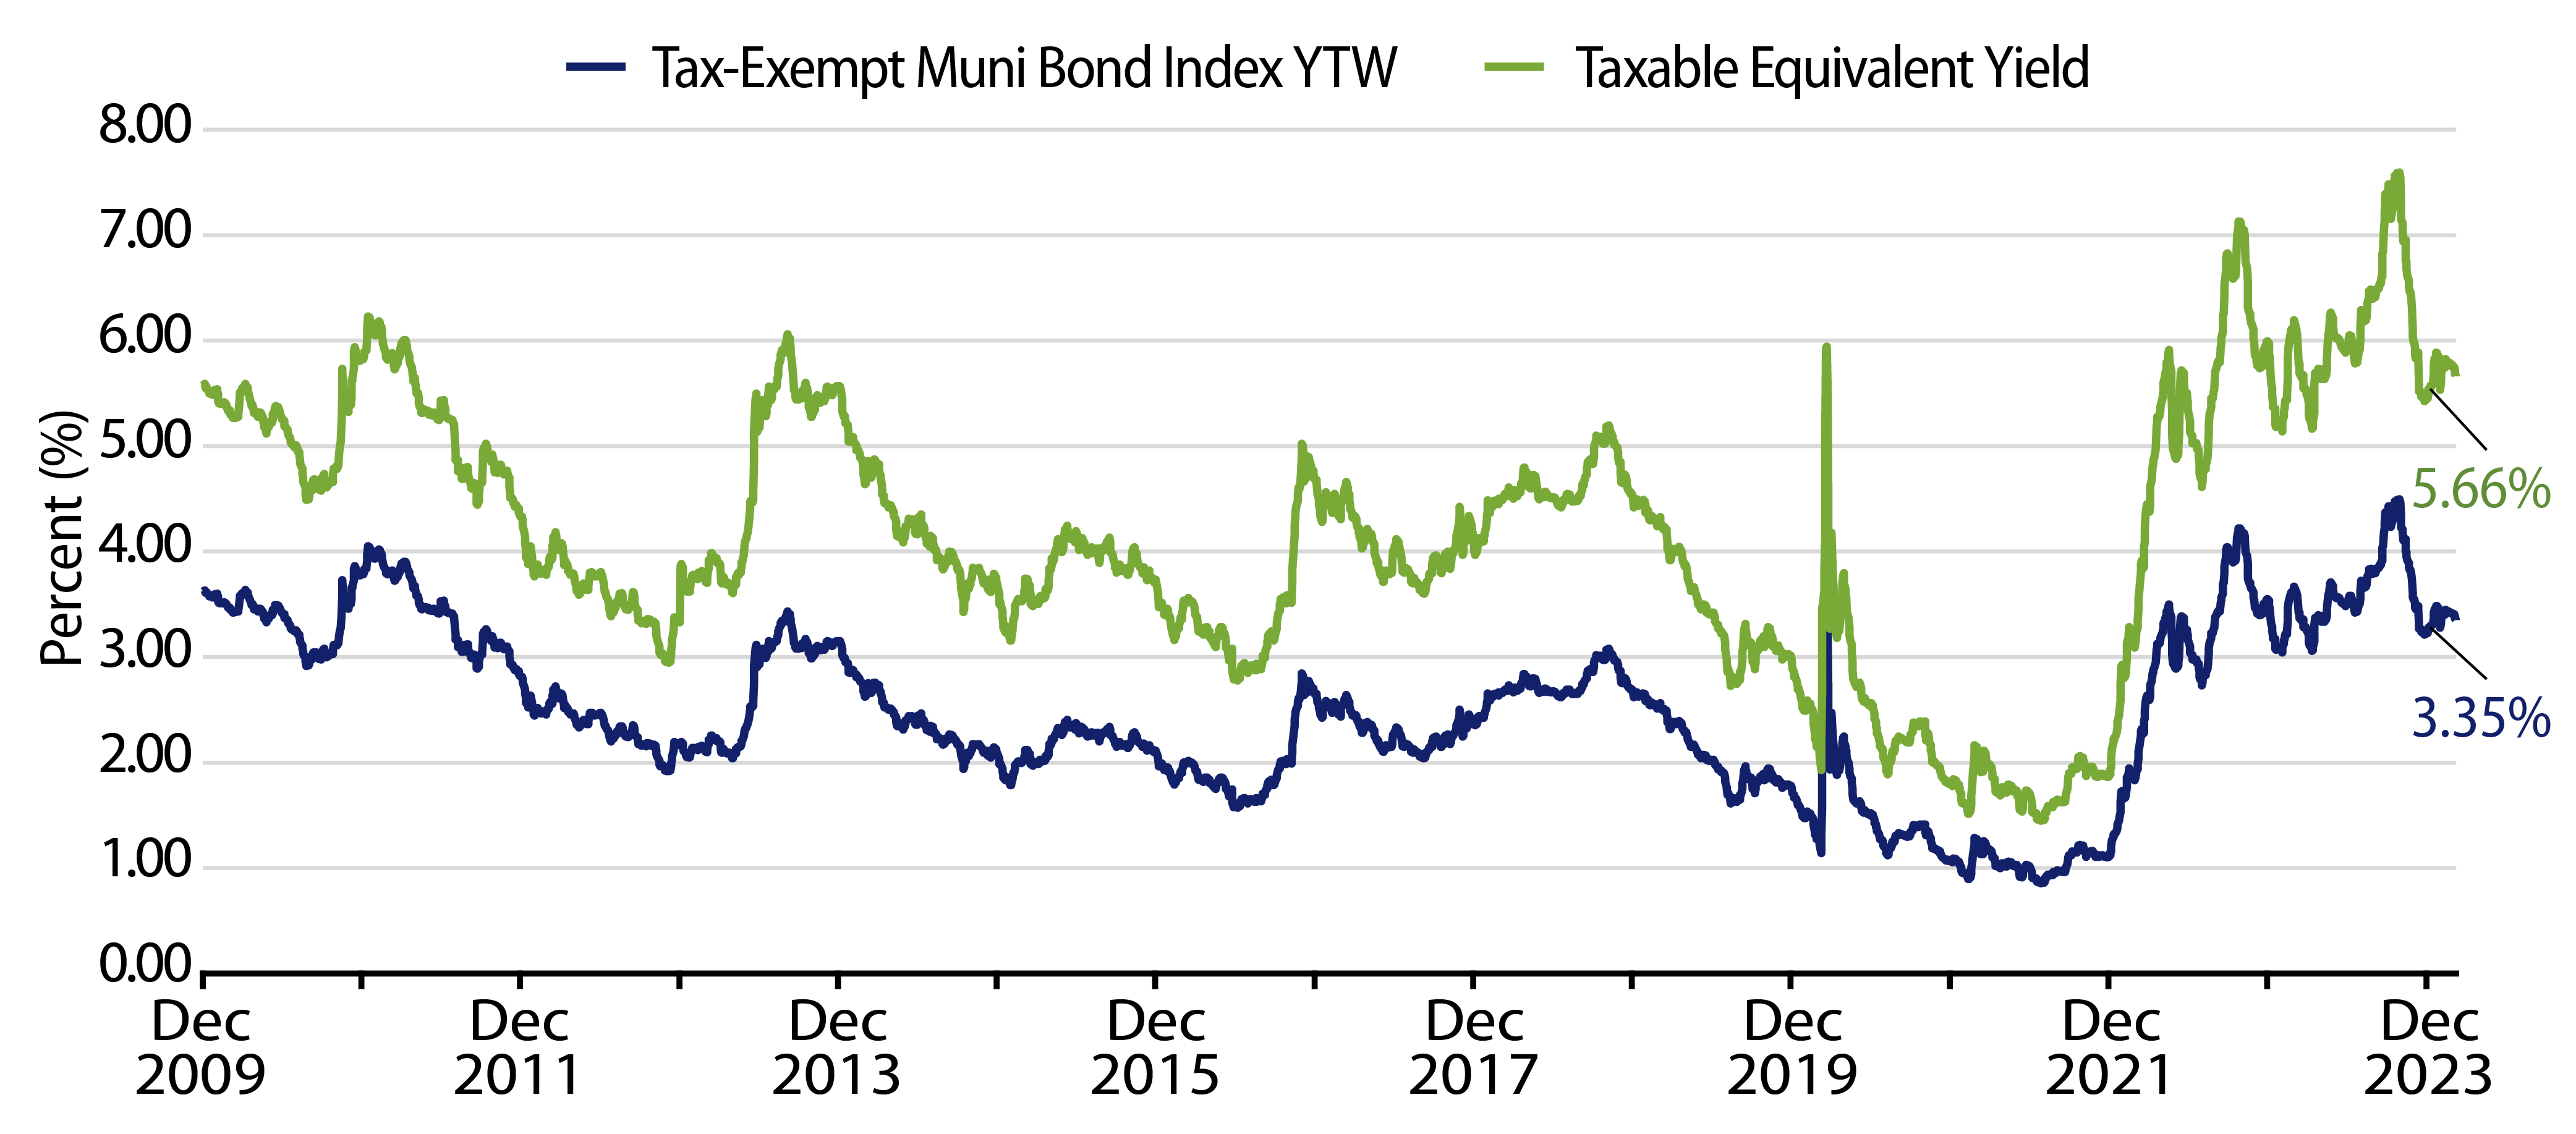
Theme #1: Municipal taxable-equivalent yields are above decade averages.

Exhibit 7: Muni and Taxable-Equivalent Muni Yield-to-Worst
Explore Muni and Taxable-Equivalent Muni Yield-to-Worst
Source: Bloomberg, Western Asset. As of 08 Mar 24. Bloomberg Municipal Bond Index Yield Considering Highest Marginal Tax Rate. Yield-to-worst (YTW) is the lowest potential yield that can be received on a bond without the issuer actually defaulting. Select the image to expand the view.

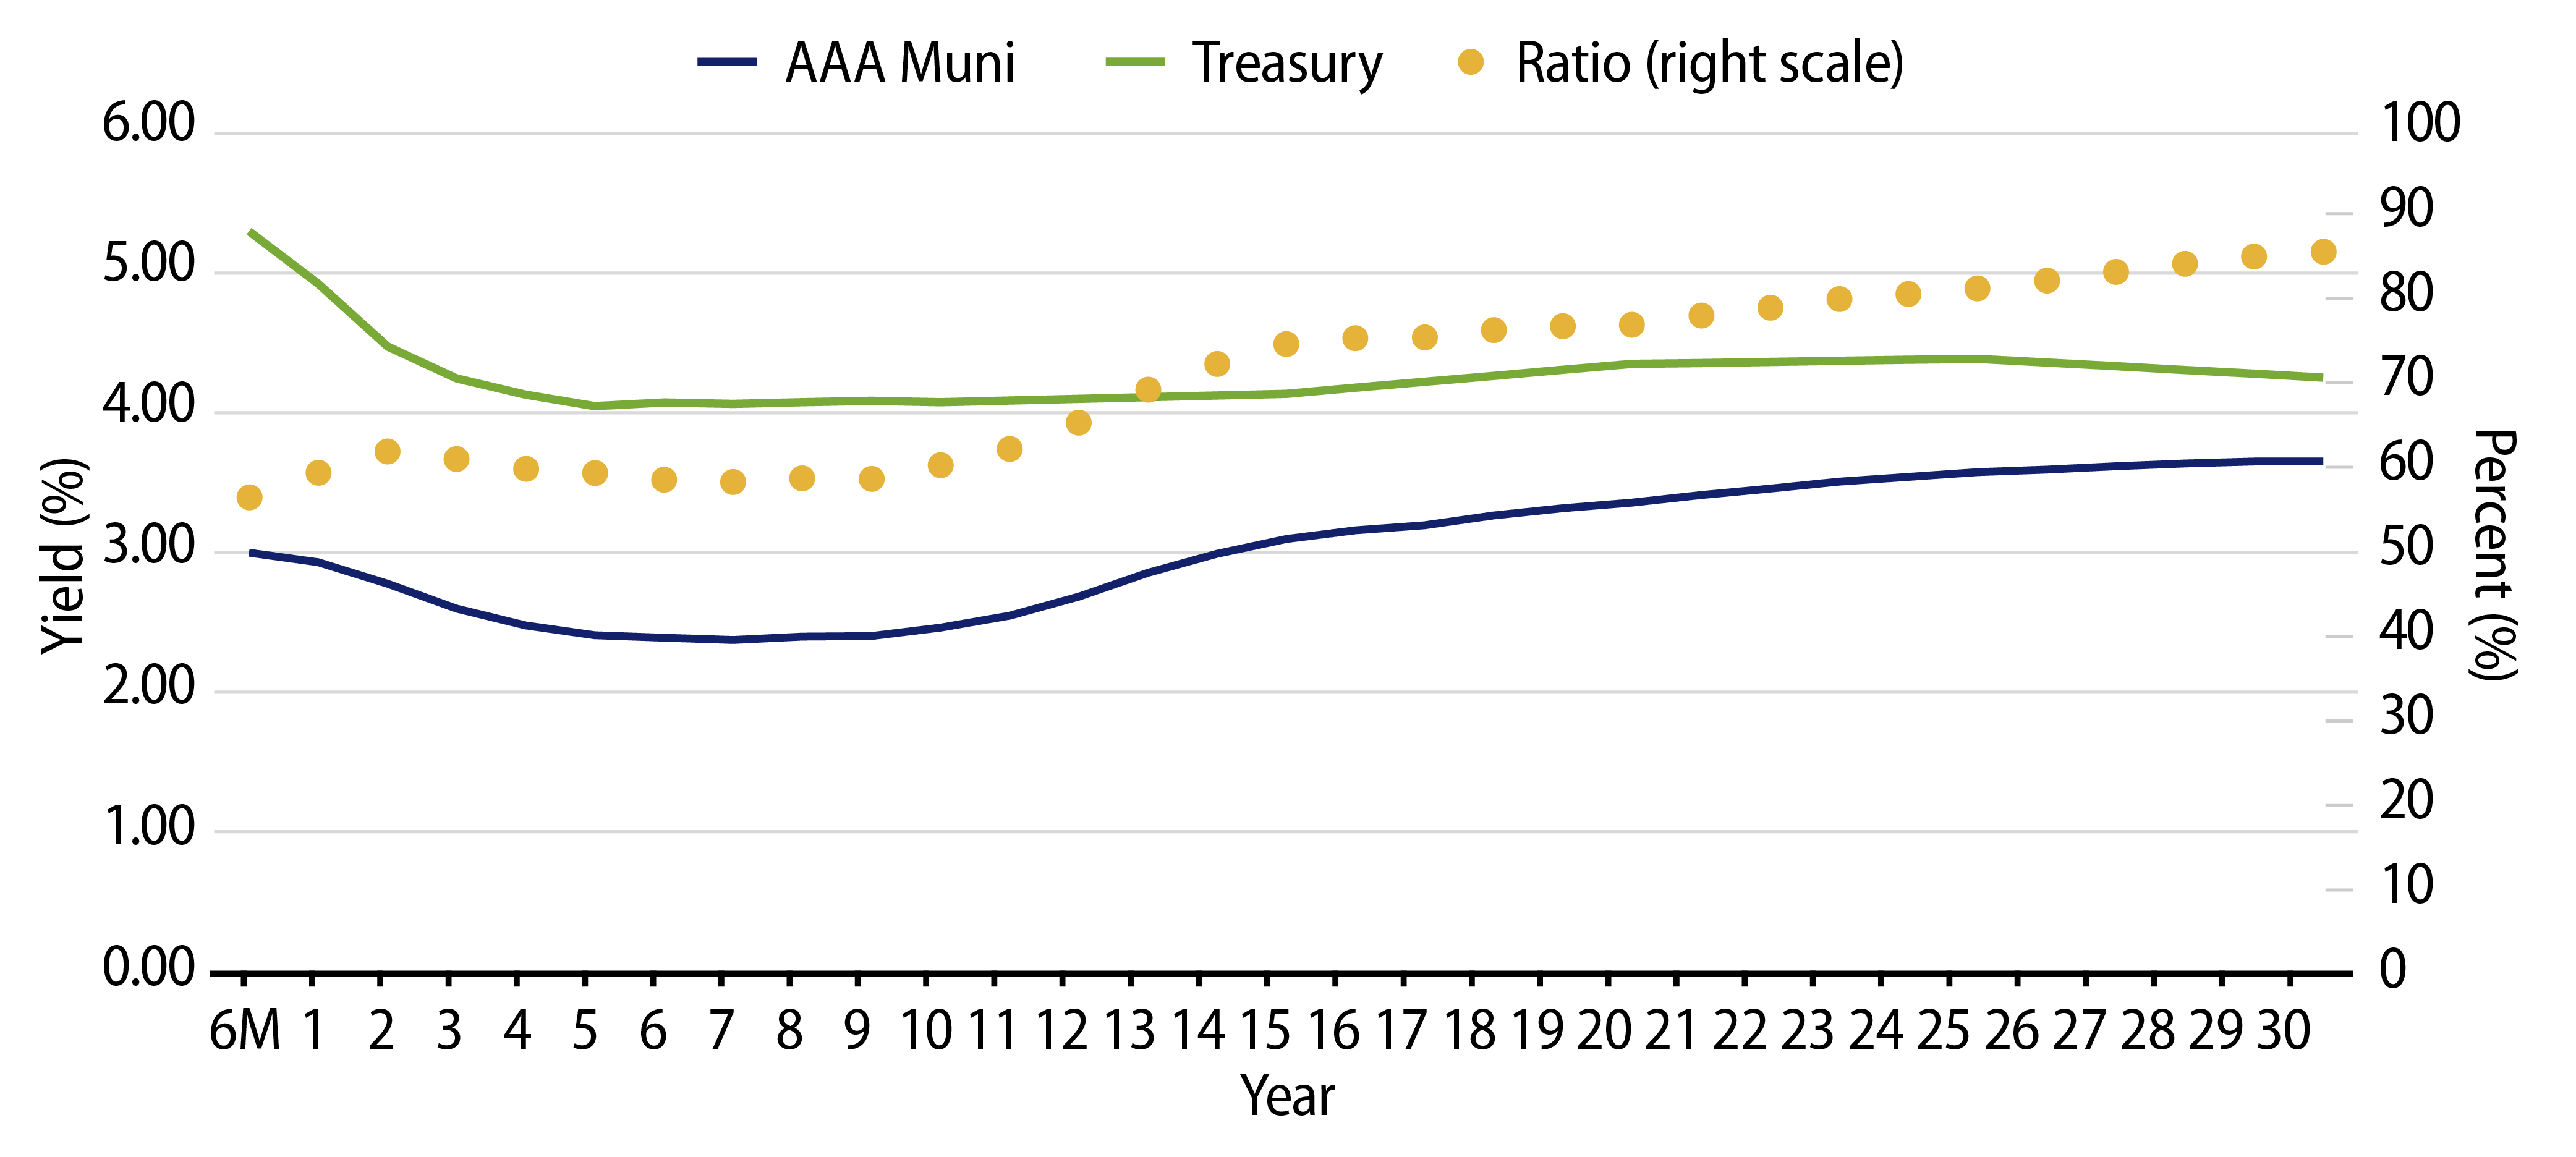
Theme #2: Curve inversion underscores relative value in longer maturities.

Exhibit 8: AAA Municipal vs. Treasury Yield Curves
Explore AAA Municipal vs. Treasury Yield Curves
Source: Bloomberg, Western Asset. As of 08 Mar 24. Bloomberg BVAL AAA Muni Curve and US On-/Off-the-Run Sovereign Curve. Select the image to expand the view.

Theme #3: Munis offer attractive after-tax yield pickup versus long Treasuries and corporate credit.

Exhibit 9: Municipal vs. Taxable Fixed-Income Yields by Quality
Explore Municipal vs. Taxable Fixed-Income Yields by Quality
Source: Western Asset, Bloomberg. As 08 Mar 24. Bloomberg BVAL AAA Muni Curve and US On-/Off-the-Run Sovereign Curve. After-tax yield considers top marginal tax rate of 40.8%. Select the image to expand the view.

© Western Asset Management Company, LLC 2024. The information contained in these materials ("the materials") is intended for the exclusive use of the designated recipient ("the recipient"). This information is proprietary and confidential and may contain commercially sensitive information, and may not be copied, reproduced or republished, in whole or in part, without the prior written consent of Western Asset Management Company ("Western Asset").
Past performance does not predict future returns. These materials should not be deemed to be a prediction or projection of future performance. These materials are intended for investment professionals including professional clients, eligible counterparties, and qualified investors only.
These materials have been produced for illustrative and informational purposes only. These materials contain Western Asset's opinions and beliefs as of the date designated on the materials; these views are subject to change and may not reflect real-time market developments and investment views.
Third party data may be used throughout the materials, and this data is believed to be accurate to the best of Western Asset's knowledge at the time of publication, but cannot be guaranteed. These materials may also contain strategy or product awards or rankings from independent third parties or industry publications which are based on unbiased quantitative and/or qualitative information determined independently by each third party or publication. In some cases, Western Asset may subscribe to these third party's standard industry services or publications. These standard subscriptions and services are available to all asset managers and do not influence rankings or awards in any way.
Investment strategies or products discussed herein may involve a high degree of risk, including the loss of some or all capital. Investments in any products or strategies described in these materials may be volatile, and investors should have the financial ability and willingness to accept such risks.
Unless otherwise noted, investment performance contained in these materials is reflective of a strategy composite. All other strategy data and information included in these materials reflects a representative portfolio which is an account in the composite that Western Asset believes most closely reflects the current portfolio management style of the strategy. Performance is not a consideration in the selection of the representative portfolio. The characteristics of the representative portfolio shown may differ from other accounts in the composite. Information regarding the representative portfolio and the other accounts in the composite are available upon request. Statements in these materials should not be considered investment advice. References, either general or specific, to securities and/or issuers in the materials are for illustrative purposes only and are not intended to be, and should not be interpreted as, recommendation to purchase or sell such securities. Employees and/or clients of Western Asset may have a position in the securities or issuers mentioned.
These materials are not intended to provide, and should not be relied on for, accounting, legal, tax, investment or other advice. The recipient should consult its own counsel, accountant, investment, tax, and any other advisers for this advice, including economic risks and merits, related to making an investment with Western Asset. The recipient is responsible for observing the applicable laws and regulations of their country of residence.
Founded in 1971, Western Asset Management Company is a global fixed-income investment manager with offices in Pasadena, New York, London, Singapore, Tokyo, Melbourne, São Paulo, Hong Kong, and Zürich. Western Asset is a wholly owned subsidiary of Franklin Resources, Inc. but operates autonomously. Western Asset is comprised of six legal entities across the globe, each with distinct regional registrations: Western Asset Management Company, LLC, a registered Investment Adviser with the Securities and Exchange Commission; Western Asset Management Company Distribuidora de Títulos e Valores Mobiliários Limitada is authorized and regulated by Comissão de Valores Mobiliários and Brazilian Central Bank; Western Asset Management Company Pty Ltd ABN 41 117 767 923 is the holder of the Australian Financial Services License 303160; Western Asset Management Company Pte. Ltd. Co. Reg. No. 200007692R is a holder of a Capital Markets Services License for fund management and regulated by the Monetary Authority of Singapore; Western Asset Management Company Ltd, a registered Financial Instruments Business Operator and regulated by the Financial Services Agency of Japan; and Western Asset Management Company Limited is authorised and regulated by the Financial Conduct Authority ("FCA") (FRN 145930). This communication is intended for distribution to Professional Clients only if deemed to be a financial promotion in the UK as defined by the FCA. This communication may also be intended for certain EEA countries where Western Asset has been granted permission to do so. For the current list of the approved EEA countries please contact Western Asset at +44 (0)20 7422 3000.