skip navigation
Blog

Stay up to date on timely topics and market events. Subscribe to our Blog now.

MARKETS
22 October 2024

Weekly Municipal Monitor—Corporate Income Taxes

By Sam Weitzman

Stay up to date on timely topics and market events. Subscribe to our Blog now.

Munis Posted Positive Returns Last Week

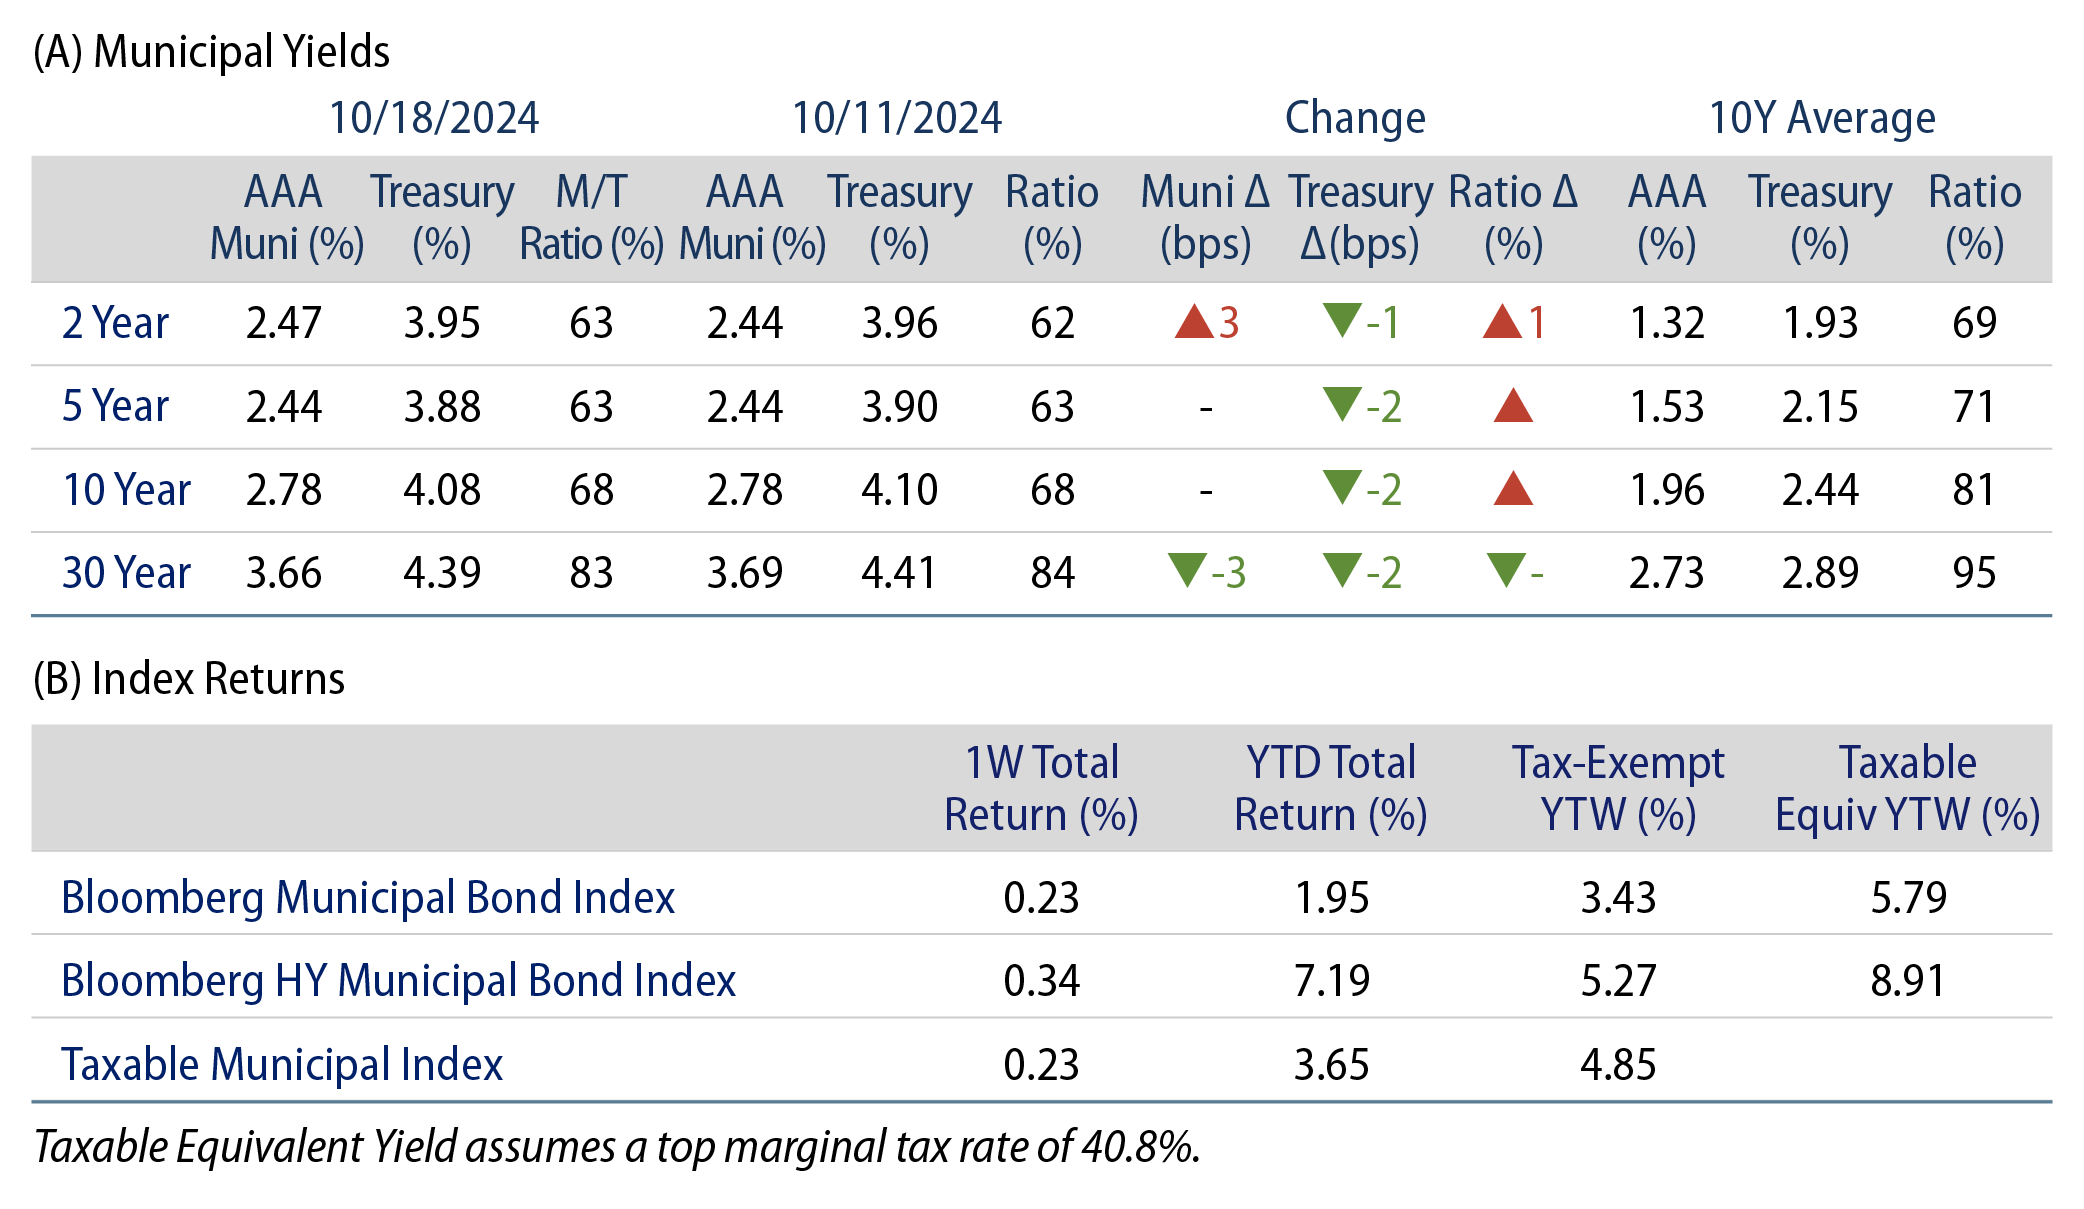
Municipals posted positive returns last week as fixed-income markets saw positive total returns amid the lower yield conditions. Munis generally outperformed, as demand improved with strong fund flows and supply remained elevated. September retail sales data came in stronger than expected and October initial jobless claims of 241,000 came in below consensus and below last month’s levels. Despite the strong data, fixed-income yields largely moved lower across the curve as the market appeared to coalesce around expectations for continued rate cuts this year. Meanwhile, the high-grade muni yield curve steepened, moving lower with Treasuries in long maturities but moving higher in short maturities. The Bloomberg Municipal Index returned 0.23% during the week, the High Yield Muni Index returned 0.34% and the Taxable Muni Index returned 0.23%. This week we highlight potential corporate tax policy implications of the upcoming election.

Muni Inflows and Elevated Supply Persist

Fund Flows (up $1.78 billion): During the week ending October 16, weekly reporting municipal mutual funds recorded $1.7 billion of net inflows, according to Lipper. Long-term funds recorded $997 million of inflows, intermediate funds recorded $541 million of inflows and high-yield funds recorded $36 million of inflows. This week’s inflows led estimated year-to-date (YTD) net inflows higher to $32 billion.

Supply (YTD supply of $413 billion, up 45% YoY): The muni market recorded $16 billion of new-issue volume last week, up 40% from the prior week. YTD issuance of $413 billion is 48% higher than last year’s level, with tax-exempt issuance 51% higher and taxable issuance 13% higher year-over-year (YoY). This week’s calendar is expected to remain elevated at $13 billion. The largest deals include $1.5 billion New York City Transitional Finance Authority and $1.5 billion New York Transportation Development Corp (JFK Airport) transactions.

This Week in Munis: Election in Focus—Corporate Income Taxes

Tax policy is typically a key issue in presidential elections, but the upcoming election is especially significant as many provisions of the 2017 Tax Cuts and Jobs Act (TCJA) are set to expire in 2025. For corporations, the TCJA reduced the highest corporate tax rate to 21% (from 35%). Unlike many of the individual income tax provisions associated with the TCJA, the corporate income rate reduction is not slated to expire in 2025. However, both Harris and Trump have voiced diverging corporate tax policies that could change the economics for corporations to invest in municipal bonds.

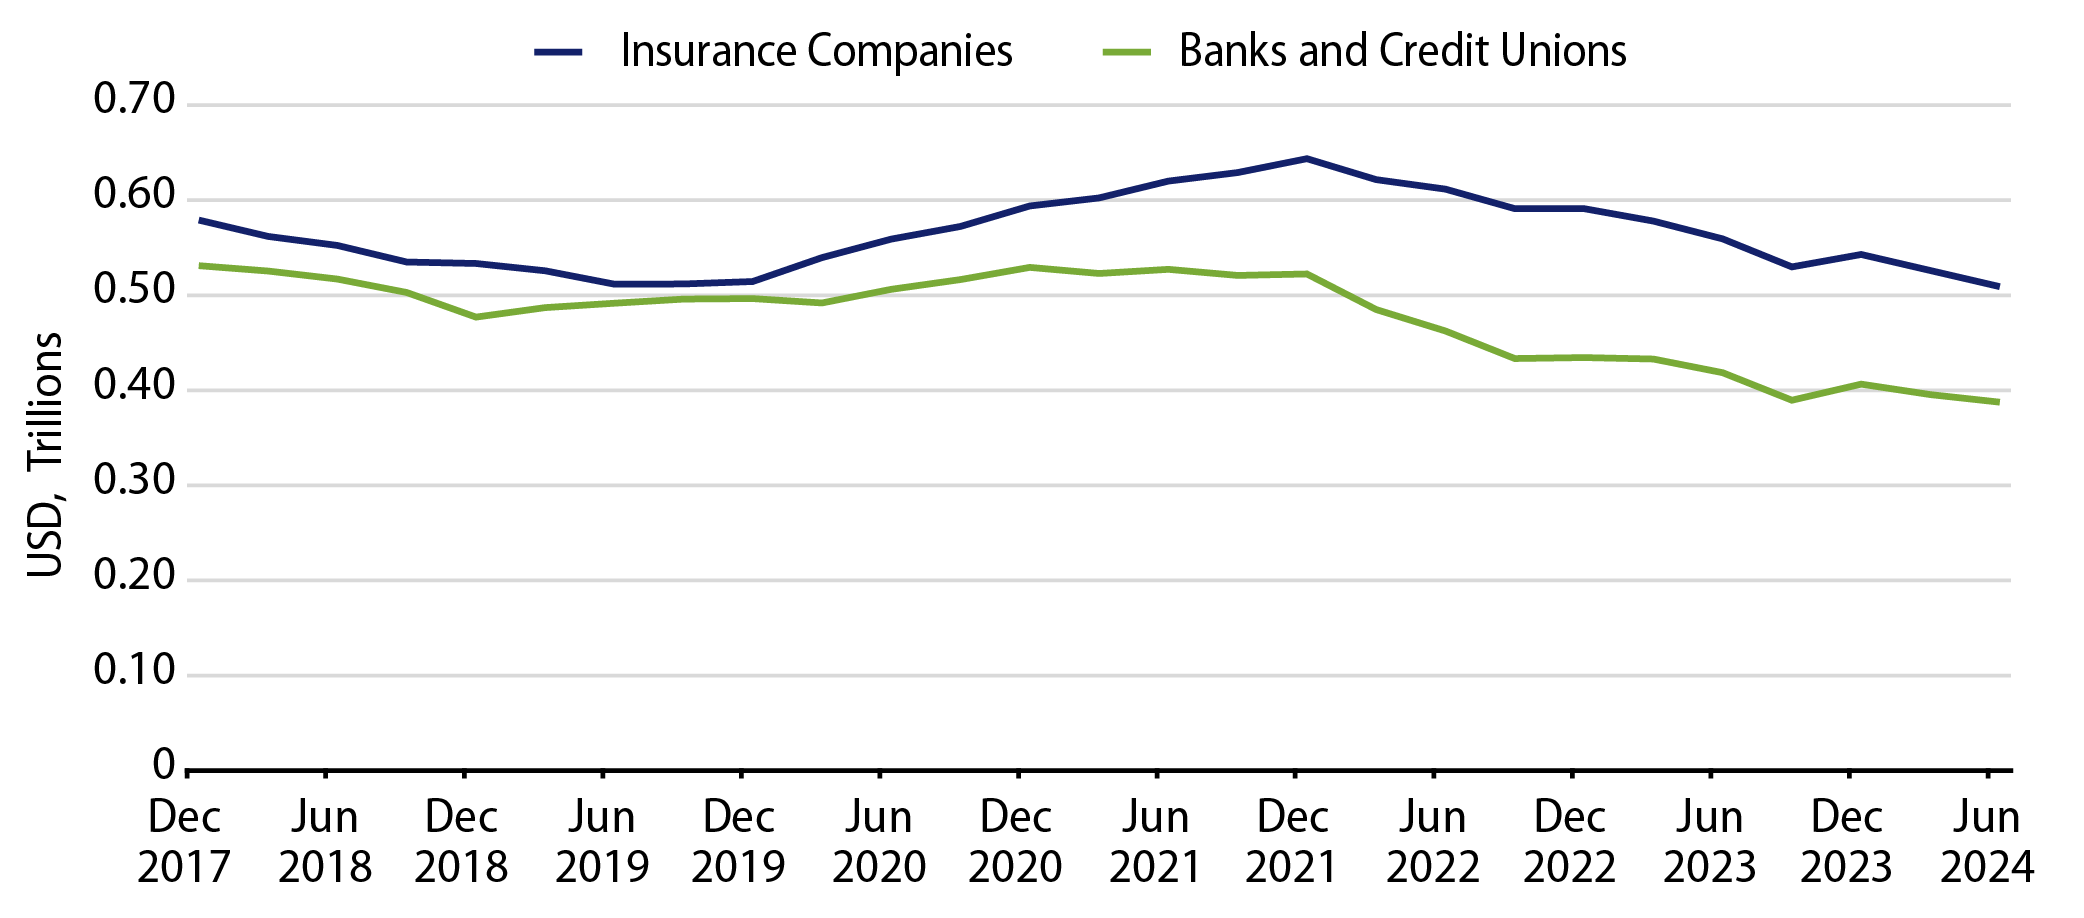
Banks and insurance companies have significantly reduced their muni holdings as tax rates declined following the enactment of the TCJA in 2018. According to Federal Reserve data, insurance company muni holdings declined $144 billion (-27%) to $387 billion and bank muni holdings declined $70 billion to $509 billion since 4Q17. Together, the $213 billion decline of these holdings reduced institutional muni market concentration from 29% to 23%, increasing the concentration of the retail holder of muni debt. The higher retail concentration could contribute to greater market volatility as institutions have historically supported the market during bouts of volatility and fund outflows.

Exhibit 1: Insurance and Bank Holdings of Municipal Debt
Insurance and Bank Holdings of Municipal Debt
Source: Federal Reserve, Western Asset. As of 12 Sep 24. Select the image to expand the view.

Ahead of the upcoming election, Vice President Harris and former President Trump have proposed diverging corporate tax policies. To fund spending initiatives and potentially reduce tax burdens for middle- to lower-income Americans as the TCJA provisions expire, the Harris administration has proposed increasing the corporate tax rate to 28%. Trump, on the other hand, has proposed reducing the corporate tax rate further to 15%.

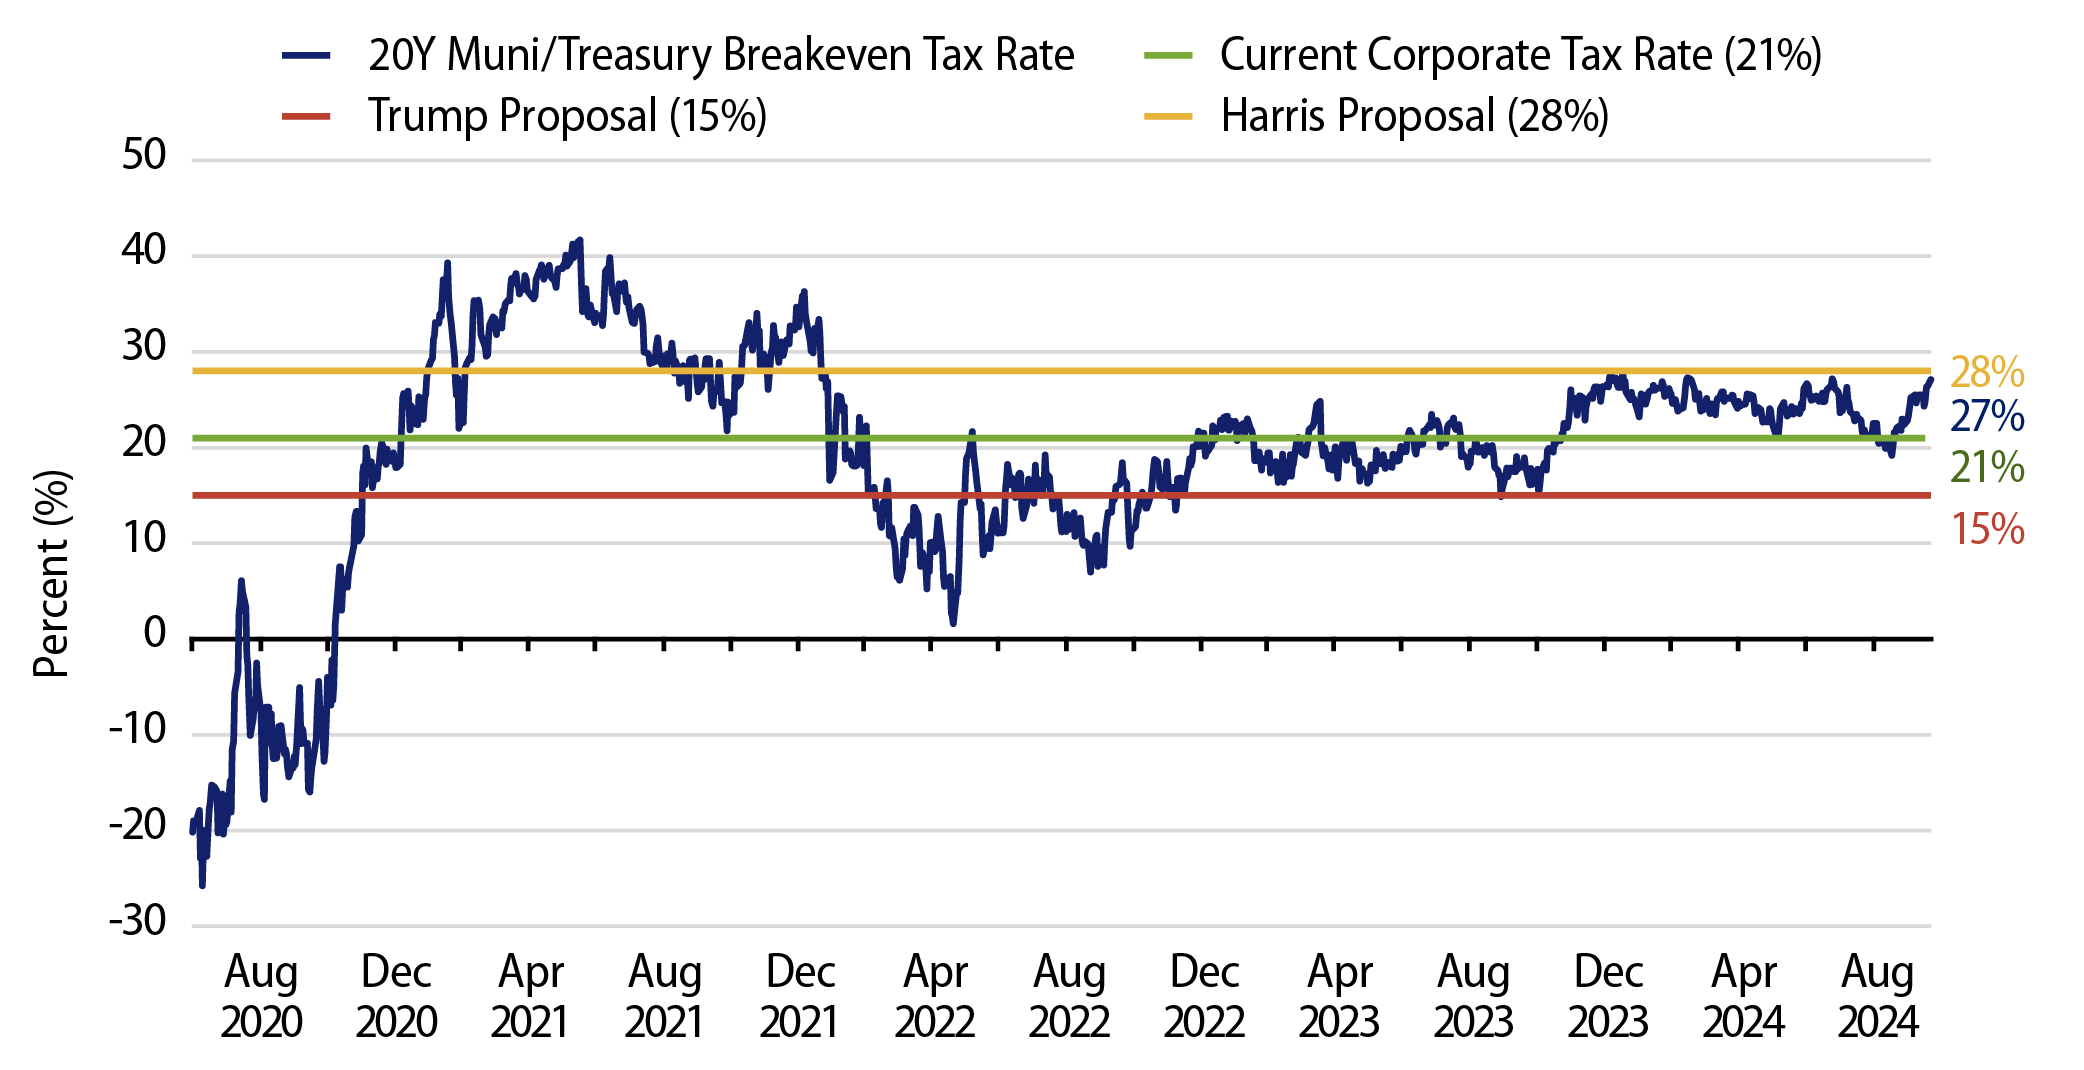
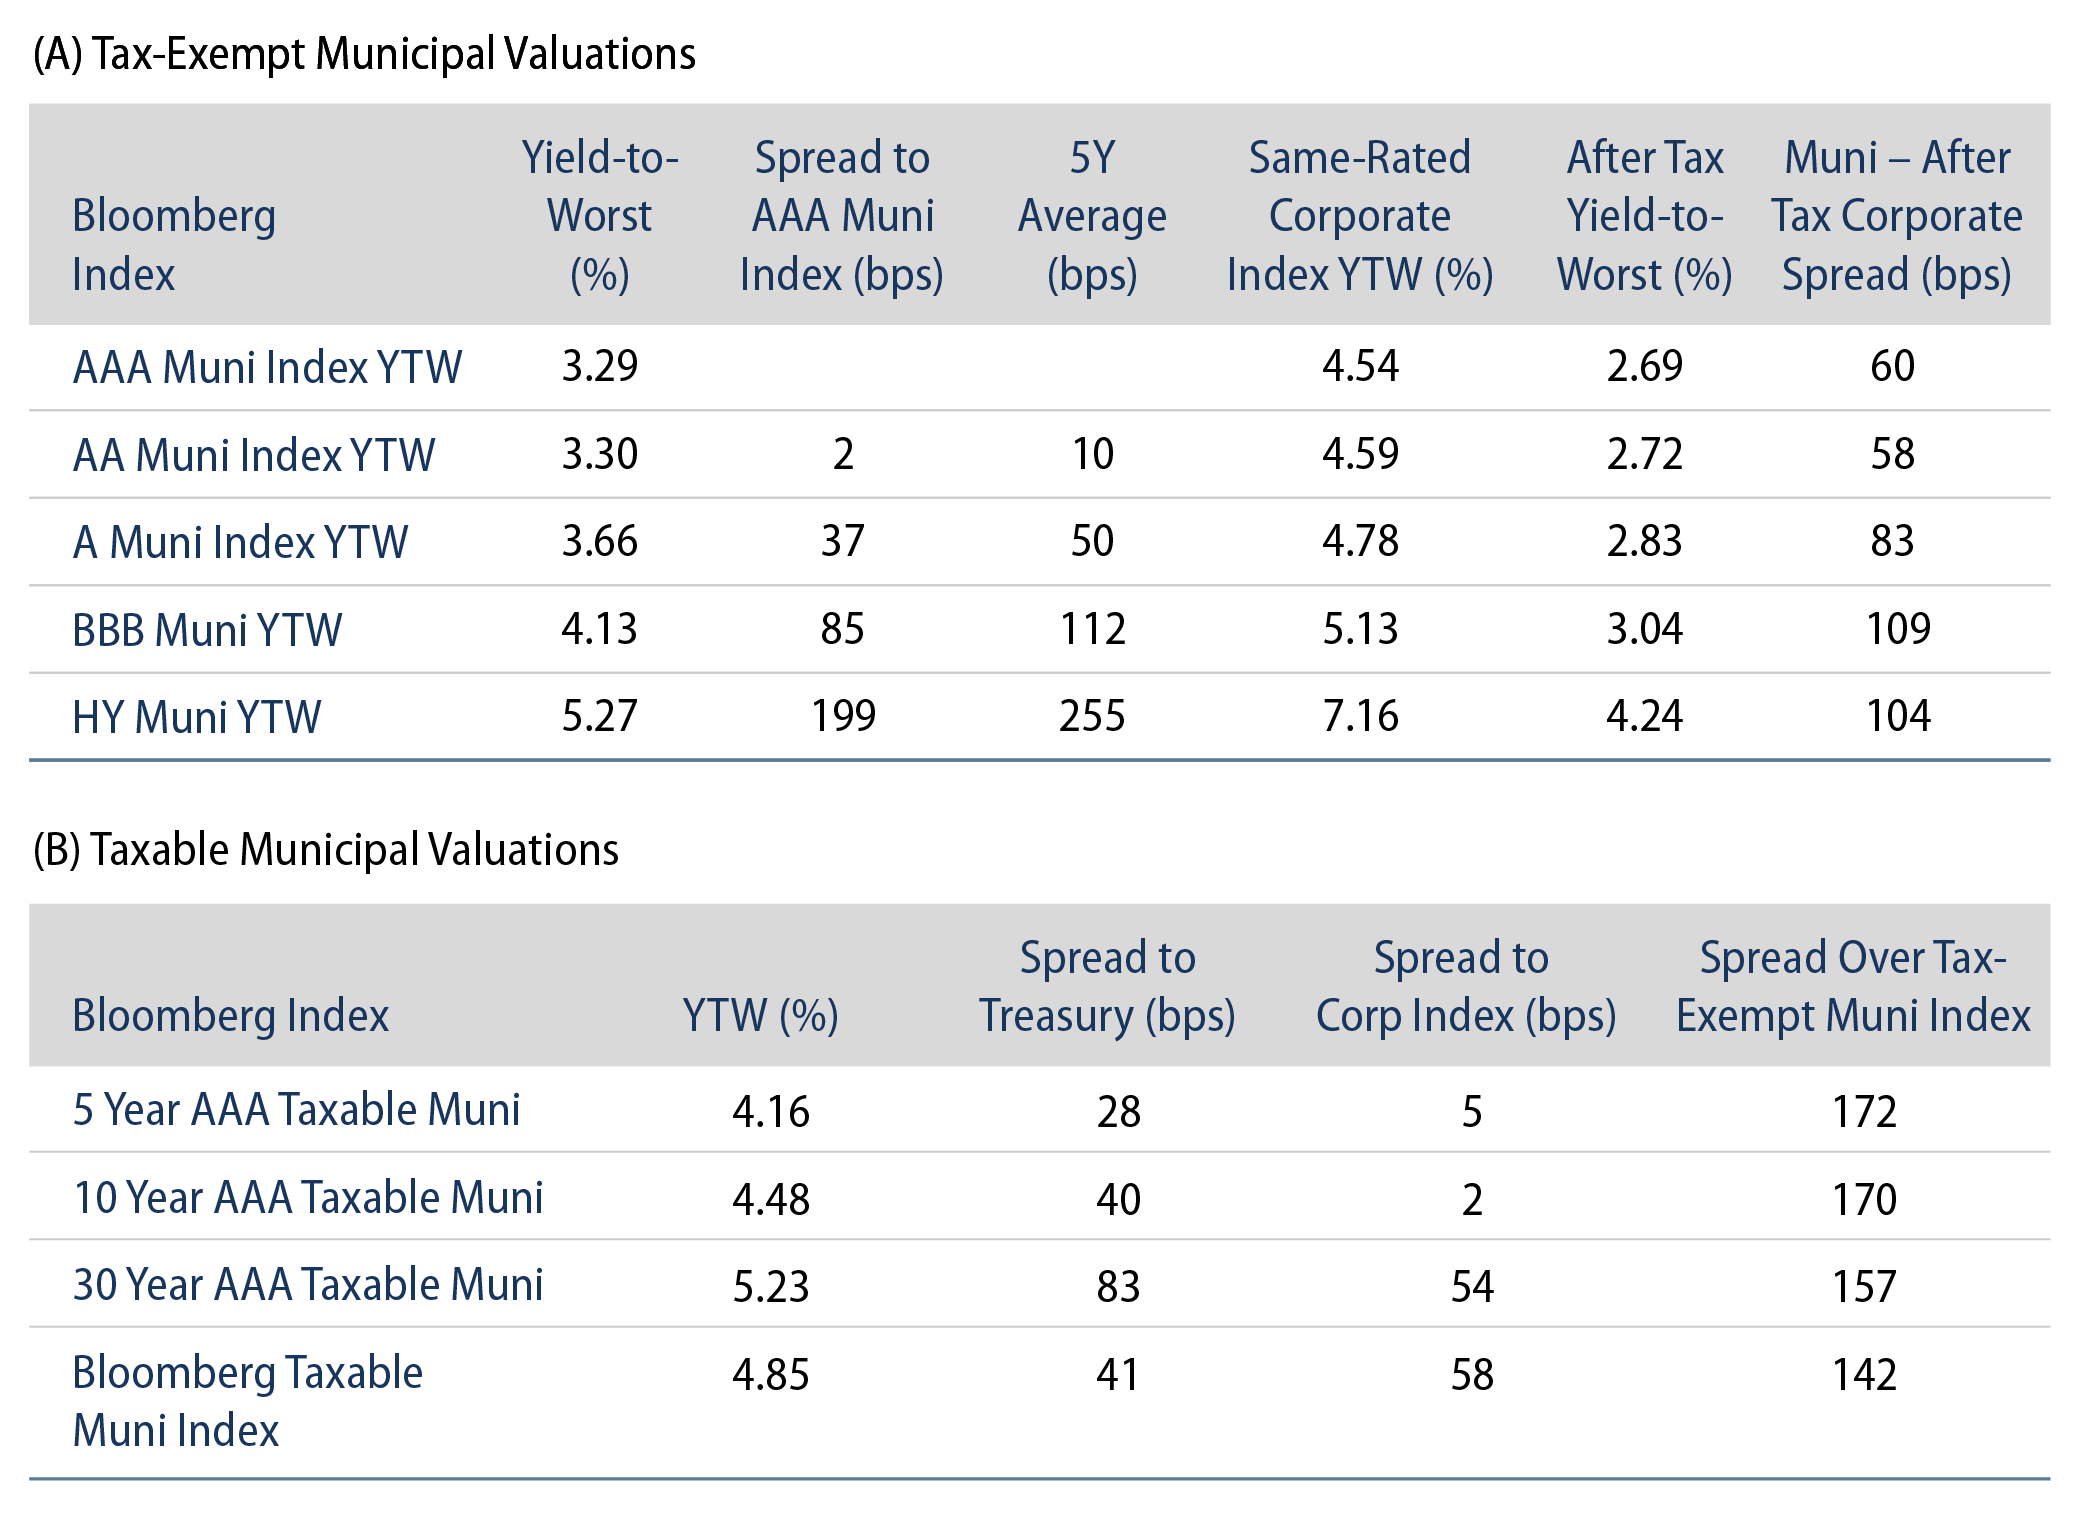
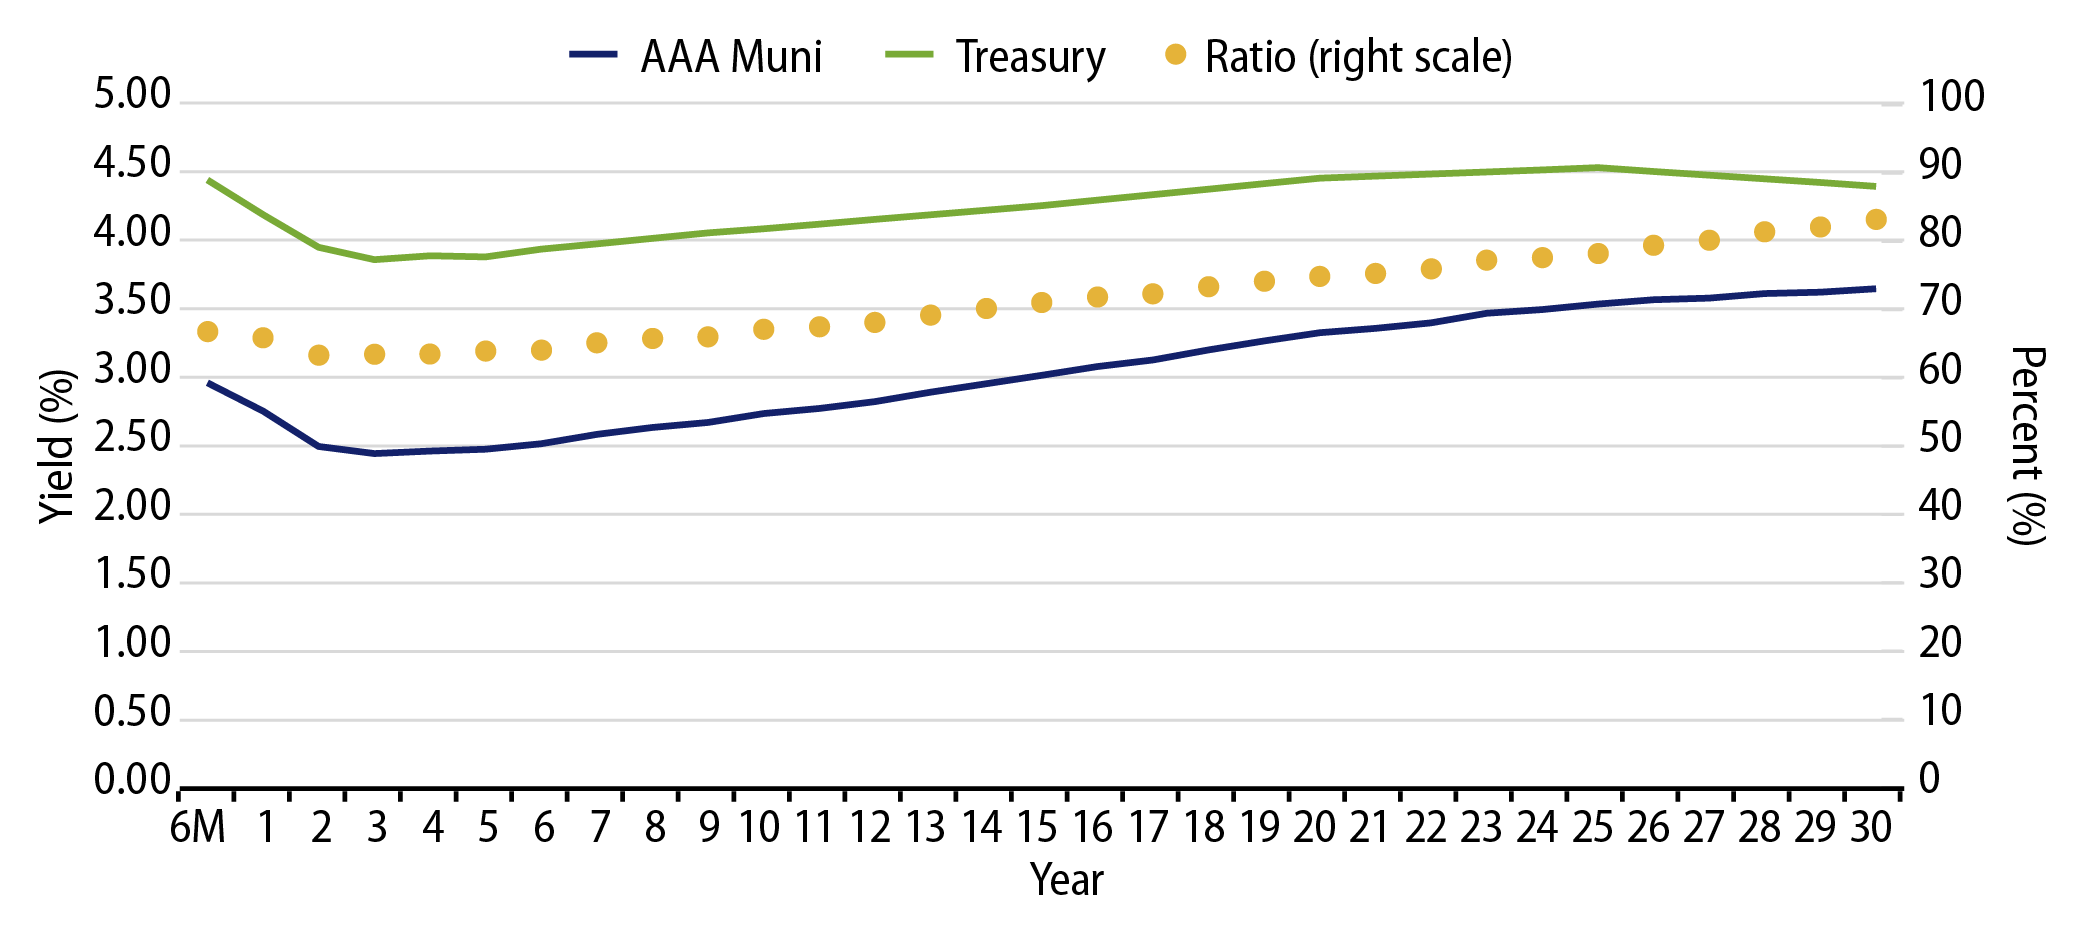
Considering current valuations, the 73% 20-Year Municipal/Treasury Ratio implies a 27% breakeven tax rate for a corporation to be indifferent between a AAA municipal bond and a Treasury bond, after taxes. The current 21% tax rate and a potential 15% Trump-proposed tax rate fall below the 27% breakeven level, indicating that corporations will likely find better value in Treasuries compared to top-quality municipal bonds and justifying the aforementioned declines in holdings. However, the Democrat-proposed rate of 28% falls above current breakeven valuations, implying that institutions can once again find value, albeit marginal, in municipals versus high-quality fixed income.

Exhibit 2: 20-Year AAA Muni/Treasury Breakeven Tax Rate vs. Potential Tax Policy
20-Year AAA Muni/Treasury Breakeven Tax Rate vs. Potential Tax Policy
Source: Bloomberg, Western Asset. As of 18 Oct 24. Taxable-equivalent yield is reflective of the tax rates in each scenario. Select the image to expand the view.

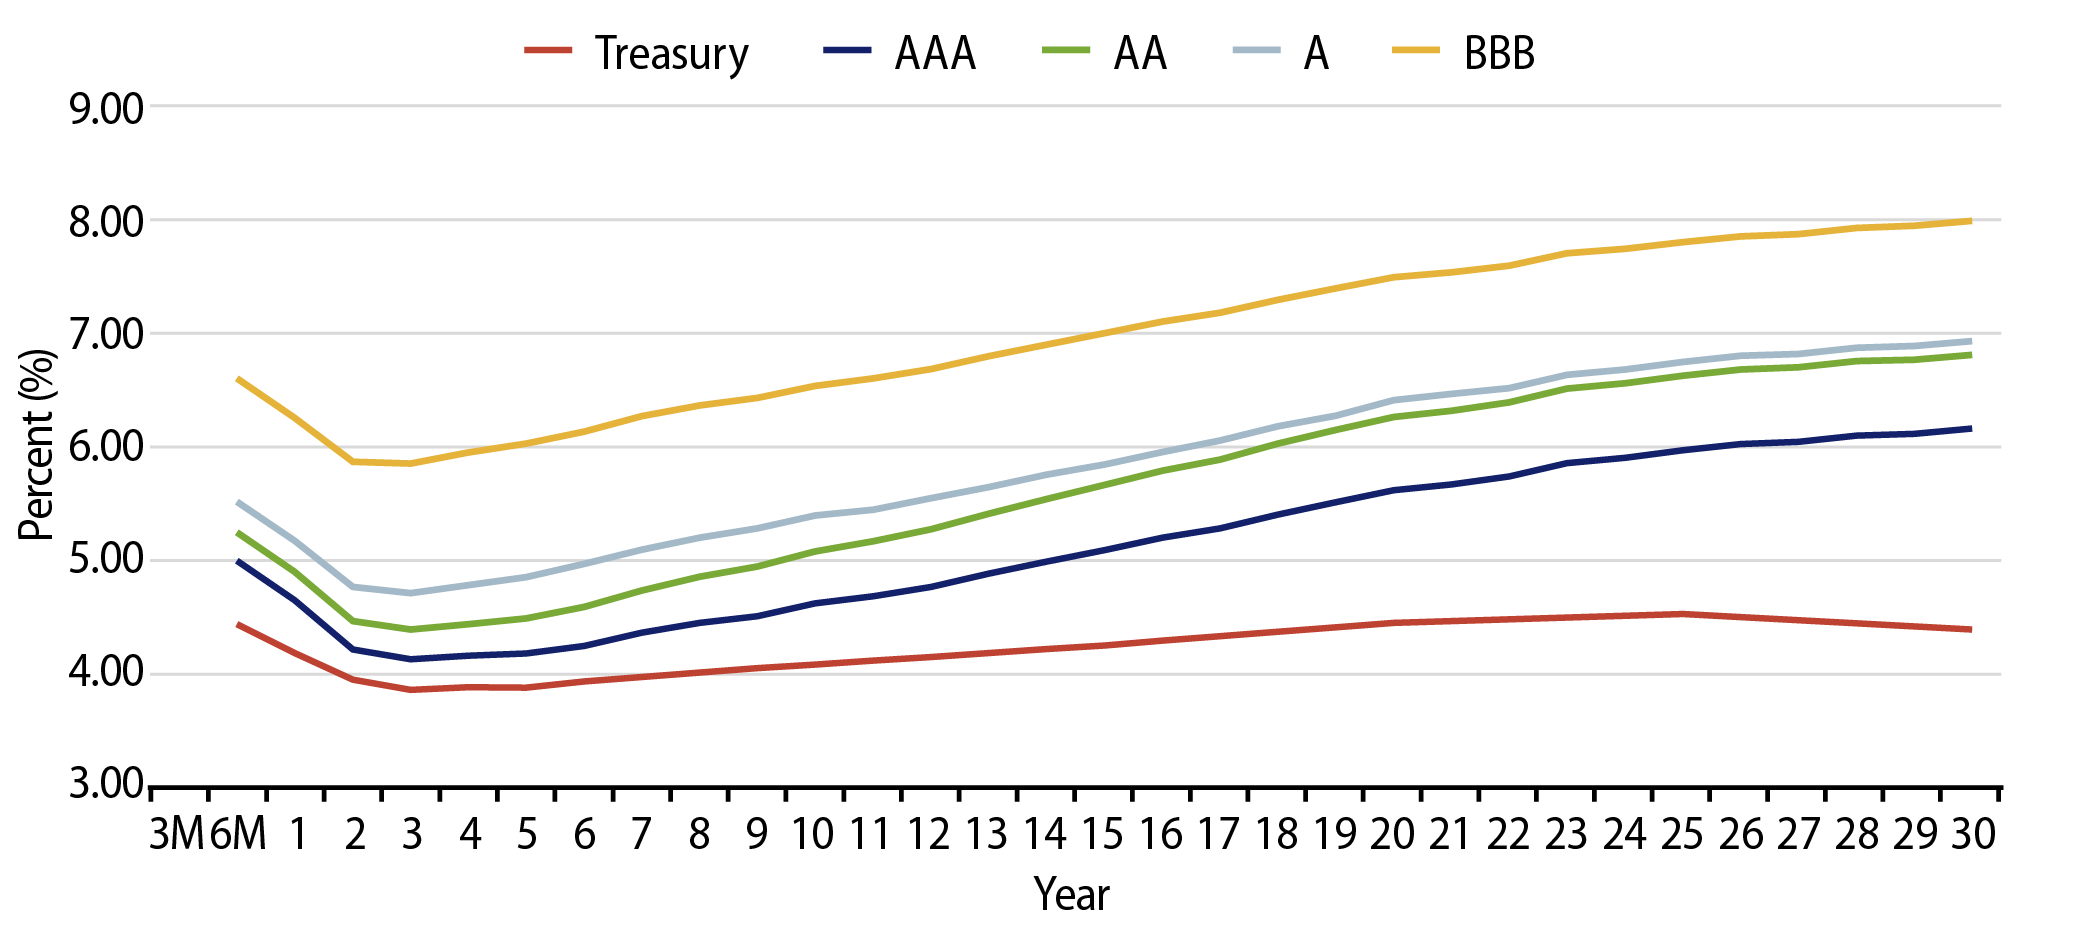
Municipal Credit Curves and Relative Value

Exhibit 3: Muni Credit Curves
Muni Credit Curves
Source: Bloomberg, Western Asset. As of 18 Oct 24. Bloomberg BVAL Municipal Credit Indices (AAA, AA, A, BBB, respectively) and US Sovereign Curves. Taxable-Equivalent Muni Credit Curves consider the top marginal effective tax rate of 40.8%. Select the image to expand the view.
Exhibit 4: Taxable-Equivalent Muni Credit Curves
Taxable-Equivalent Muni Credit Curves
Source: Bloomberg, Western Asset. As of 18 Oct 24. Bloomberg BVAL Municipal Credit Indices (AAA, AA, A, BBB, respectively) and US Sovereign Curves. Taxable-Equivalent Muni Credit Curves consider the top marginal effective tax rate of 40.8%. Select the image to expand the view.
Exhibit 5: AAA Munis vs. Treasuries
AAA Munis vs. Treasuries
Source: Muni Yields: Thomson Reuters MMD, Treasury Yields: Bloomberg. As of 18 Oct 24. Past performance is not a guarantee of future results. It is not possible to invest directly in an index. Select the image to expand the view.
Exhibit 6: Tax-Exempt and Taxable Muni Valuations
Tax-Exempt and Taxable Muni Valuations
Source: Bloomberg. Yield-to-worst (YTW) is the lowest potential yield that can be received on a bond without the issuer actually defaulting. As of 18 Oct 24. Select the image to expand the view.

Western Asset Key Themes for Muni Investors

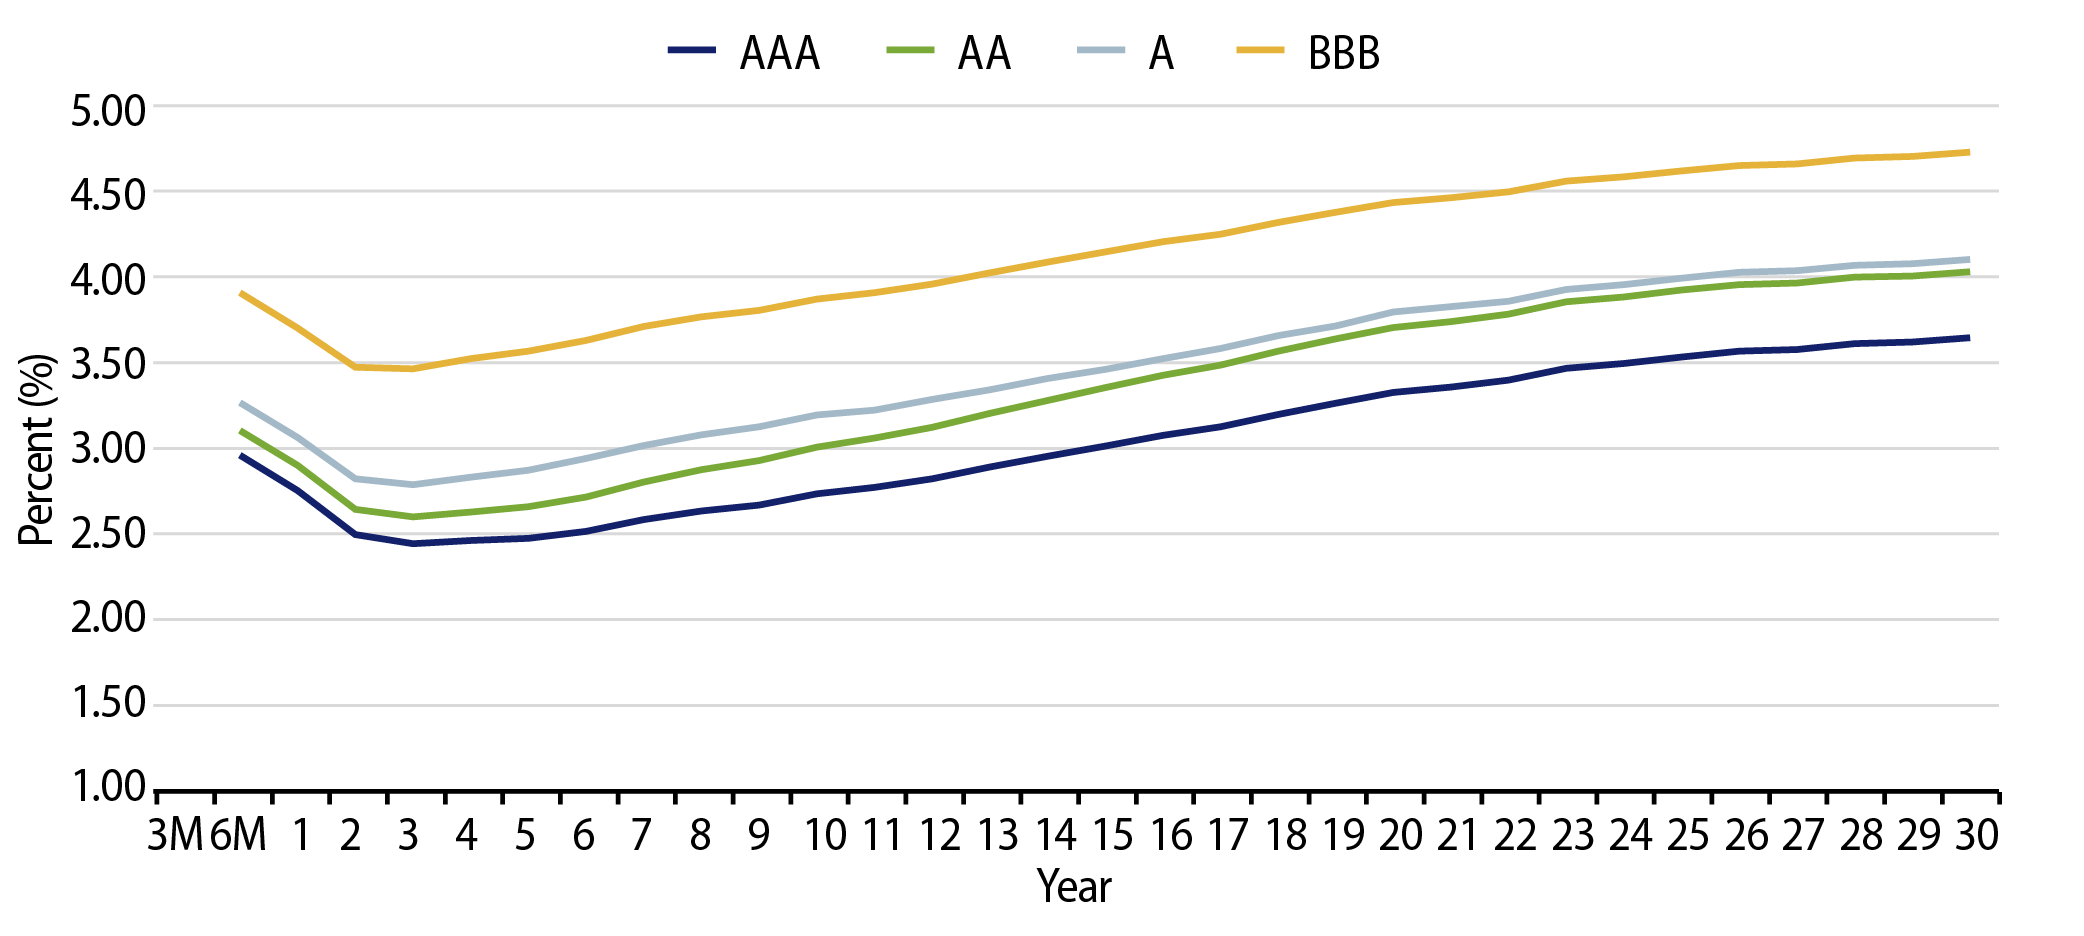
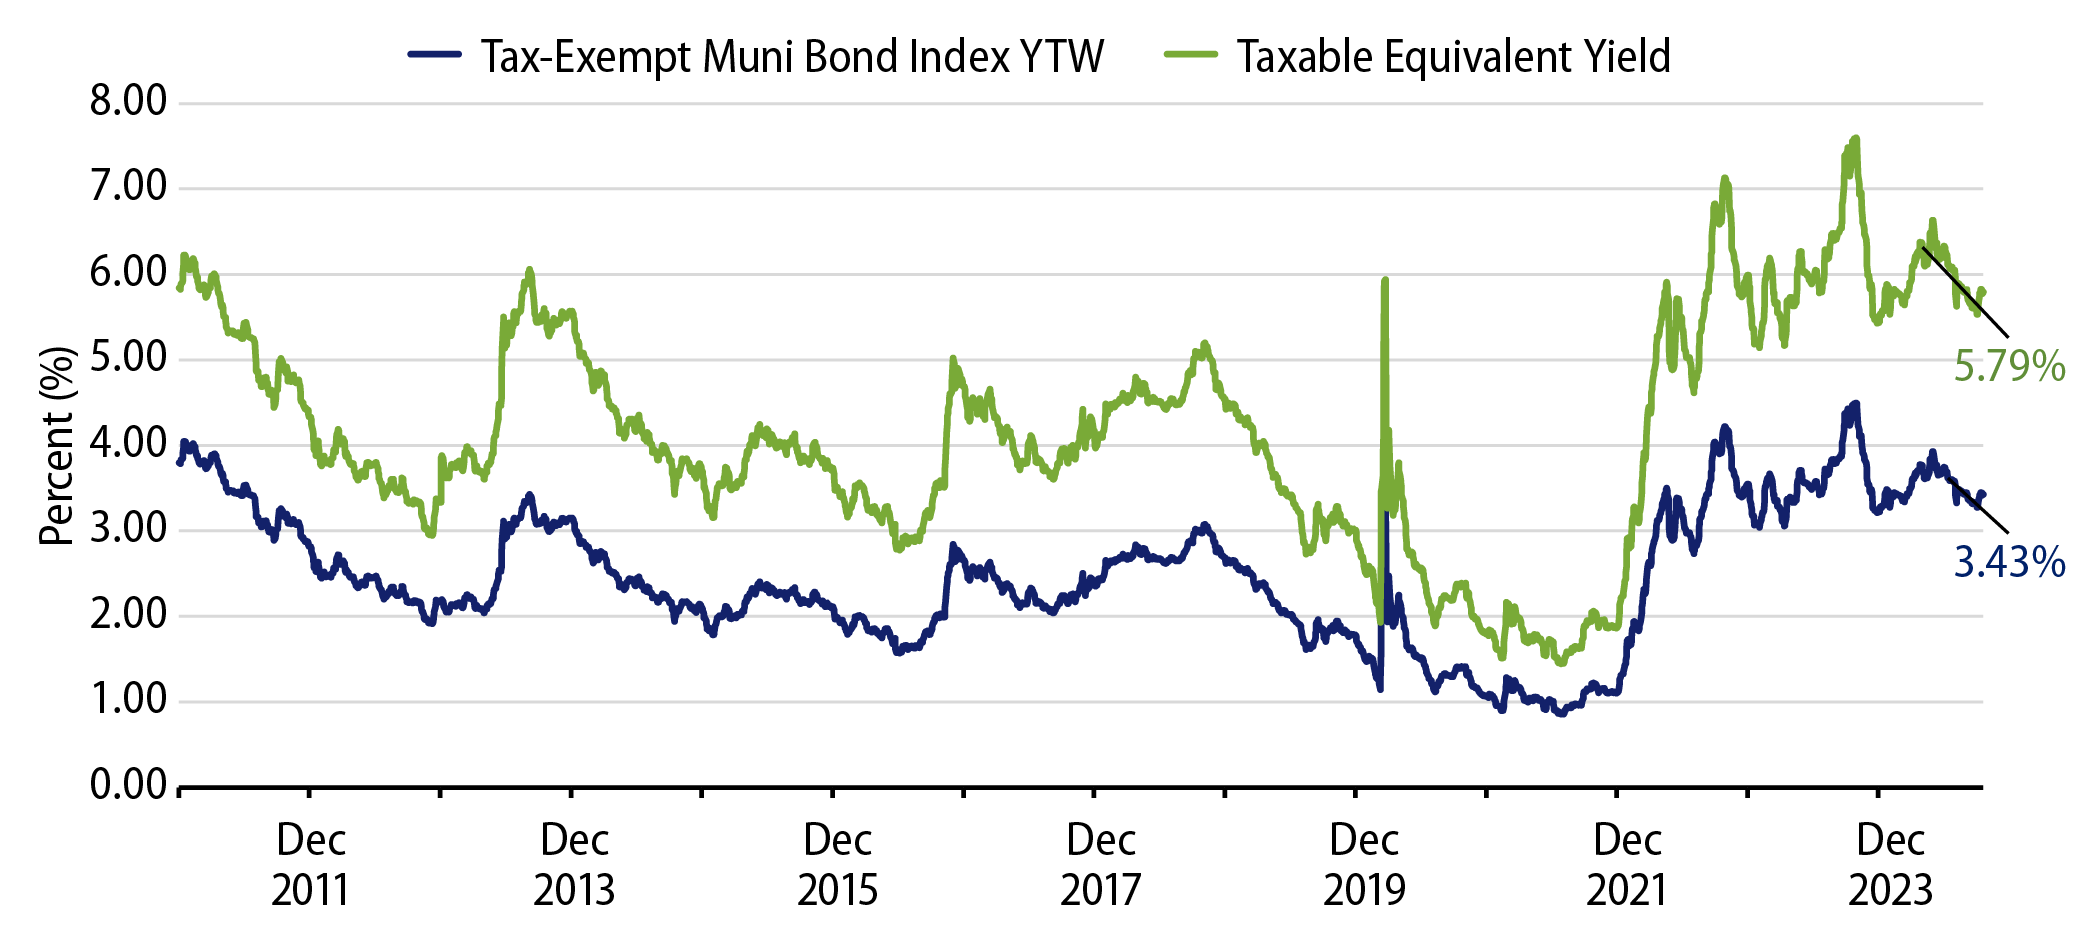
Theme #1: Municipal taxable-equivalent yields remain above decade averages.

Exhibit 7: Muni and Taxable-Equivalent Muni Yield-to-Worst
 Muni and Taxable-Equivalent Muni Yield-to-Worst
Source: Bloomberg, Western Asset. As of 18 Oct 24. Bloomberg Municipal Bond Index yield considering highest marginal tax rate of 40.8%. Indexes are unmanaged and one cannot directly invest in them. They do not include fees, expenses or sales charges. Past performance is not an indicator or a guarantee of future results. Select the image to expand the view.

Theme #2: The muni yield curve has largely disinverted, offering better rolldown opportunity in intermediate maturities.

Exhibit 8: AAA Municipal vs. Treasury Yield Curves
AAA Municipal vs. Treasury Yield Curves
Source: Bloomberg, Western Asset. As of 18 Oct 24. Bloomberg Valuation Service (BVAL) AAA Muni Curve and US On-/Off-the-Run Sovereign Curve. Indexes are unmanaged and one cannot directly invest in them. They do not include fees, expenses or sales charges. Past performance is not an indicator or a guarantee of future results. Select the image to expand the view.

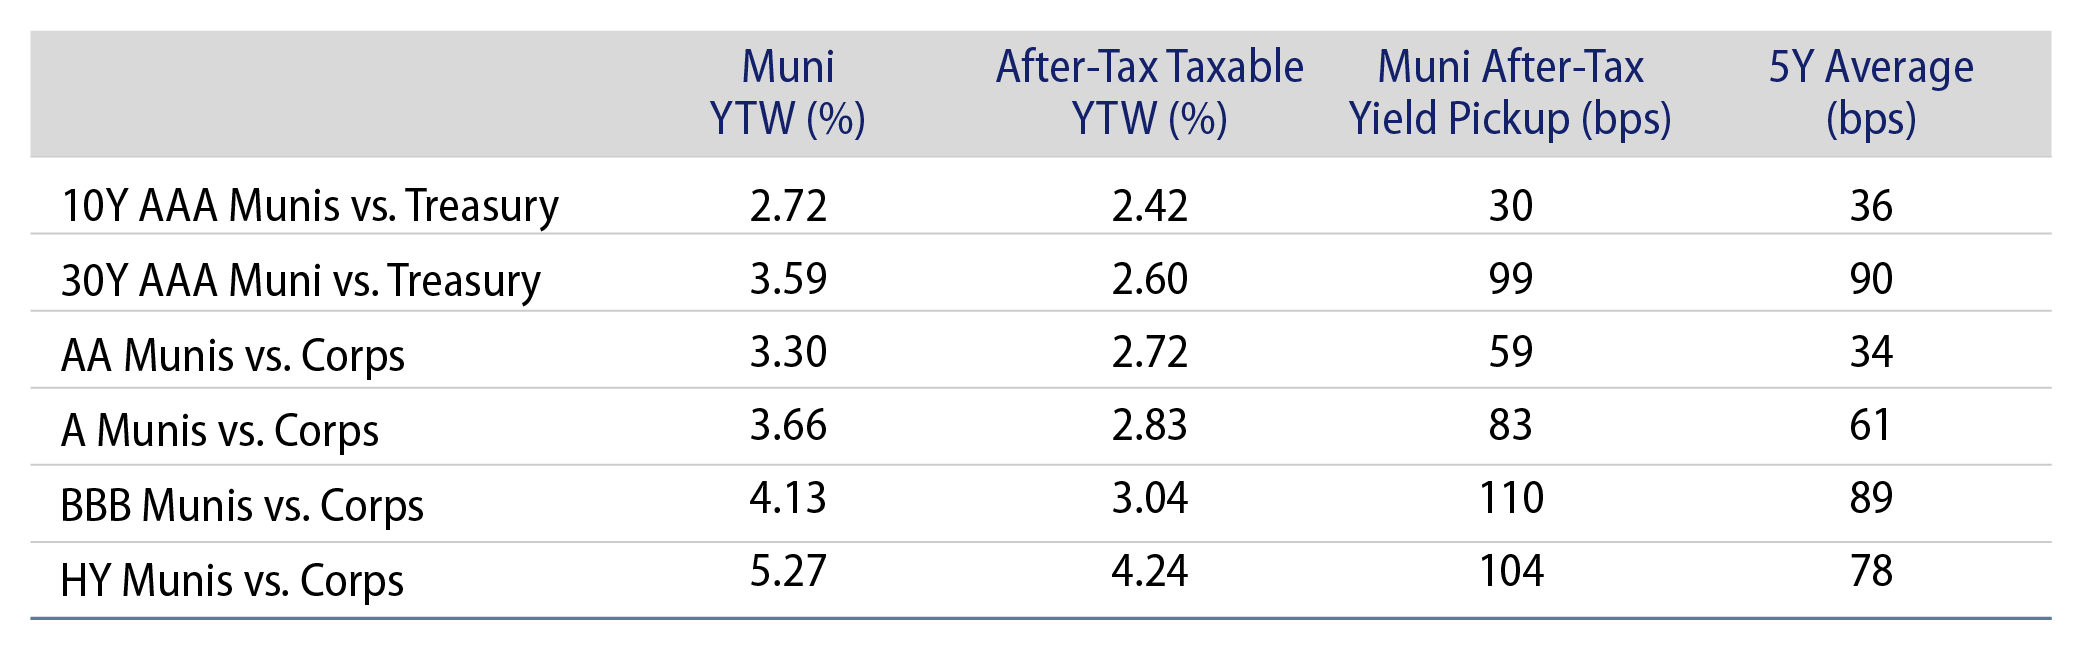
Theme #3: Munis offer attractive after-tax yield pickup versus longer-dated Treasuries and investment-grade corporate credit.

Exhibit 9: Municipal vs. Taxable Fixed-Income Yields by Quality
Municipal vs. Taxable Fixed-Income Yields by Quality
Source: Western Asset, Bloomberg. As 18 Oct 24. 10- and 30-Year comparison reflects Bloomberg Valuation Service (BVAL) AAA Muni Curve and US On-/Off-the-Run Sovereign Curve. AA Muni reflects the Bloomberg AA Muni Bond Index. A Muni reflects the Bloomberg A Muni Bond Index. BBB Muni reflects the Bloomberg BBB Muni Bond Index. HY Muni reflects the Bloomberg High Yield Muni Bond Index. AA Corp reflects the Bloomberg AA Corporate Bond Index. A Corp reflects the Bloomberg A Corporate Bond Index. BBB Corp reflects the Bloomberg BBB Corporate Bond Index. After-tax yield considers top marginal tax rate of 40.8%. Indexes are unmanaged and one cannot directly invest in them. They do not include fees, expenses or sales charges. Past performance is not an indicator or a guarantee of future results. Select the image to expand the view.

© Western Asset Management Company, LLC 2025. The information contained in these materials ("the materials") is intended for the exclusive use of the designated recipient ("the recipient"). This information is proprietary and confidential and may contain commercially sensitive information, and may not be copied, reproduced or republished, in whole or in part, without the prior written consent of Western Asset Management Company ("Western Asset").
Past performance does not predict future returns. These materials should not be deemed to be a prediction or projection of future performance. These materials are intended for investment professionals including professional clients, eligible counterparties, and qualified investors only.
These materials have been produced for illustrative and informational purposes only. These materials contain Western Asset's opinions and beliefs as of the date designated on the materials; these views are subject to change and may not reflect real-time market developments and investment views.
Third party data may be used throughout the materials, and this data is believed to be accurate to the best of Western Asset's knowledge at the time of publication, but cannot be guaranteed. These materials may also contain strategy or product awards or rankings from independent third parties or industry publications which are based on unbiased quantitative and/or qualitative information determined independently by each third party or publication. In some cases, Western Asset may subscribe to these third party's standard industry services or publications. These standard subscriptions and services are available to all asset managers and do not influence rankings or awards in any way.
Investment strategies or products discussed herein may involve a high degree of risk, including the loss of some or all capital. Investments in any products or strategies described in these materials may be volatile, and investors should have the financial ability and willingness to accept such risks.
Unless otherwise noted, investment performance contained in these materials is reflective of a strategy composite. All other strategy data and information included in these materials reflects a representative portfolio which is an account in the composite that Western Asset believes most closely reflects the current portfolio management style of the strategy. Performance is not a consideration in the selection of the representative portfolio. The characteristics of the representative portfolio shown may differ from other accounts in the composite. Information regarding the representative portfolio and the other accounts in the composite are available upon request. Statements in these materials should not be considered investment advice. References, either general or specific, to securities and/or issuers in the materials are for illustrative purposes only and are not intended to be, and should not be interpreted as, recommendation to purchase or sell such securities. Employees and/or clients of Western Asset may have a position in the securities or issuers mentioned.
These materials are not intended to provide, and should not be relied on for, accounting, legal, tax, investment or other advice. The recipient should consult its own counsel, accountant, investment, tax, and any other advisers for this advice, including economic risks and merits, related to making an investment with Western Asset. The recipient is responsible for observing the applicable laws and regulations of their country of residence.
Founded in 1971, Western Asset Management Company is a global fixed-income investment manager with offices in Pasadena, New York, London, Singapore, Tokyo, Melbourne, São Paulo, Hong Kong, and Zürich. Western Asset is a wholly owned subsidiary of Franklin Resources, Inc. but operates autonomously. Western Asset is comprised of six legal entities across the globe, each with distinct regional registrations: Western Asset Management Company, LLC, a registered Investment Adviser with the Securities and Exchange Commission; Western Asset Management Company Ltda. is regulated by Comissão de Valores Mobiliários; Western Asset Management Company Pty Ltd ABN 41 117 767 923 is the holder of the Australian Financial Services License 303160; Western Asset Management Company Pte. Ltd. Co. Reg. No. 200007692R is a holder of a Capital Markets Services License for fund management and regulated by the Monetary Authority of Singapore; Western Asset Management Company Ltd, a registered Financial Instruments Business Operator and regulated by the Financial Services Agency of Japan; and Western Asset Management Company Limited is authorised and regulated by the Financial Conduct Authority ("FCA") (FRN 145930). This communication is intended for distribution to Professional Clients only if deemed to be a financial promotion in the UK as defined by the FCA. This communication may also be intended for certain EEA countries where Western Asset has been granted permission to do so. For the current list of the approved EEA countries please contact Western Asset at +44 (0)20 7422 3000.