skip navigation
Blog

Stay up to date on timely topics and market events. Subscribe to our Blog now.

MARKETS
28 January 2025

Weekly Municipal Monitor—California Fires

By Sam Weitzman

Stay up to date on timely topics and market events. Subscribe to our Blog now.

Macros, Markets and Munis

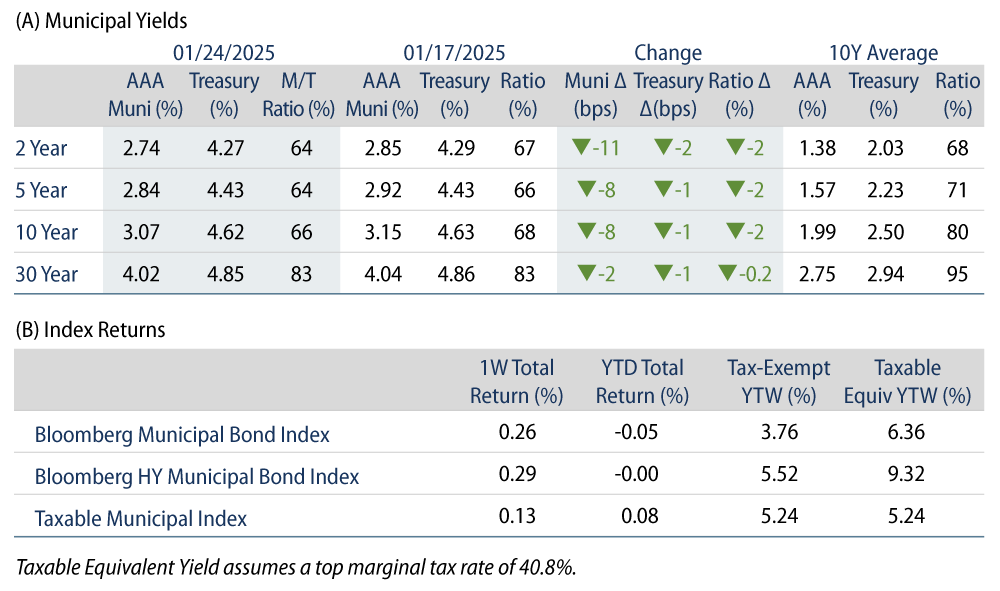
Munis posted positive returns last week as yields decreased. Fixed-income yields moved modestly lower amid weaker services Purchasing Managers’ Index (PMI) and consumer sentiment data. Muni yields outperformed Treasuries across the curve against a backdrop of improved demand from both SMAs and funds, which recorded an uptick in inflows last week. Meanwhile, technicals strengthened as fund flows turned positive. This week we highlight the Los Angeles regional wildfires and their potential implications on muni credit. Before delving into the details, we want to first acknowledge the human toll of these fires and the profound impact they have had on many of our team members, our loved ones and our broader community.

Technicals Strengthen as Fund Flows Turn Positive

Fund Flows (up $2.0 billion): During the week ending January 22, weekly reporting municipal mutual funds recorded $2 billion of net inflows according to Lipper. Long-term funds recorded $1.5 billion of inflows, intermediate funds recorded $215 million of inflows, and high yield funds recorded $556 million of inflows. Last week’s inflows led year-to-date inflows higher to $3 billion.

Supply (YTD supply of $11 billion): The muni market recorded $11 billion of new issue supply last week, modestly lower from the prior week but still relatively elevated versus longer-term averages. So far through January, the muni market has recorded $31 billion of new issuance, predominantly comprised of tax-exempt issuance. This week’s calendar is expected to decline to $10 billion. The largest deals include $1.1 billion Oklahoma Turnpike Authority and $836 million Columbus Regional Airport Authority transactions.

This Week in Munis: California Fires

The devastating wildfire damage in Los Angeles will likely represent one of the costliest disasters in the nation’s history, with some estimates surpassing $250 billion. Investor attention has understandably turned to affected municipalities’ ability to manage through the costs of recovery, revenue disruptions and potential liabilities. While headlines and near-term uncertainty could drive price volatility of impacted issuers, the municipal market has a favorable history of managing through significant natural disasters. We expect the Los Angeles regional economy and affected issuers to recover and support municipal debt.

Notable significant natural disasters since 2000 include Hurricane Katrina in 2005 ($201 billion in damages according to NCEI), Hurricane Harvey in 2017 ($160 billion), Hurricane Ian in 2022 ($120 billion) and the Butte County Camp Fire in 2018 ($100 billion). During these events, municipalities received a significant degree of federal and state aid to maintain budgetary flexibility and avoid any material payment default among traditional tax-supported and public utility debt. It is typical to see downgrades and negative ratings watches during these events. Notably, during the November 2018 Camp Fire, S&P identified 10 school districts as downgrade candidates, but only one school district was downgraded a single notch to A-/Negative despite losing its entire facilities.

Considering the size and diversity of the Los Angeles tax base, as well as the economic importance to the region, we expect affected municipal issuers to emerge from the disaster with limited implications to long-term municipal credit. At this juncture, we estimate less than 5% of affected issuer-assessed valuations or customer bases to be impacted. We also expect significant federal and state support to help uphold credit conditions through the recovery period. However, we recognize the potential for downgrade risks considering that the potential legal liability can surface around the fire ignition or response which have yet to be officially established. So far this month, S&P downgraded Los Angeles Department of Water and Power from AA- to A, citing litigation concerns. All three major agencies have placed the city of Los Angeles and Los Angeles Department of Water and Power on a negative watch or outlook.

While the wildfire damage in Los Angeles is significant, the historical resilience of municipal issuers and anticipated federal and state support provides a basis for cautious optimism and potential opportunities for California investors. Western Asset has always considered issuer vulnerabilities to natural disasters in its credit research process. While we anticipate headlines to drive a potential for widening spread and price volatility among select issuers over the near-term, the potential for price overreactions could lead to longer-term opportunities within the California municipal debt complex.

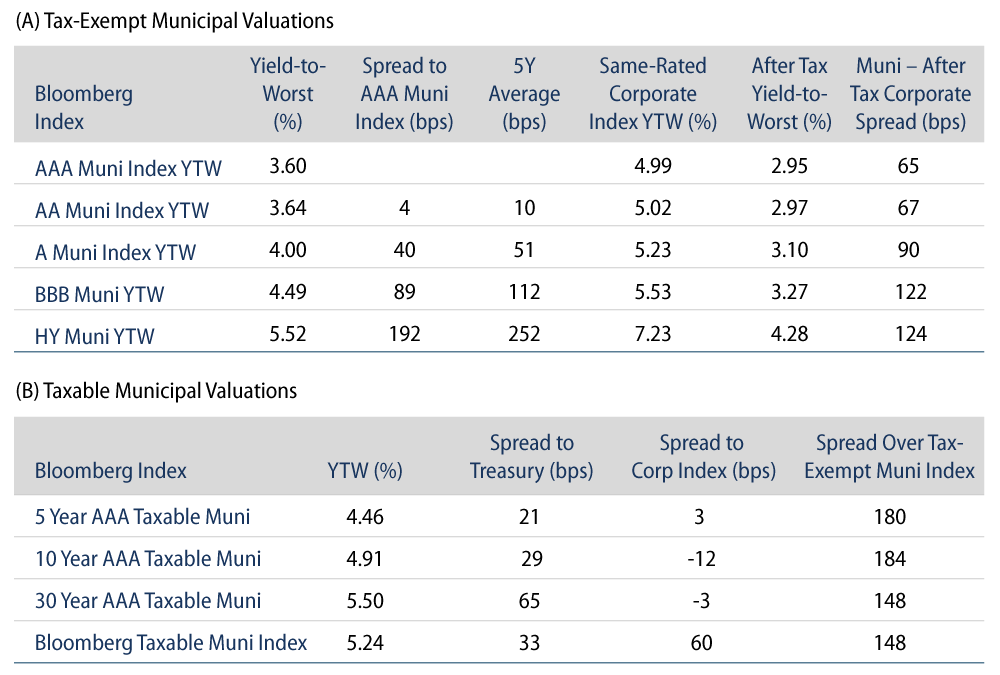
Municipal Credit Curves and Relative Value

Exhibit 1: Muni Credit Curves
Muni Credit Curves
Source: Bloomberg, Western Asset. As of 24 Jan 25. Bloomberg Valuation Service (BVAL) Municipal Credit Indices (AAA, AA, A, BBB, respectively) and US Sovereign Curves. Taxable-Equivalent Muni Credit Curves consider the top marginal effective tax rate of 40.8%. AA Muni is represented by the US General Obligation AA Muni BVAL Yield Curve. The BVAL curve is populated with pricing from uninsured AA General Obligation bonds. A Muni is represented by the US General Obligation A Muni BVAL Yield Curve. The BVAL curve is populated with pricing from uninsured A General Obligation bonds. BBB Muni is represented by the US General Obligation BBB Muni BVAL Yield Curve. The BVAL curve is populated with pricing from uninsured BBB General Obligation bonds. Indices are unmanaged and one cannot directly invest in them. They do not include fees, expenses or sales charges. Past performance is not an indicator or a guarantee of future results. Select the image to expand the view.
Exhibit 2: Taxable-Equivalent Muni Credit Curves
Taxable-Equivalent Muni Credit Curves
Source: Bloomberg, Western Asset. As of 24 Jan 25. Bloomberg Valuation Service (BVAL) Municipal Credit Indices (AAA, AA, A, BBB, respectively) and US Sovereign Curves. Taxable-Equivalent Muni Credit Curves consider the top marginal effective tax rate of 40.8%. AA Muni is represented by the US General Obligation AA Muni BVAL Yield Curve. The BVAL curve is populated with pricing from uninsured AA General Obligation bonds. A Muni is represented by the US General Obligation A Muni BVAL Yield Curve. The BVAL curve is populated with pricing from uninsured A General Obligation bonds. BBB Muni is represented by the US General Obligation BBB Muni BVAL Yield Curve. The BVAL curve is populated with pricing from uninsured BBB General Obligation bonds. Indices are unmanaged and one cannot directly invest in them. They do not include fees, expenses or sales charges. Past performance is not an indicator or a guarantee of future results. Select the image to expand the view.
Exhibit 3: AAA Munis vs. Treasuries
AAA Munis vs. Treasuries
Source: Muni Yields: Thomson Reuters MMD, Treasury Yields: Bloomberg. As of 24 Jan 25. Past performance is not a guarantee of future results. It is not possible to invest directly in an index. Select the image to expand the view.
Exhibit 4: Tax-Exempt and Taxable Muni Valuations
Tax-Exempt and Taxable Muni Valuations
Source: Bloomberg, Western Asset. Yield-to-worst (YTW) is the lowest potential yield that can be received on a bond without the issuer actually defaulting. AAA, AA, A, BBB Corporate Indices; After-Tax Yield assumes a top effective tax rate of 40.8%. Taxable Muni Index Corporate comparable used is the Global Corporate Aggregate (ex. BBB) to better align credit quality and duration. As of 24 Jan 25. Select the image to expand the view.

Western Asset Key Themes for Muni Investors

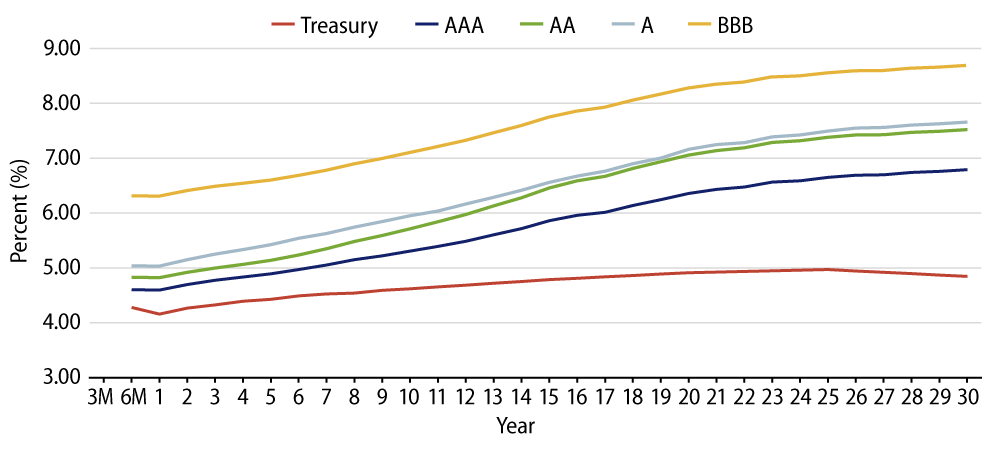
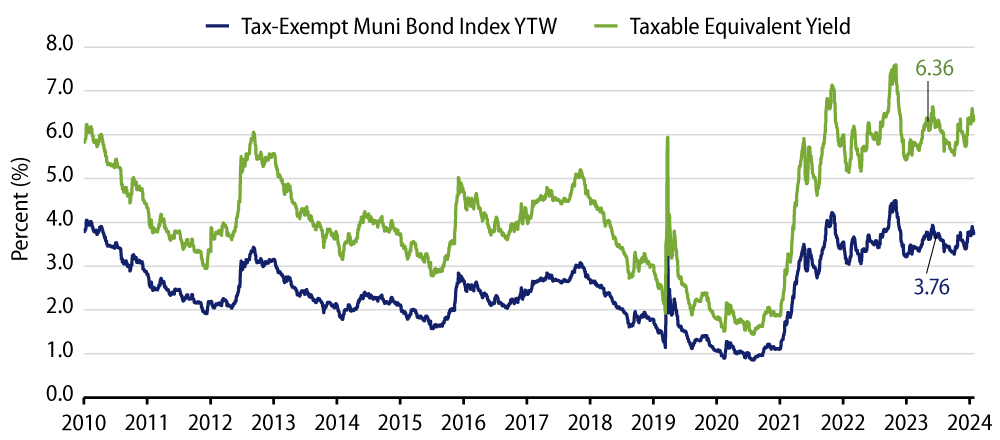
Theme #1: Municipal taxable-equivalent yields remain above decade averages.

Exhibit 5: Muni and Taxable-Equivalent Muni Yield-to-Worst
Muni and Taxable-Equivalent Muni Yield-to-Worst
Source: Bloomberg, Western Asset. As of 24 Jan 25. Bloomberg Municipal Bond Index yield considering highest marginal tax rate of 40.8%. Indexes are unmanaged and one cannot directly invest in them. They do not include fees, expenses or sales charges. Past performance is not an indicator or a guarantee of future results. Select the image to expand the view.

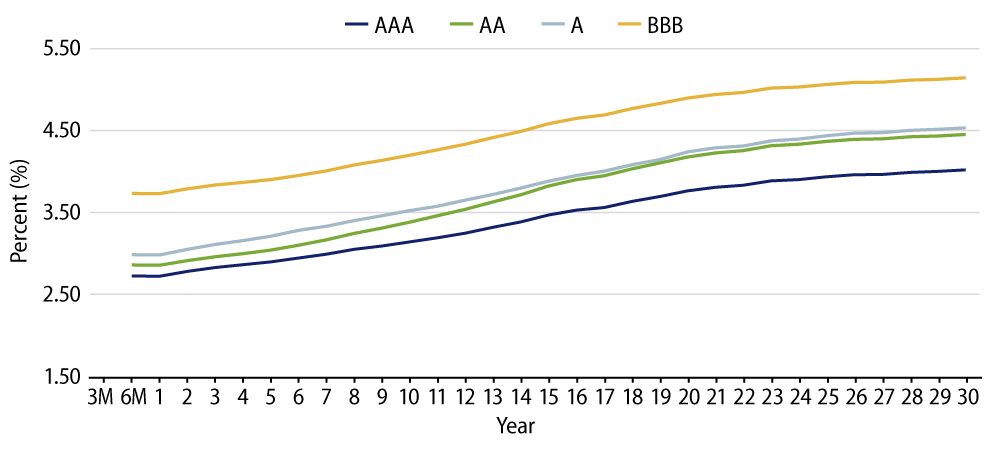
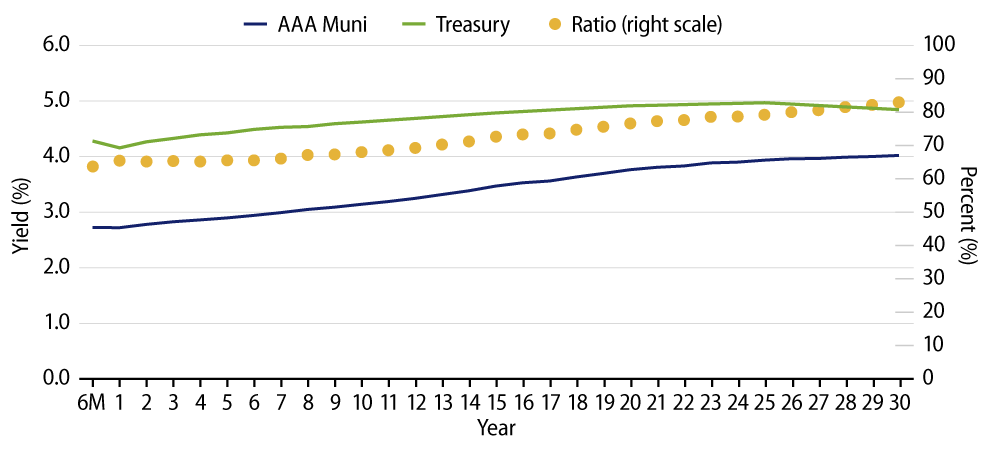
Theme #2: The muni curve has steepened, offering better roll-down value further out the curve.

Exhibit 6: AAA Municipal vs. Treasury Yield Curves
AAA Municipal vs. Treasury Yield Curves
Source: Bloomberg, Western Asset. As of 24 Jan 25. Bloomberg Valuation Service (BVAL) AAA Muni Curve and US On-/Off-the-Run Sovereign Curve. Indexes are unmanaged and one cannot directly invest in them. They do not include fees, expenses or sales charges. Past performance is not an indicator or a guarantee of future results. Select the image to expand the view.

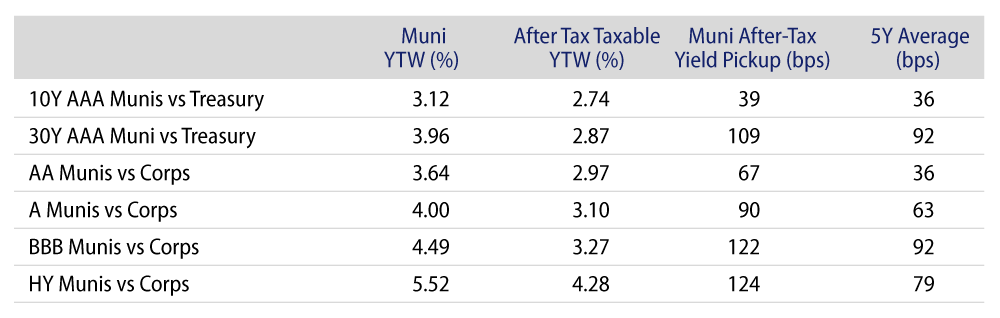
Theme #3: Munis offer attractive after-tax yield pickup versus longer-dated Treasuries and investment-grade corporate credit.

Exhibit 7: Municipal vs. Taxable Fixed-Income Yields by Quality
Municipal vs. Taxable Fixed-Income Yields by Quality
Source: Western Asset, Bloomberg. As 24 Jan 25. 10- and 30-Year comparison reflects Bloomberg Valuation Service (BVAL) AAA Muni Curve and US On-/Off-the-Run Sovereign Curve. AA Muni reflects the Bloomberg AA Muni Bond Index. A Muni reflects the Bloomberg A Muni Bond Index. BBB Muni reflects the Bloomberg BBB Muni Bond Index. HY Muni reflects the Bloomberg High Yield Muni Bond Index. AA Corp reflects the Bloomberg AA Corporate Bond Index. A Corp reflects the Bloomberg A Corporate Bond Index. BBB Corp reflects the Bloomberg BBB Corporate Bond Index. After-tax yield considers top marginal tax rate of 40.8%. Indexes are unmanaged and one cannot directly invest in them. They do not include fees, expenses or sales charges. Past performance is not an indicator or a guarantee of future results. Select the image to expand the view.

© Western Asset Management Company, LLC 2025. The information contained in these materials ("the materials") is intended for the exclusive use of the designated recipient ("the recipient"). This information is proprietary and confidential and may contain commercially sensitive information, and may not be copied, reproduced or republished, in whole or in part, without the prior written consent of Western Asset Management Company ("Western Asset").
Past performance does not predict future returns. These materials should not be deemed to be a prediction or projection of future performance. These materials are intended for investment professionals including professional clients, eligible counterparties, and qualified investors only.
These materials have been produced for illustrative and informational purposes only. These materials contain Western Asset's opinions and beliefs as of the date designated on the materials; these views are subject to change and may not reflect real-time market developments and investment views.
Third party data may be used throughout the materials, and this data is believed to be accurate to the best of Western Asset's knowledge at the time of publication, but cannot be guaranteed. These materials may also contain strategy or product awards or rankings from independent third parties or industry publications which are based on unbiased quantitative and/or qualitative information determined independently by each third party or publication. In some cases, Western Asset may subscribe to these third party's standard industry services or publications. These standard subscriptions and services are available to all asset managers and do not influence rankings or awards in any way.
Investment strategies or products discussed herein may involve a high degree of risk, including the loss of some or all capital. Investments in any products or strategies described in these materials may be volatile, and investors should have the financial ability and willingness to accept such risks.
Unless otherwise noted, investment performance contained in these materials is reflective of a strategy composite. All other strategy data and information included in these materials reflects a representative portfolio which is an account in the composite that Western Asset believes most closely reflects the current portfolio management style of the strategy. Performance is not a consideration in the selection of the representative portfolio. The characteristics of the representative portfolio shown may differ from other accounts in the composite. Information regarding the representative portfolio and the other accounts in the composite are available upon request. Statements in these materials should not be considered investment advice. References, either general or specific, to securities and/or issuers in the materials are for illustrative purposes only and are not intended to be, and should not be interpreted as, recommendation to purchase or sell such securities. Employees and/or clients of Western Asset may have a position in the securities or issuers mentioned.
These materials are not intended to provide, and should not be relied on for, accounting, legal, tax, investment or other advice. The recipient should consult its own counsel, accountant, investment, tax, and any other advisers for this advice, including economic risks and merits, related to making an investment with Western Asset. The recipient is responsible for observing the applicable laws and regulations of their country of residence.
Founded in 1971, Western Asset Management Company is a global fixed-income investment manager with offices in Pasadena, New York, London, Singapore, Tokyo, Melbourne, São Paulo, Hong Kong, and Zürich. Western Asset is a wholly owned subsidiary of Franklin Resources, Inc. but operates autonomously. Western Asset is comprised of six legal entities across the globe, each with distinct regional registrations: Western Asset Management Company, LLC, a registered Investment Adviser with the Securities and Exchange Commission; Western Asset Management Company Ltda. is regulated by Comissão de Valores Mobiliários; Western Asset Management Company Pty Ltd ABN 41 117 767 923 is the holder of the Australian Financial Services License 303160; Western Asset Management Company Pte. Ltd. Co. Reg. No. 200007692R is a holder of a Capital Markets Services License for fund management and regulated by the Monetary Authority of Singapore; Western Asset Management Company Ltd, a registered Financial Instruments Business Operator and regulated by the Financial Services Agency of Japan; and Western Asset Management Company Limited is authorised and regulated by the Financial Conduct Authority ("FCA") (FRN 145930). This communication is intended for distribution to Professional Clients only if deemed to be a financial promotion in the UK as defined by the FCA. This communication may also be intended for certain EEA countries where Western Asset has been granted permission to do so. For the current list of the approved EEA countries please contact Western Asset at +44 (0)20 7422 3000.