skip navigation
Blog

Stay up to date on timely topics and market events. Subscribe to our Blog now.

MARKETS
05 March 2024

Weekly Municipal Monitor—Budget Season Begins

By Sam Weitzman

Stay up to date on timely topics and market events. Subscribe to our Blog now.

Municipals Posted Positive Returns Last Week

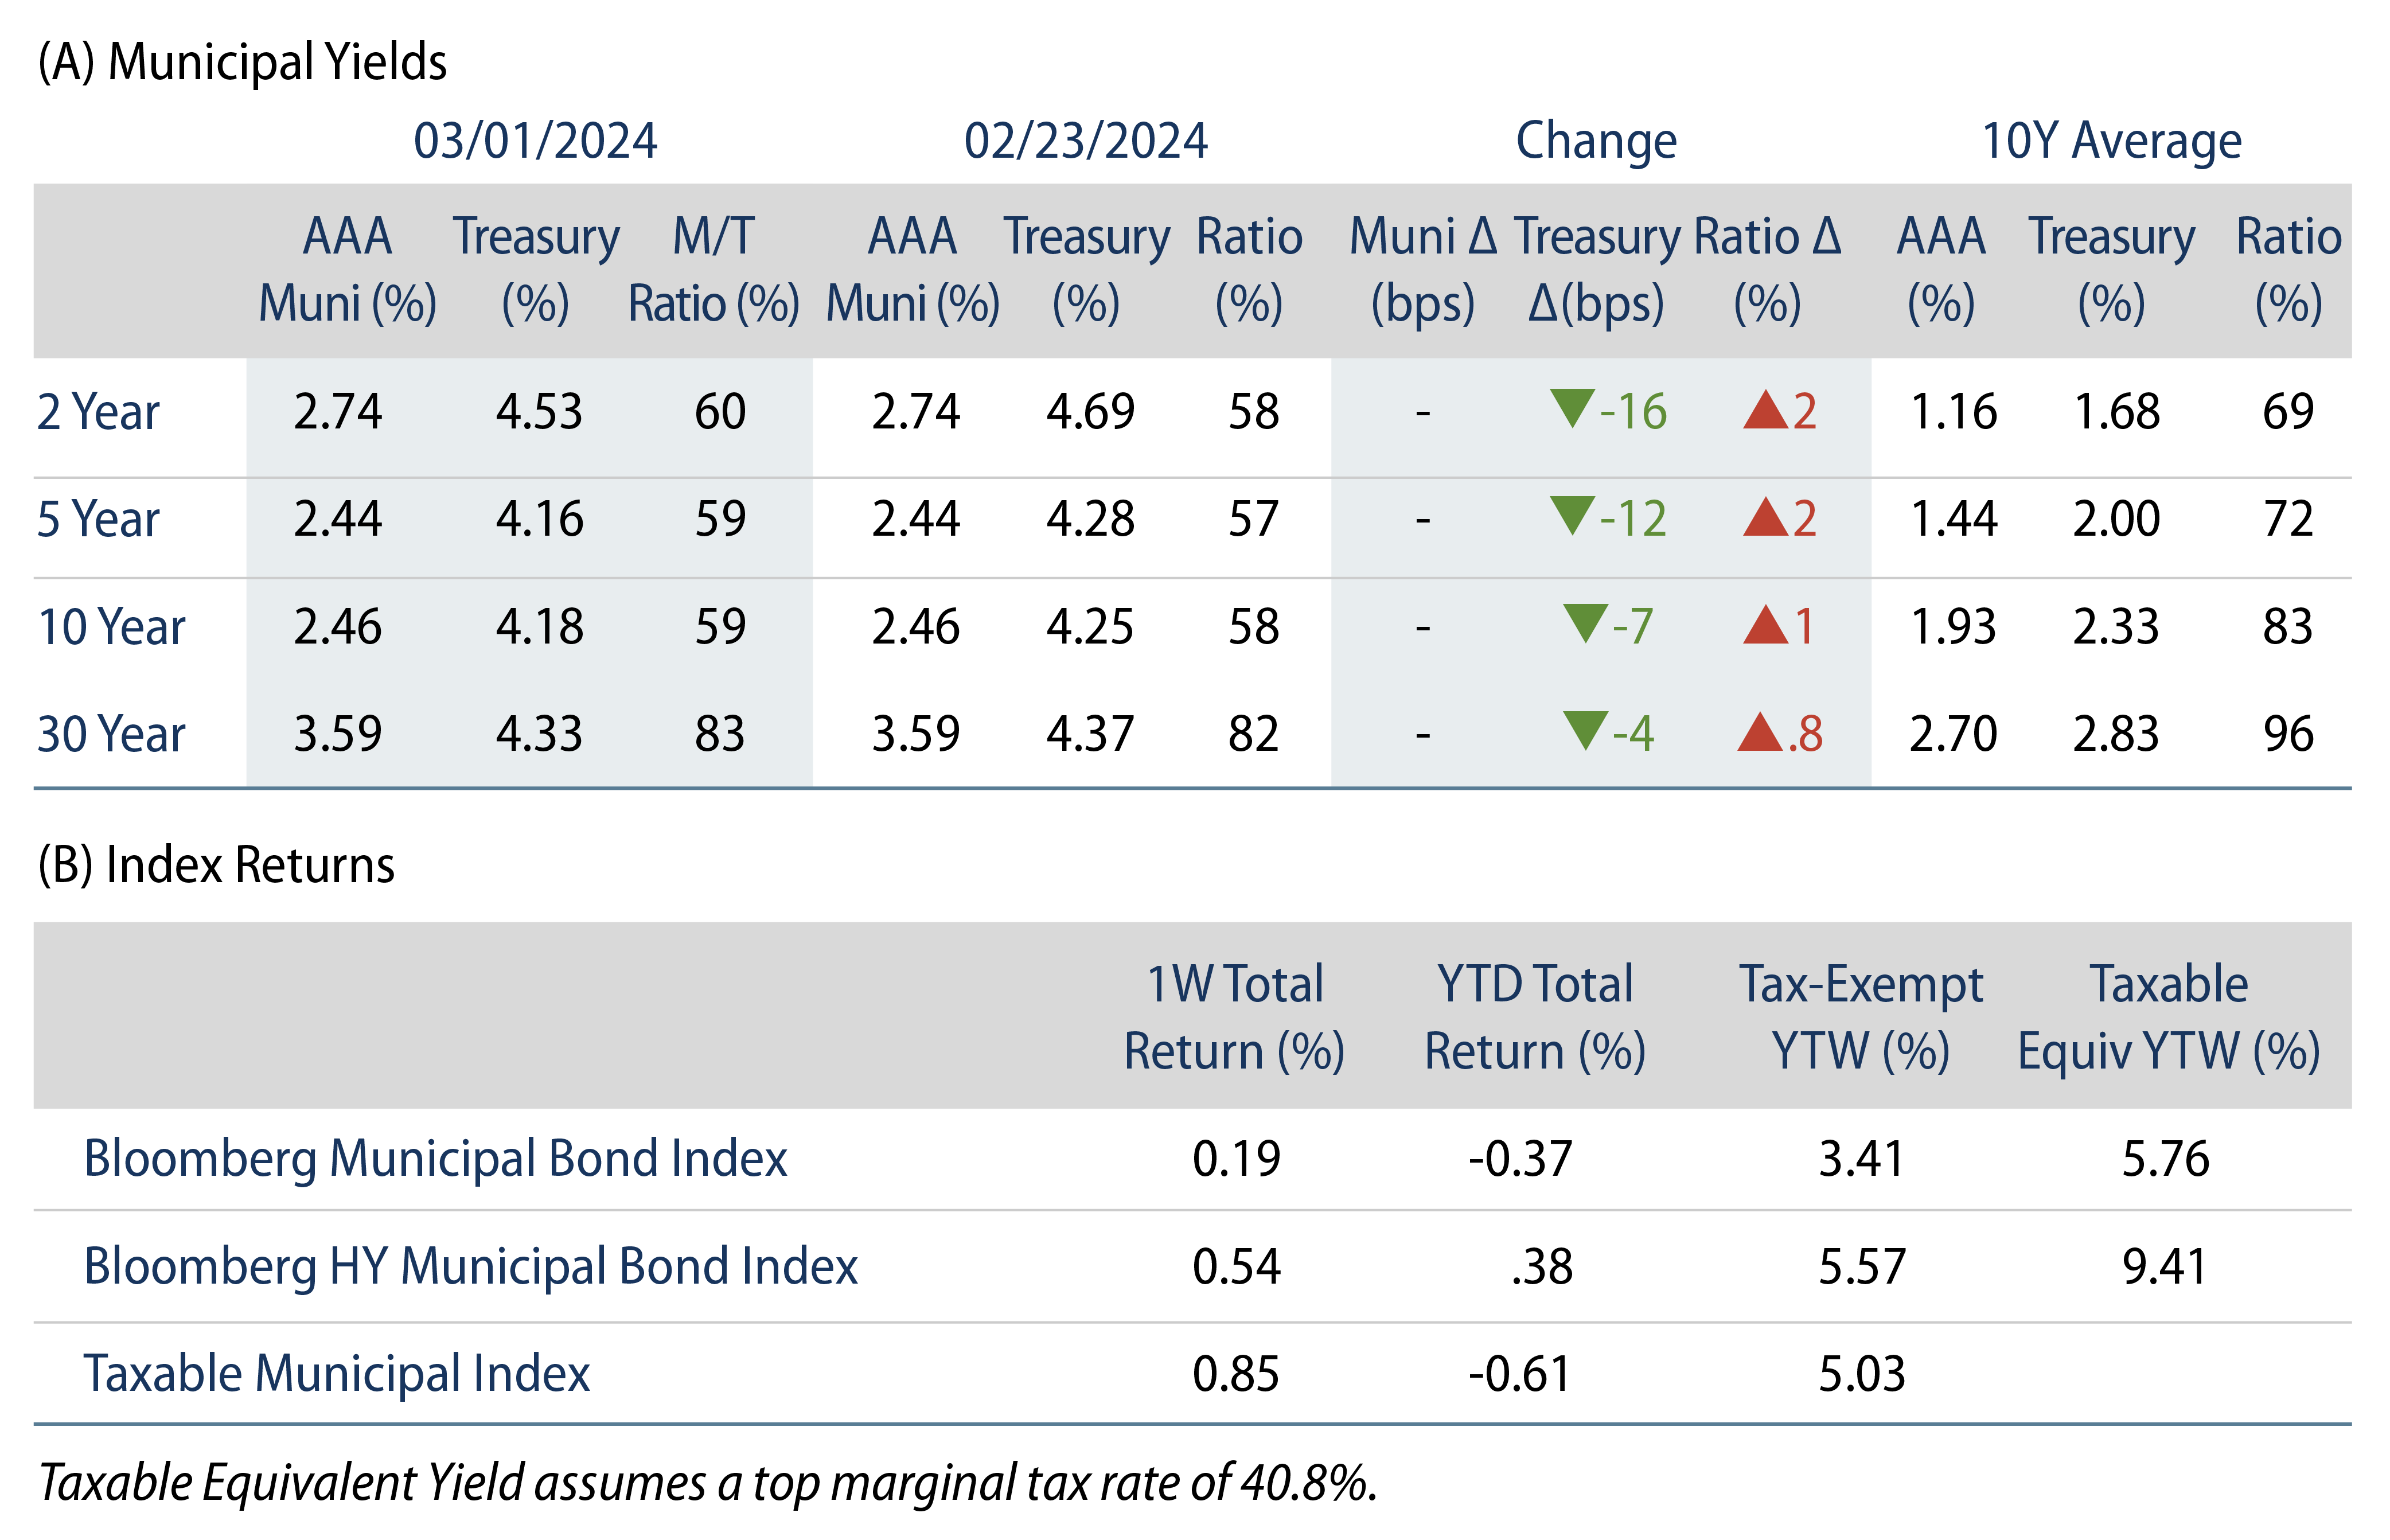
Munis posted positive returns, generally underperforming the Treasury rally during the week, as Personal Consumption Expenditure (PCE) figures continued to decelerate in line with consensus. High-grade muni yields were generally unchanged during the week. Meanwhile, technicals improved as municipal mutual funds recorded inflows. The Bloomberg Municipal Index returned 0.19% during the week, the High Yield Muni Index returned 0.54%, and the Taxable Muni Index returned 0.85%. This week we highlight key takeaways from the beginning of budget season.

Muni Technicals Improved as Funds Recorded Inflows

Fund Flows: During the week ending February 28, weekly reporting municipal mutual funds recorded $73 million of net inflows, according to Lipper. Long-term funds recorded $342 million of inflows and high-yield funds recorded $353 million of inflows. Intermediate funds recorded $274 million of outflows and short-term funds recorded $2 million of outflows. This week’s inflows lead estimated year-to-date (YTD) net inflows higher, to $4.6 billion.

Supply: The muni market recorded $8.4 billion of new issue volume last week, up 56% from the prior week. YTD issuance of $63 billion is 44% higher from last year’s level, with tax-exempt issuance 58% higher and taxable issuance 19% higher year-over year (YoY). This week’s calendar is expected to increase to remain healthy at $8 billion. The largest deals include $1.7 billion President and Fellows of Harvard College and $1 billion Regents of University of California transactions.

This Week in Munis: Budget Season Begins

This budget season, governors of the 33 states that enact annual budgets will finalize budget proposals for fiscal year 2025. These proposals provide insight into non-audited financial health of fiscal 2024, upcoming spending initiatives and outlook for the years ahead considering economic expectations. The fiscal 2025 budget cycle also provides insight into more normal post-pandemic conditions as return-to-office trends are normalized, and the economy continues to wean off of Federal Reserve (Fed) and stimulus support.

Exhibit 1: Year-over-Year General Fund Revenue Growth
Explore Year-over-Year General Fund Revenue Growth
Source: Fiscal 2025 New York, Illinois, and California Budgets. As of 16 Jan 24, New York; 21 Feb 24, Illinois; 10 Jan 24, California. Select the image to expand the view.

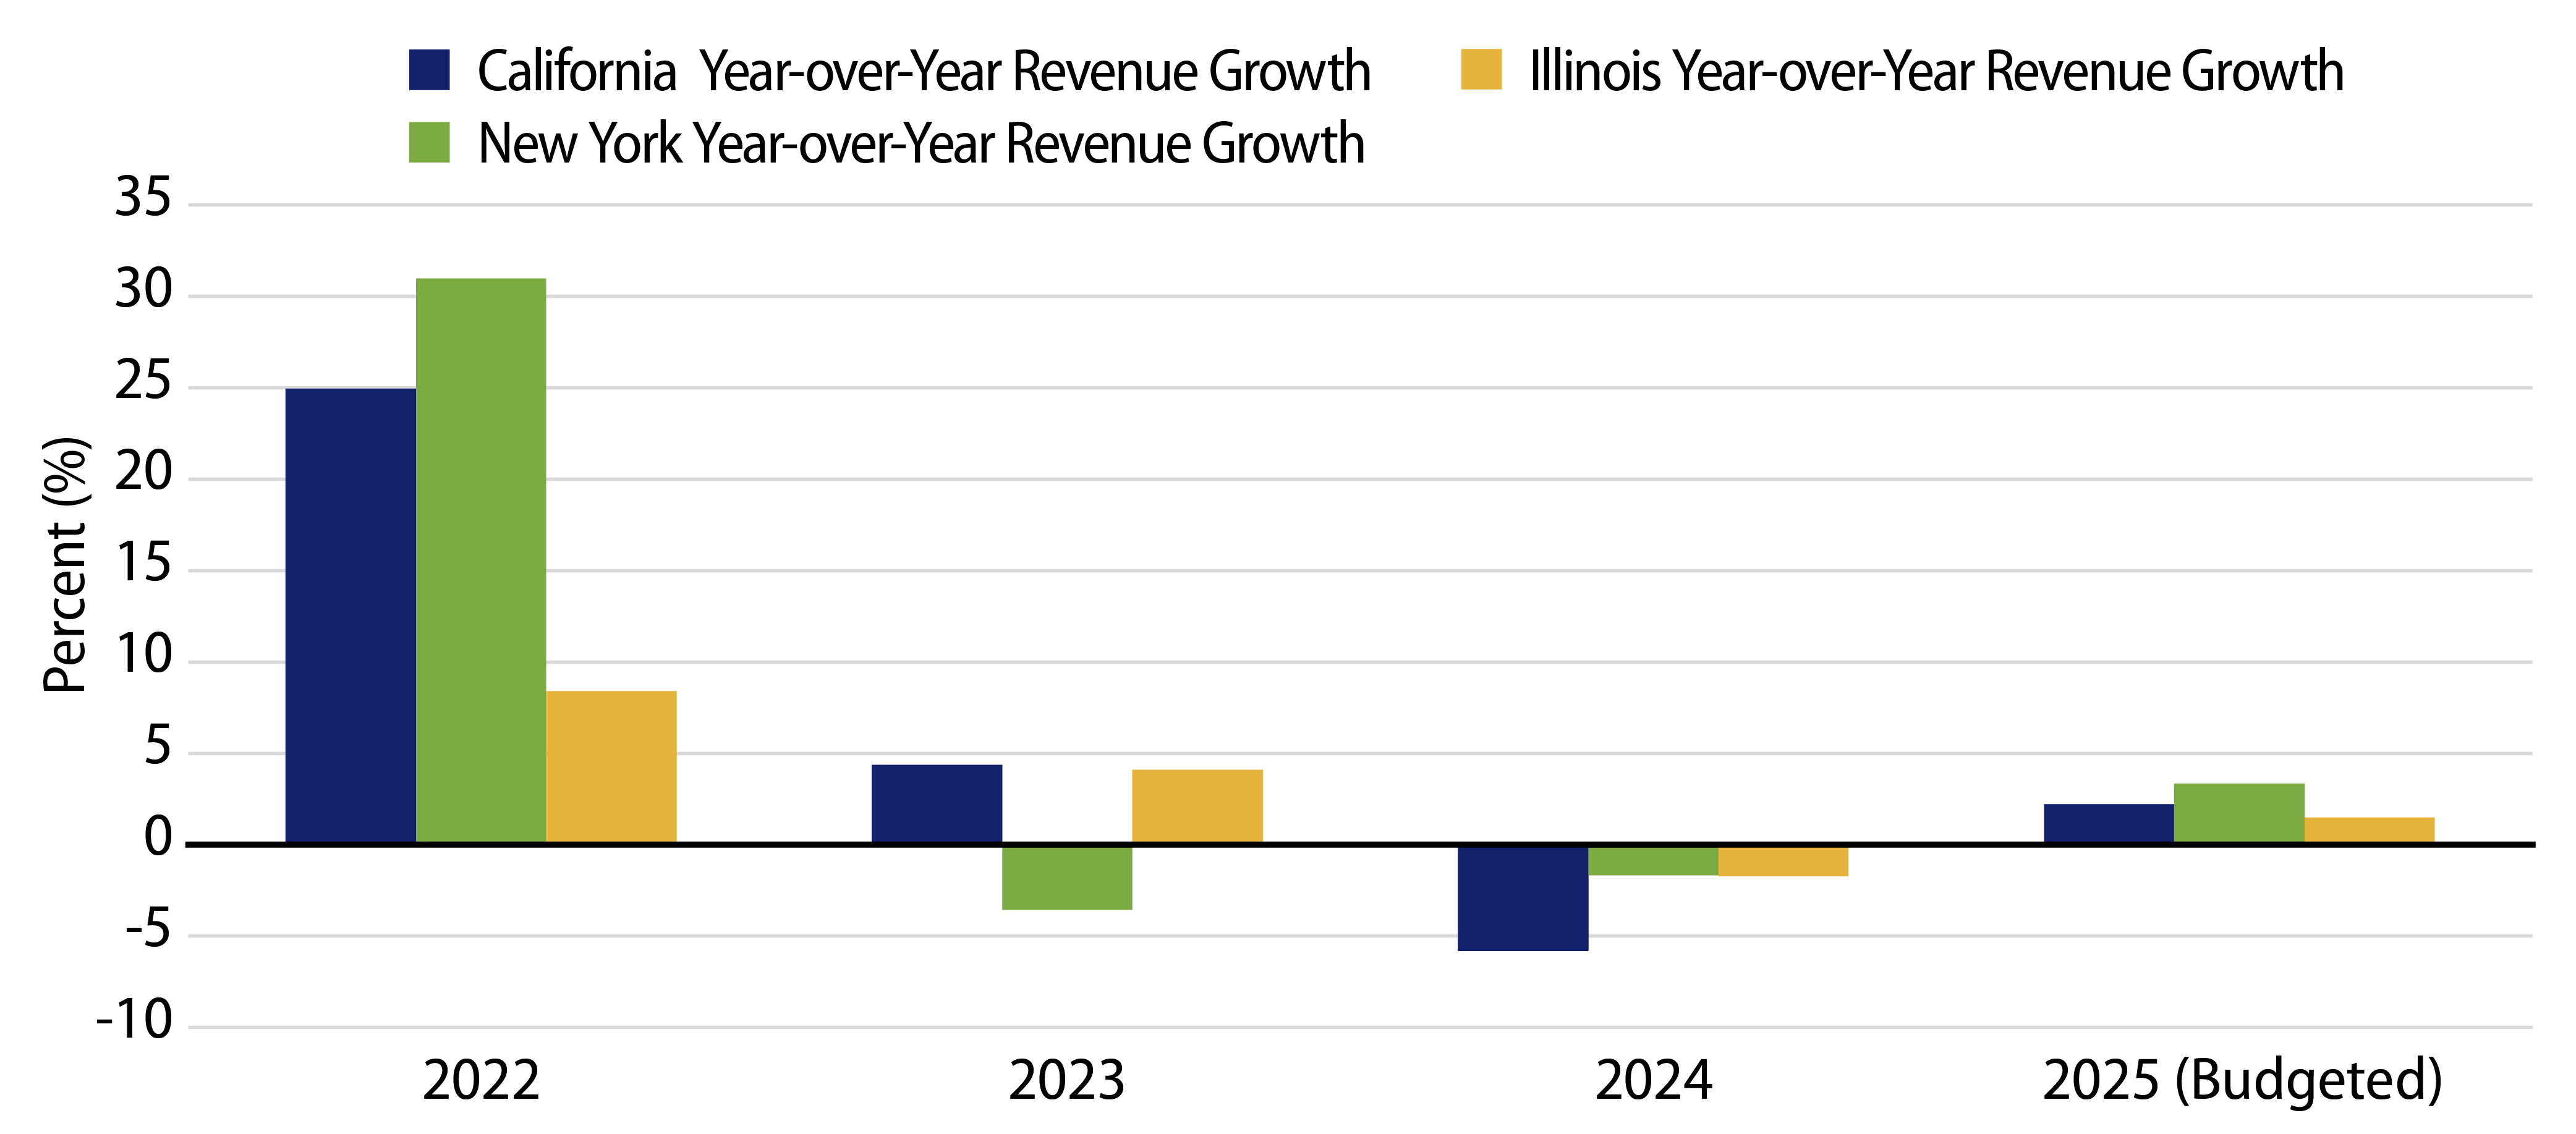
Examining early budget proposals of key muni issuers of California, New York, and Illinois, fiscal 2023 and 2024 revenue trends decelerated from the strong growth trends observed in 2022. The slowing revenue trends are partially attributable to decelerating economic activity and a drop-off in capital gains collections in these high-wealth-level states that generally rely more on capital gains collections. Looking to 2025, these states conservatively estimate 1%-3% revenue growth, which reflect slowing but continued economic growth, but could have room to surprise to the upside considering the lagged effect of financial market recovery and resilient labor markets.

Exhibit 2: Budget Surplus (Deficit) Through Fiscal 2028
Explore Budget Surplus (Deficit) Through Fiscal 2028
Source: Fiscal 2025 New York, Illinois and California Budgets, and CA Legislative Analyst's Office expectations. As of 16 Jan 24, New York; 21 Feb 24, Illinois; 07 Dec 23, California. Select the image to expand the view.

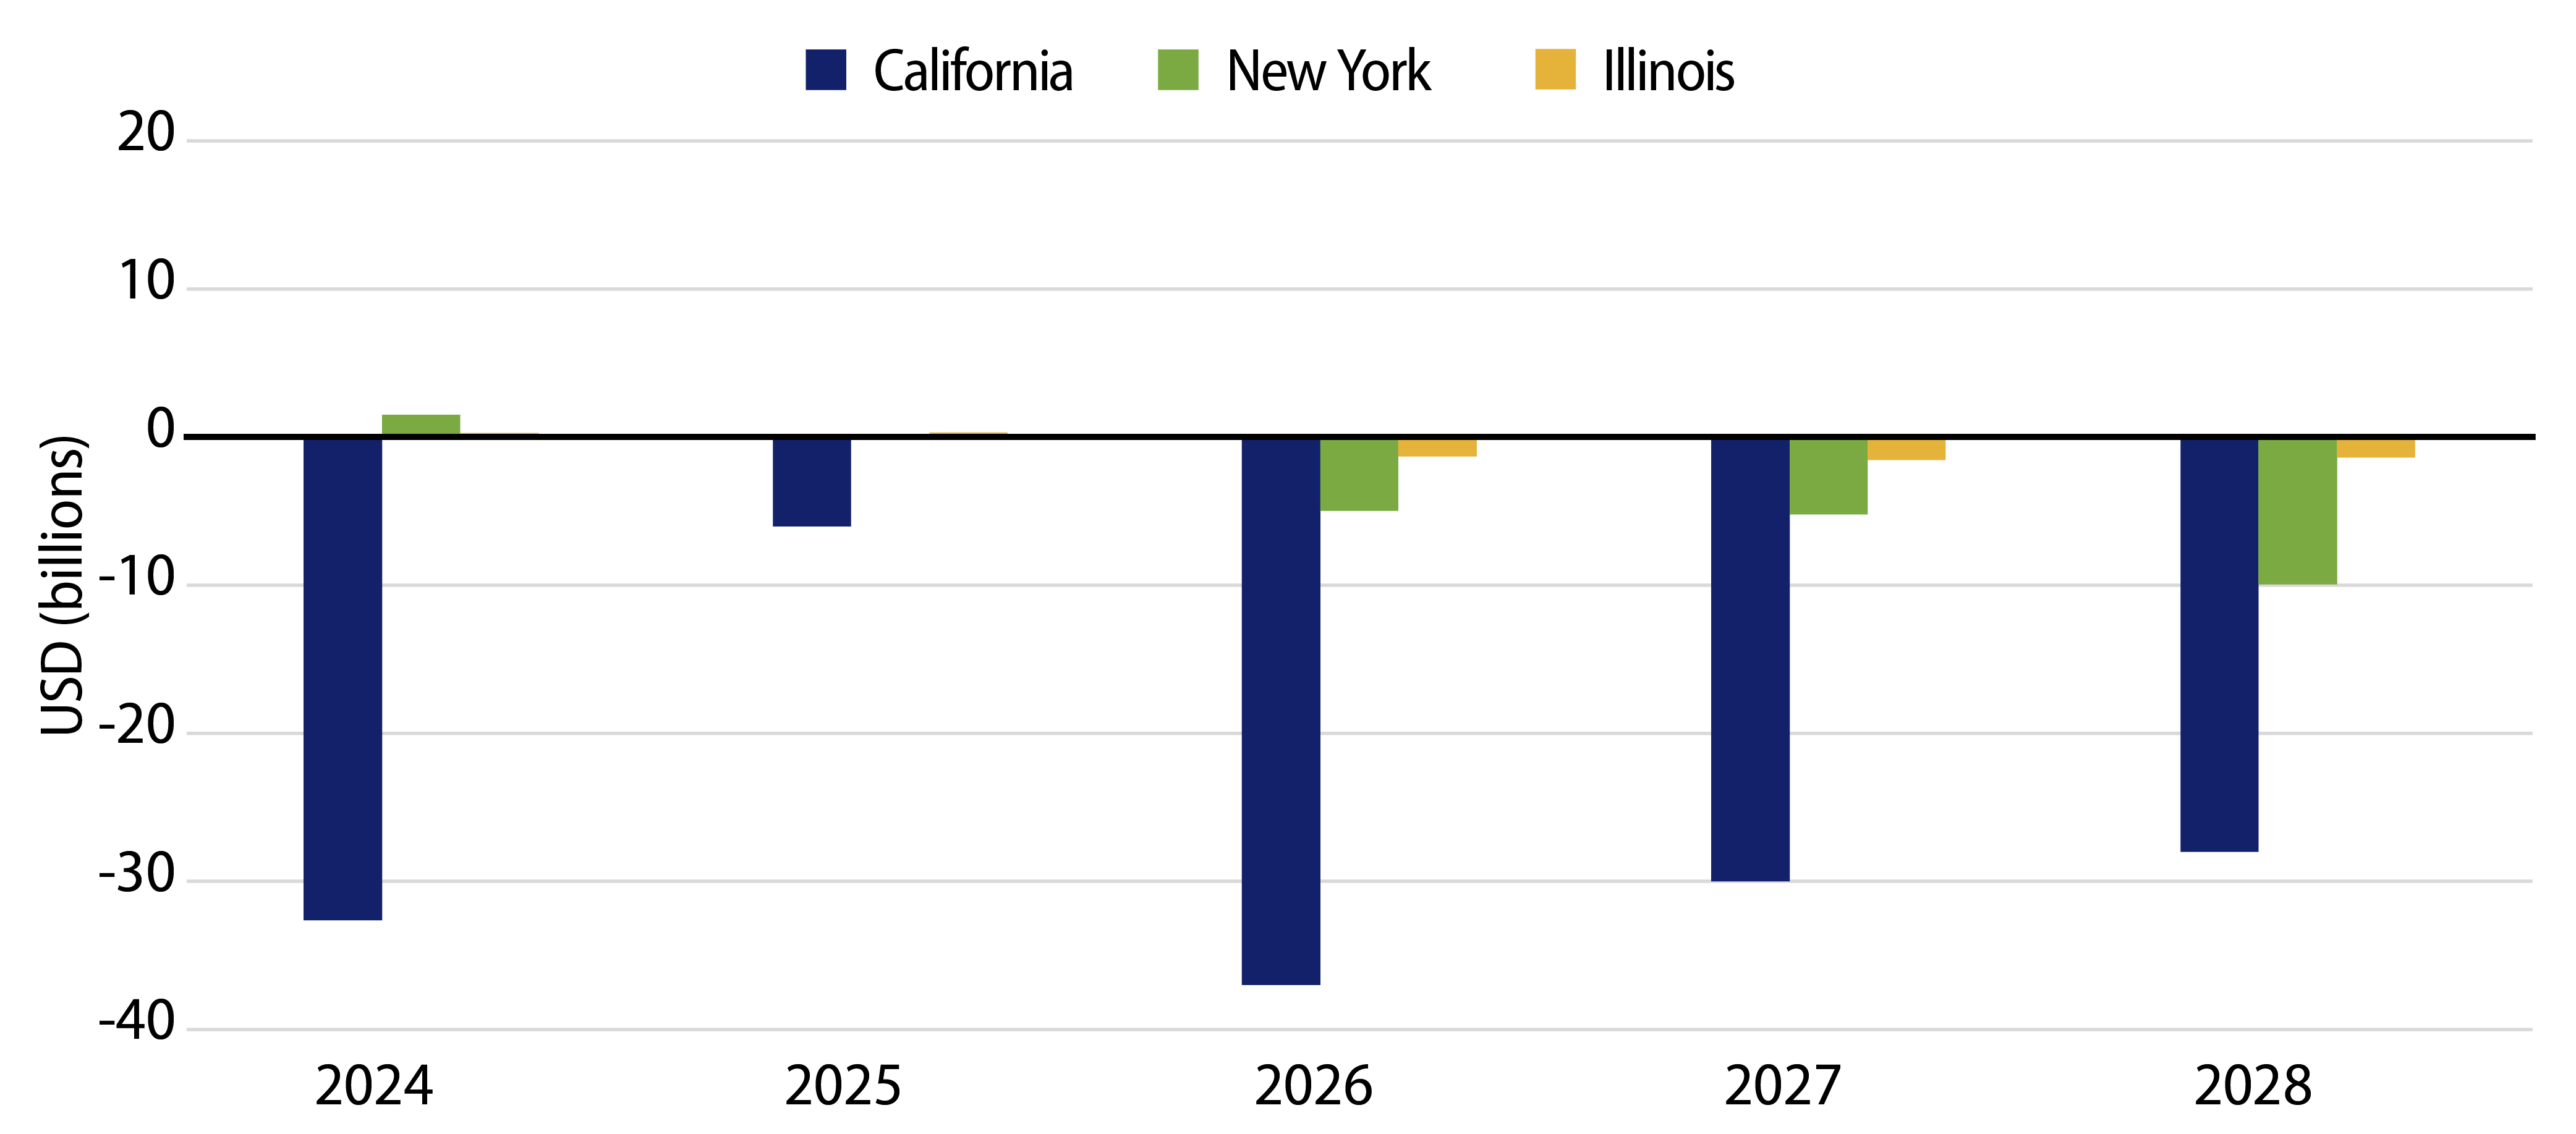
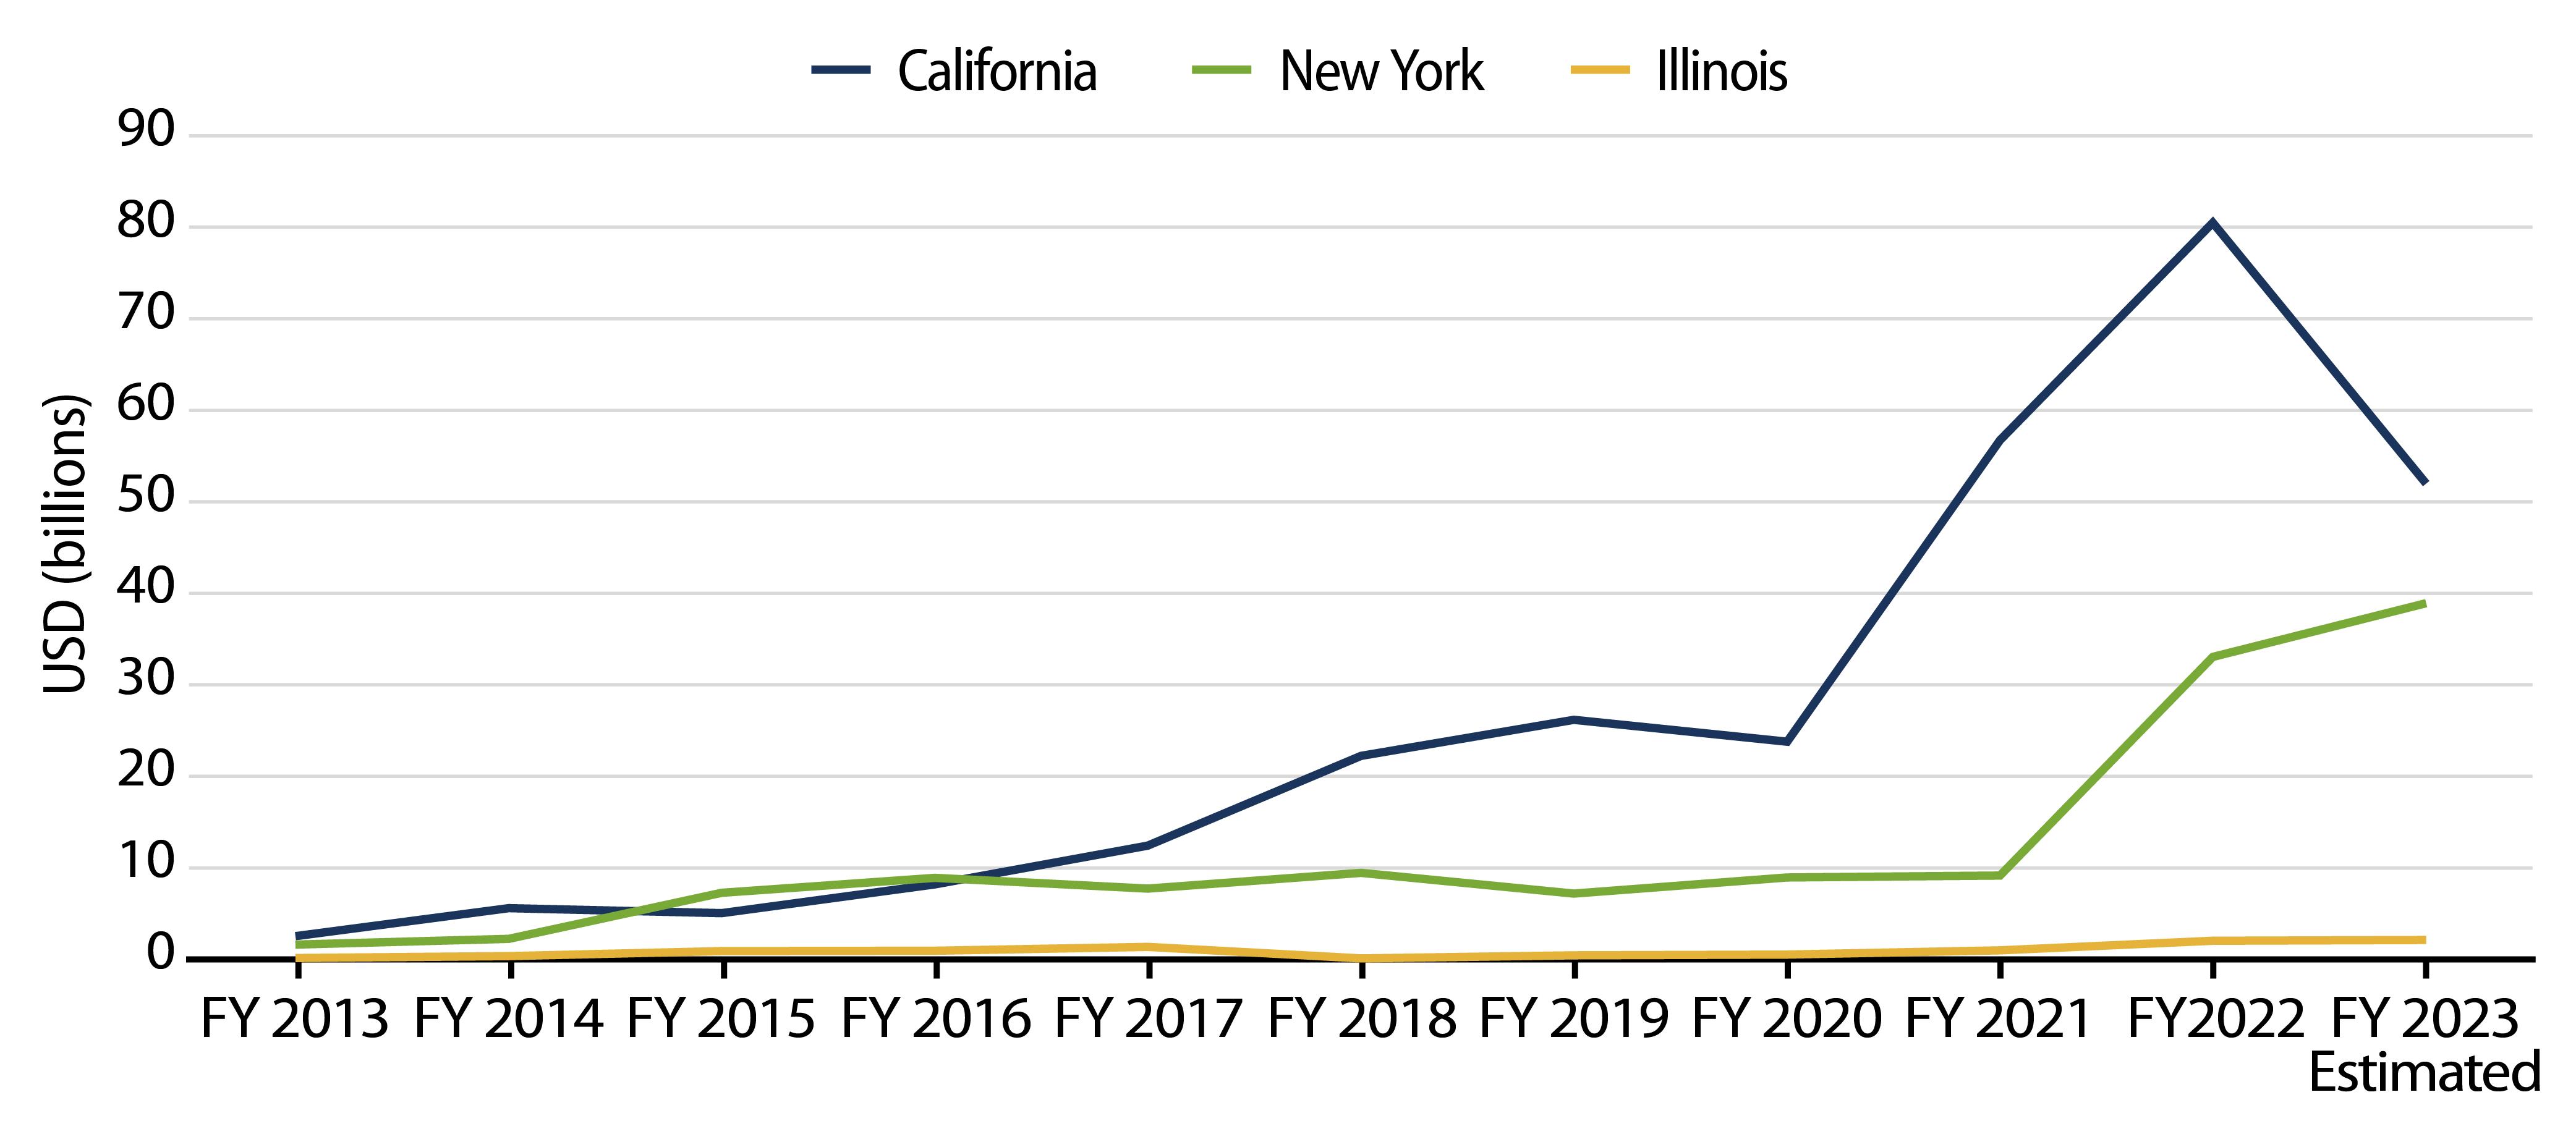
As revenue growth has slowed across states, California, New York and Illinois are projecting three-year budget gaps of $95 billion, $20 billion and $4 billion, respectively. While headline-grabbing, these projected deficits do not reflect likely spending reductions, nor the expected drawdown of record cash balances. As of the end of fiscal 2023, total Fund Balances/Reserves for California, New York and Illinois reached $52 billion, $39 billion and $2 billion, respectively, thanks to recent unprecedented stimulus and a prioritization to build reserves. In addition to these reserves, California has reduced its budget size by 10%, while Illinois and New York highlight a 1.4% and 2.5% increase in spending for 2025.

Exhibit 3: General Fund Balances
Explore General Fund Balances
Source: PEW Fiscal 2023 Estimates. As of 7 Dec 2023. Select the image to expand the view.

The current budget releases are preliminary and subject to change in the coming months, but continue to highlight general credit stability within the muni market. While revenue collections appear resilient and the willingness to rein in expenditures is apparent, out-year projected deficits will need to be addressed and will likely represent a headwind for many states and localities, particularly if economic conditions decelerate. Western Asset anticipates that general budgetary flexibility, as well as strong cash balances will continue to support municipal credit. However, considering the likelihood of austerity ahead, we expect the pace of upgrades relative to downgrades throughout the muni market to decline.

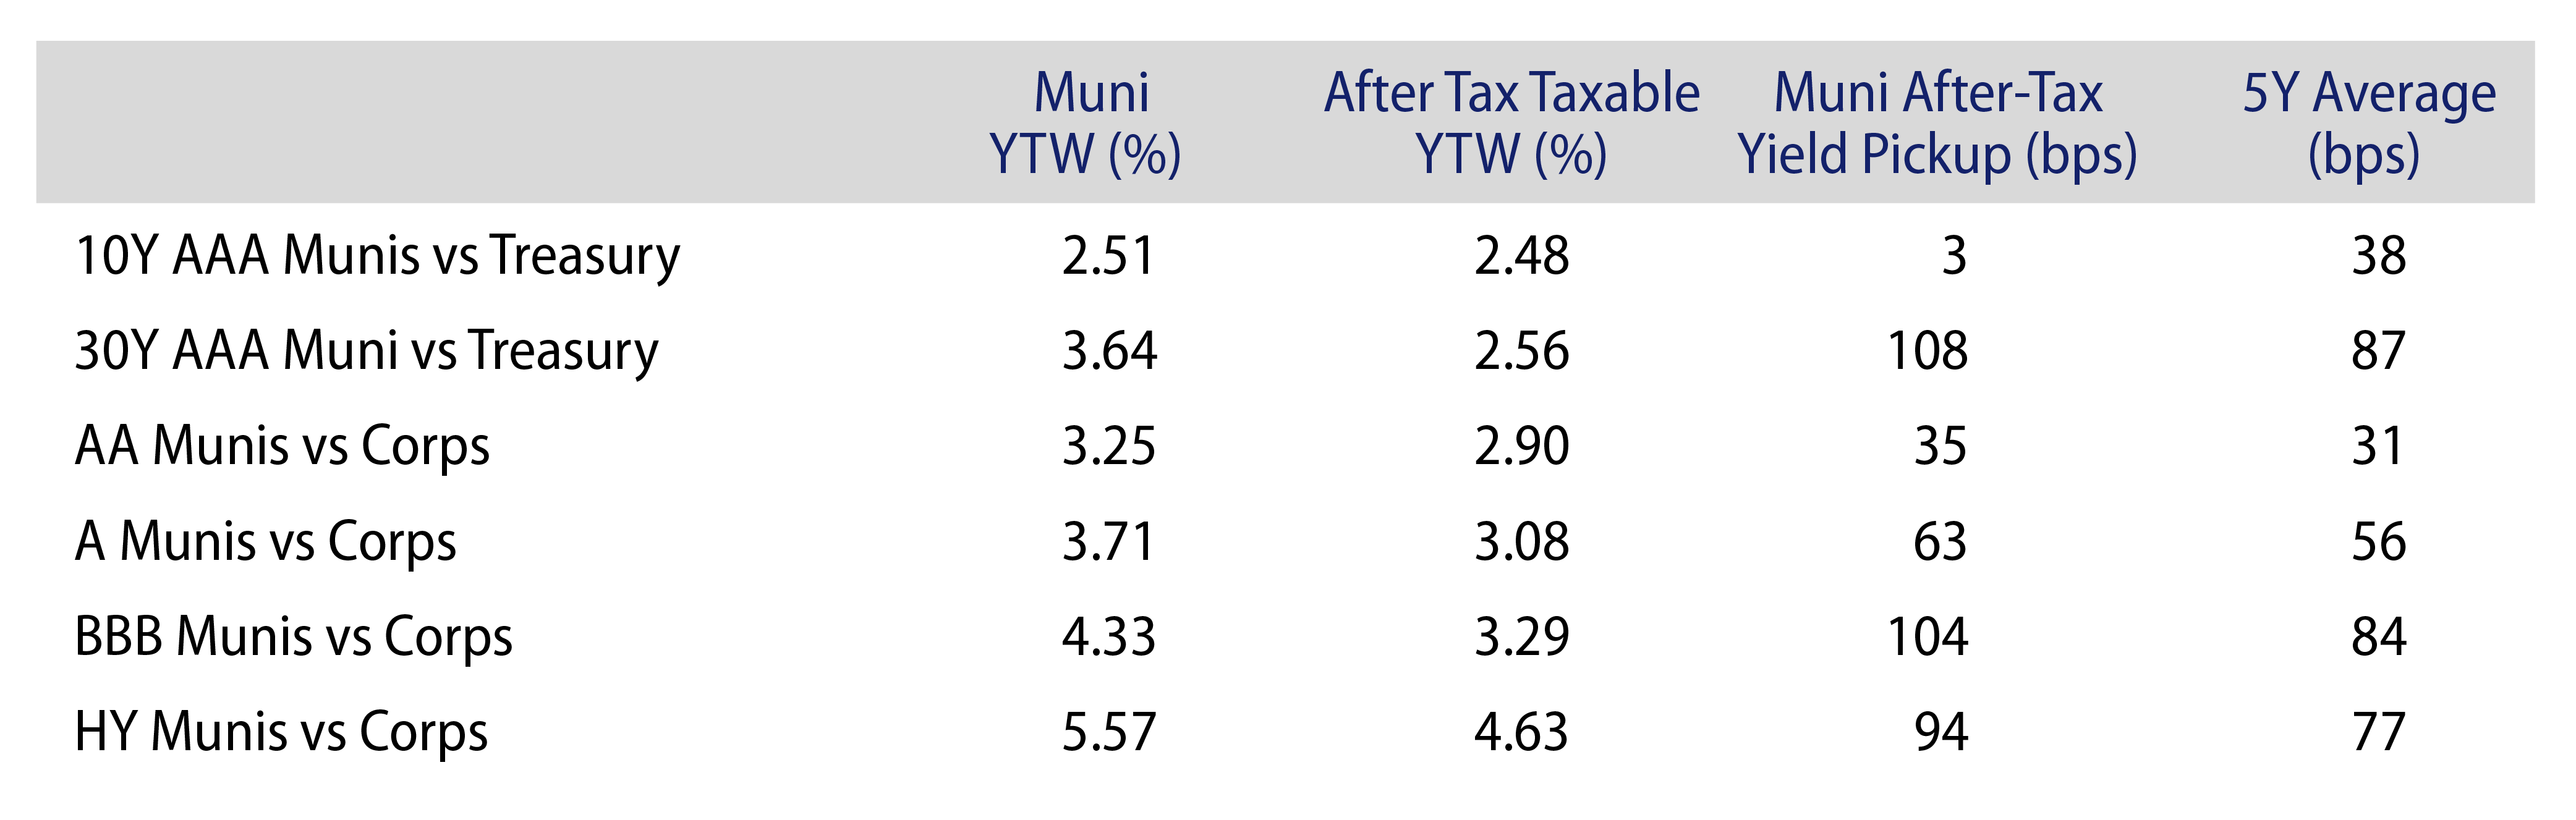
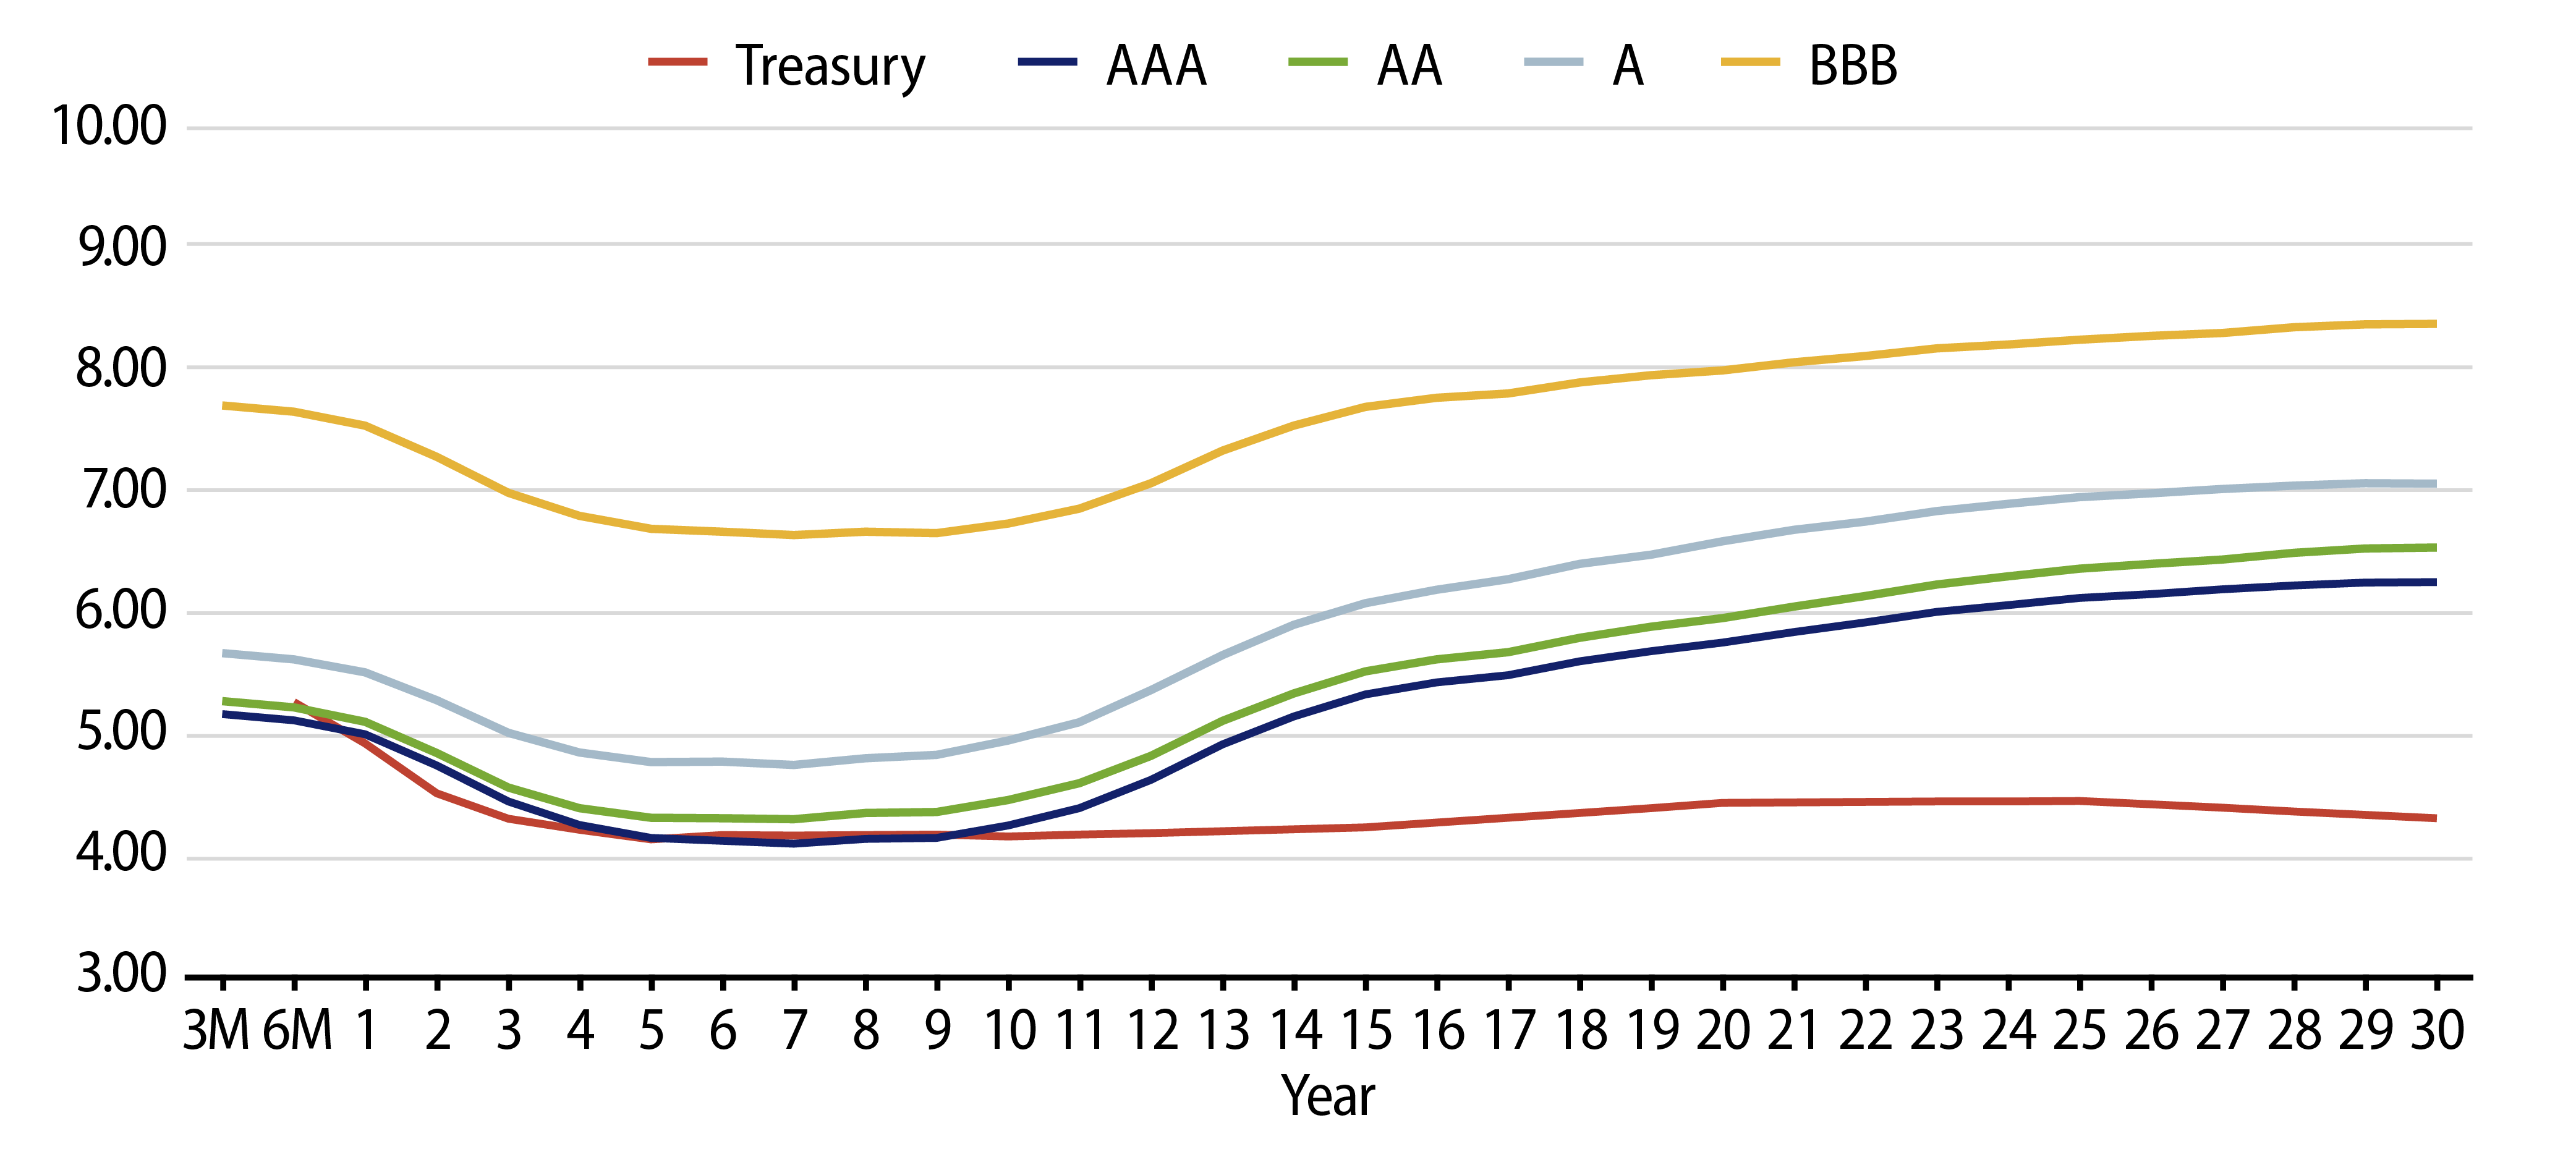
Municipal Credit Curves and Relative Value

Exhibit 4: Muni Credit Curves
Explore Muni Credit Curves
Source: Bloomberg, Western Asset. As of 01 Mar 24. Bloomberg BVAL Municipal Credit Indices (AAA, AA, A, BBB, respectively) and US Sovereign Curves. Taxable-Equivalent Muni Credit Curves consider the top marginal effective tax rate of 40.8%. Select the image to expand the view.
Exhibit 5: Taxable-Equivalent Muni Credit Curves
Explore Taxable-Equivalent Muni Credit Curves
Source: Bloomberg, Western Asset. As of 01 Mar 24. Bloomberg BVAL Municipal Credit Indices (AAA, AA, A, BBB, respectively) and US Sovereign Curves. Taxable-Equivalent Muni Credit Curves consider the top marginal effective tax rate of 40.8%. Select the image to expand the view.
Exhibit 6: AAA Munis versus Treasuries
Explore AAA Munis versus Treasuries
Source: Bloomberg. As of 01 Mar 24. Past performance is not a guarantee of future results. It is not possible to invest directly in an Index. Select the image to expand the view.
Exhibit 7: Tax-Exempt and Taxable Muni Valuations
Explore Tax-Exempt and Taxable Muni Valuations
Source: Bloomberg. As of 01 Mar 24. Select the image to expand the view.

Western Asset Key Themes for Muni Investors

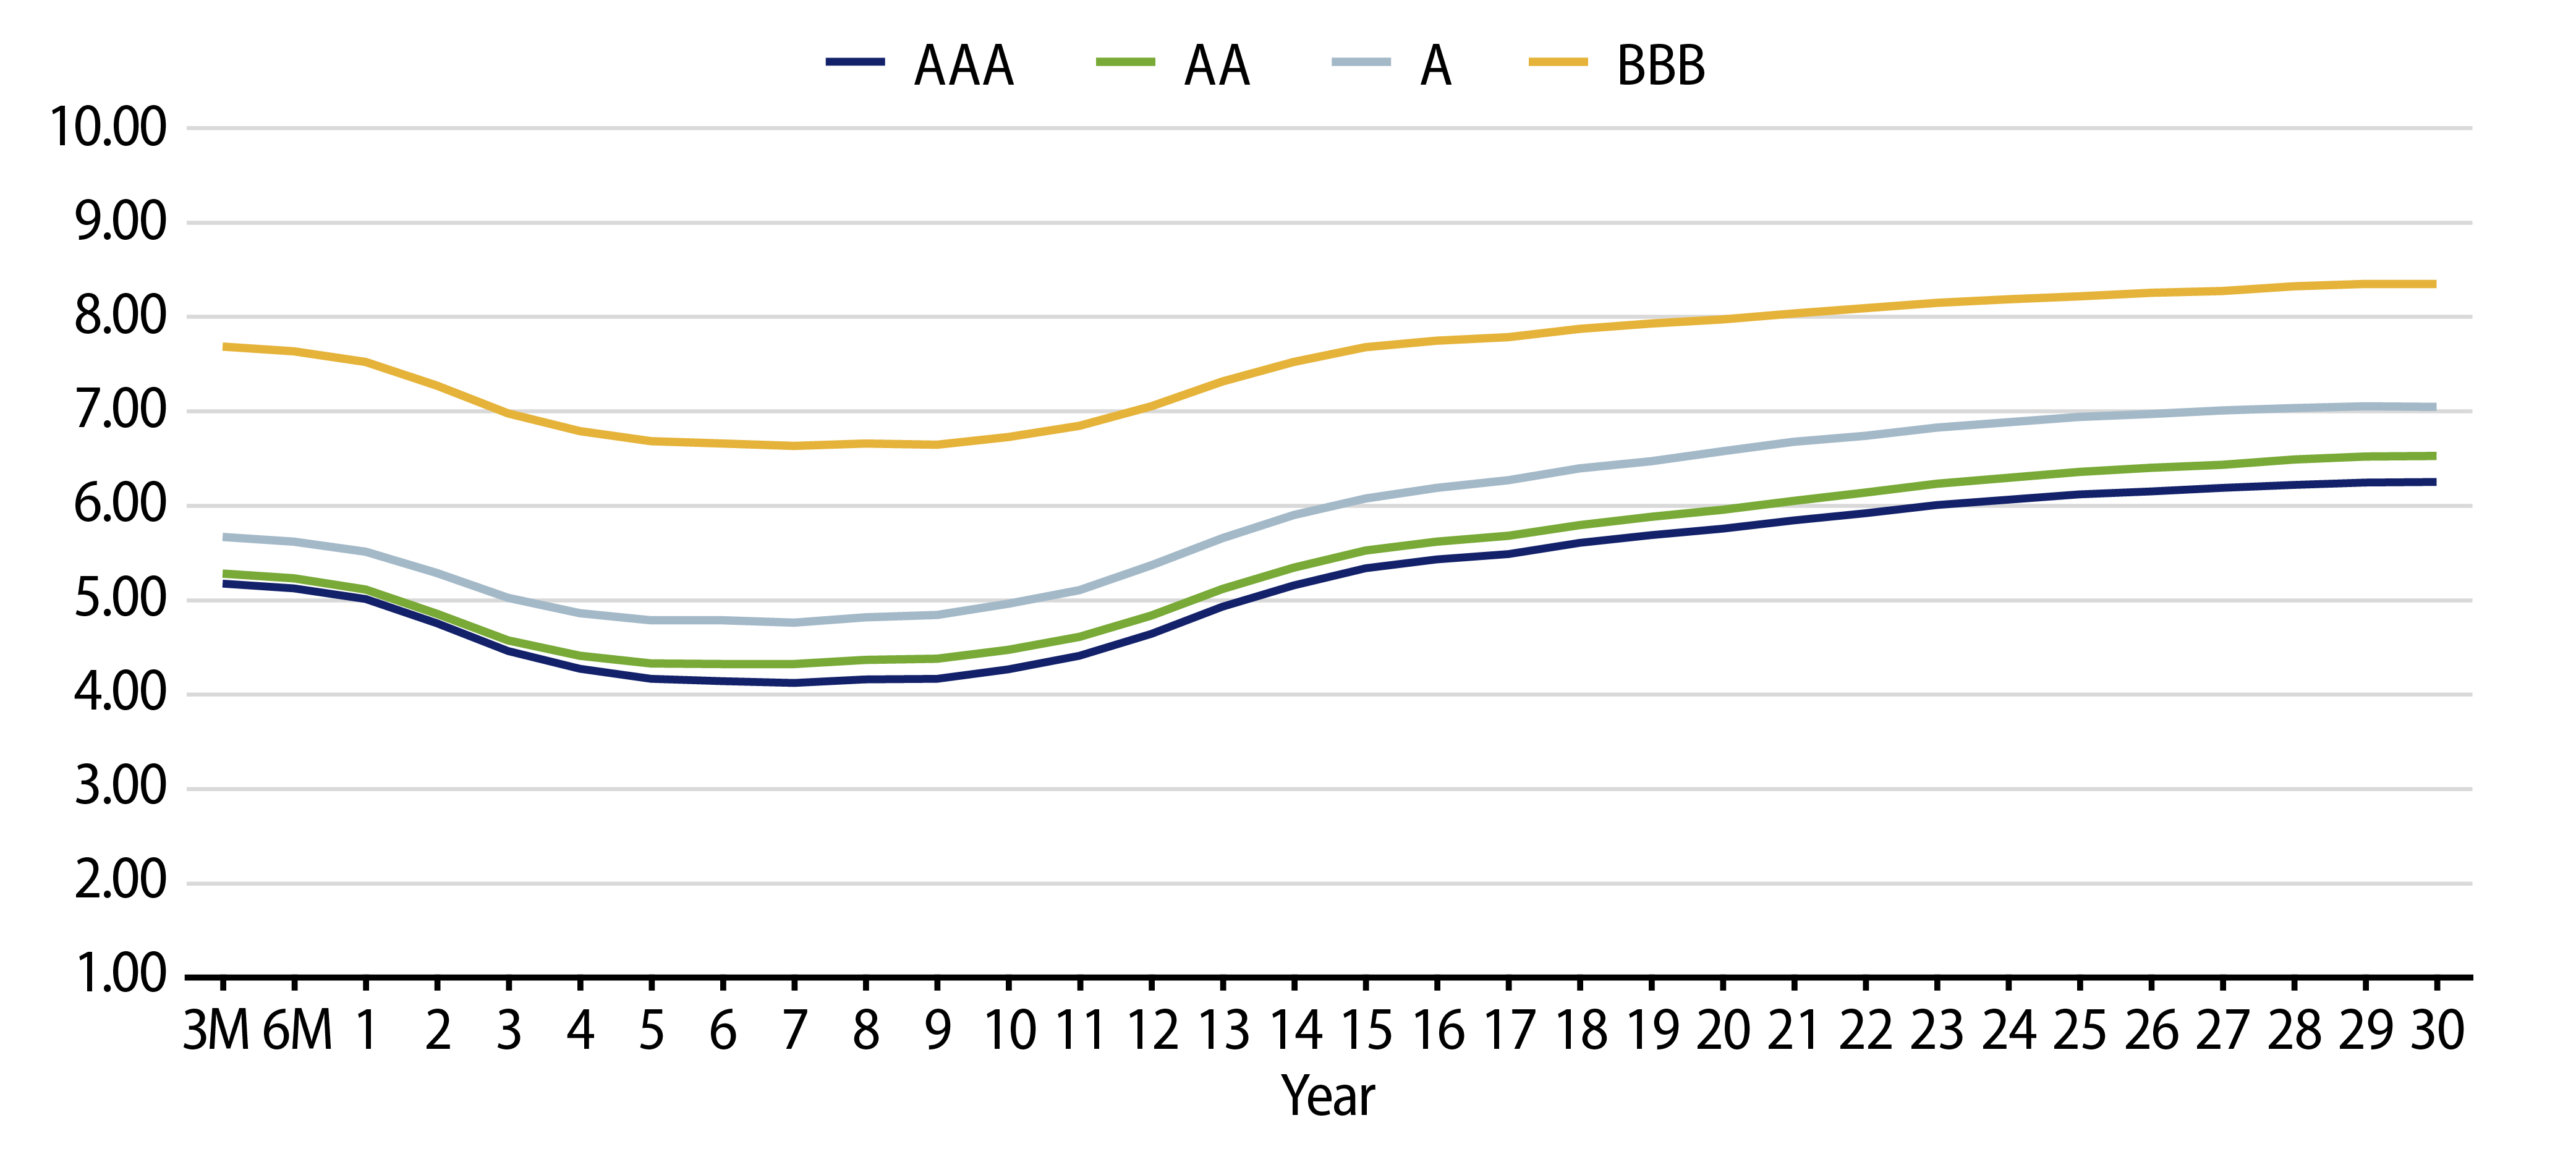
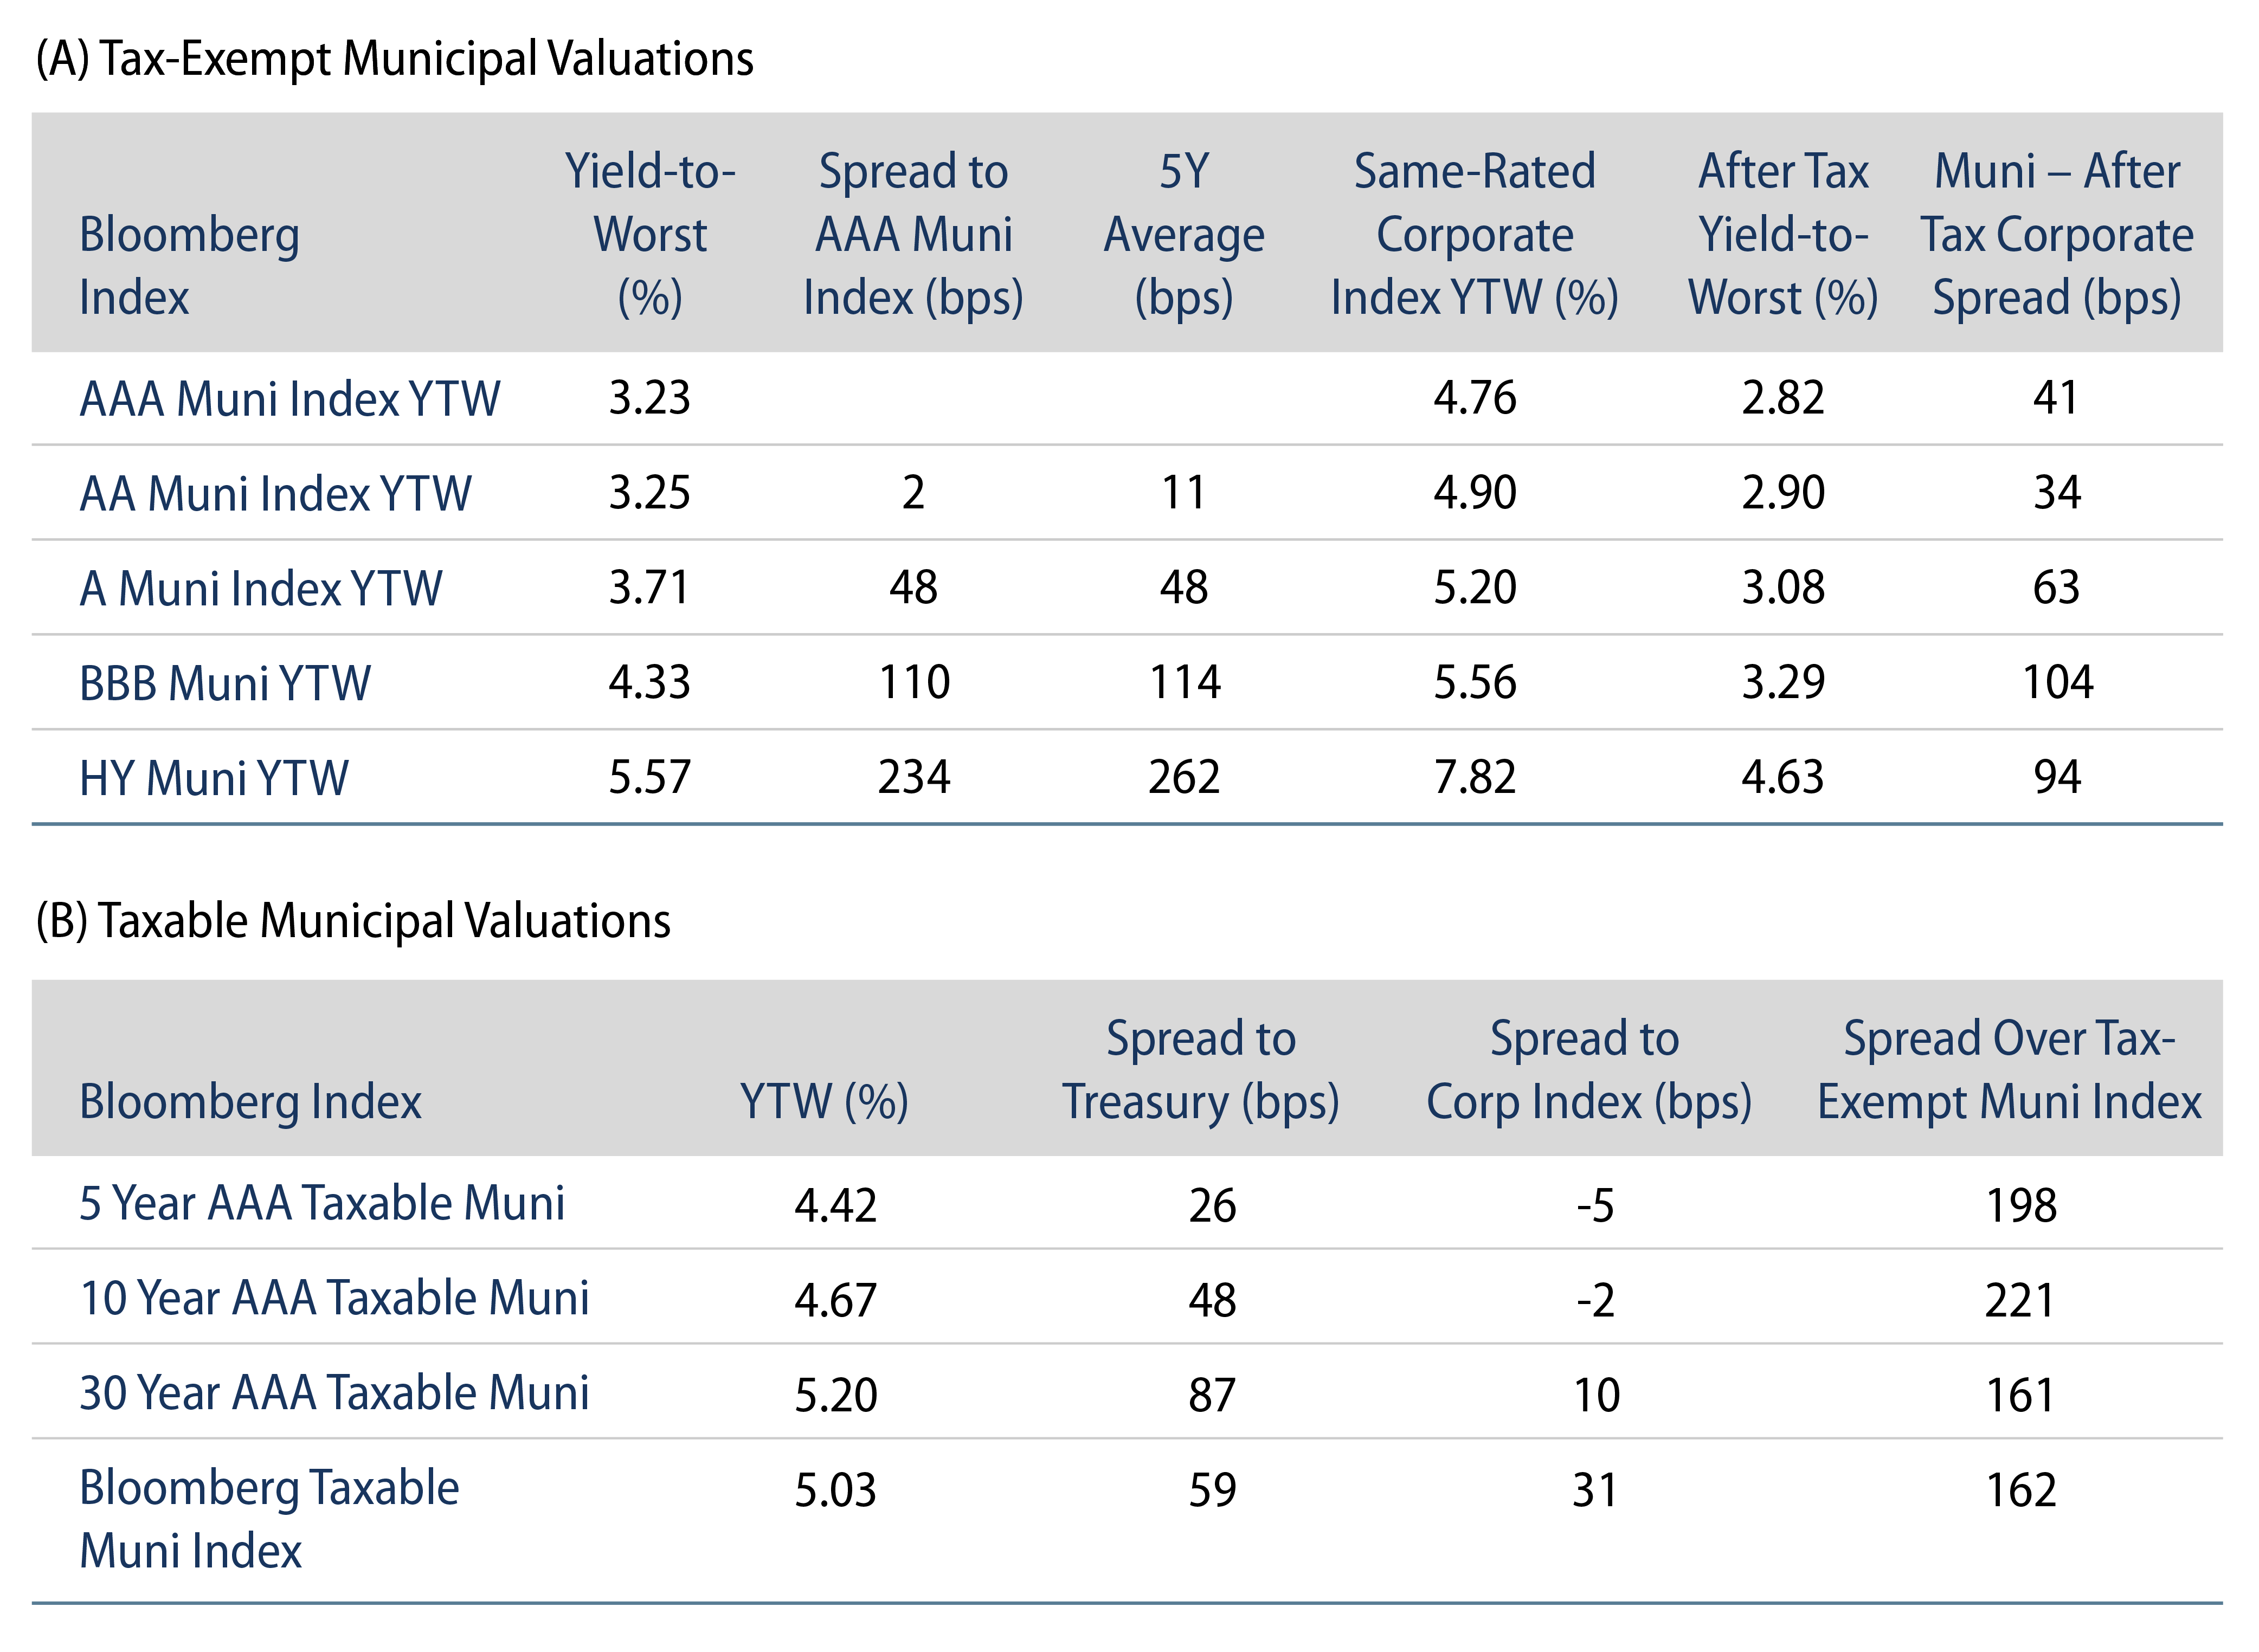
Theme #1: Municipal taxable-equivalent yields are above decade averages.

Exhibit 8: Muni and Taxable-Equivalent Muni Yield-to-Worst
Explore Muni and Taxable-Equivalent Muni Yield-to-Worst
Source: Bloomberg, Western Asset. As of 01 Mar 24. Bloomberg Municipal Bond Index Yield Considering Highest Marginal Tax Rate. Select the image to expand the view.

Theme #2: Recent yield curve steepening has highlighted relative value in longer maturities.

Exhibit 9: AAA Municipal vs. Treasury Yield Curves
 Explore AAA Municipal vs. Treasury Yield Curves
Source: Bloomberg, Western Asset. As of 01 Mar 24. Bloomberg BVAL AAA Muni Curve and US On-/Off-the-Run Sovereign Curve. Select the image to expand the view.

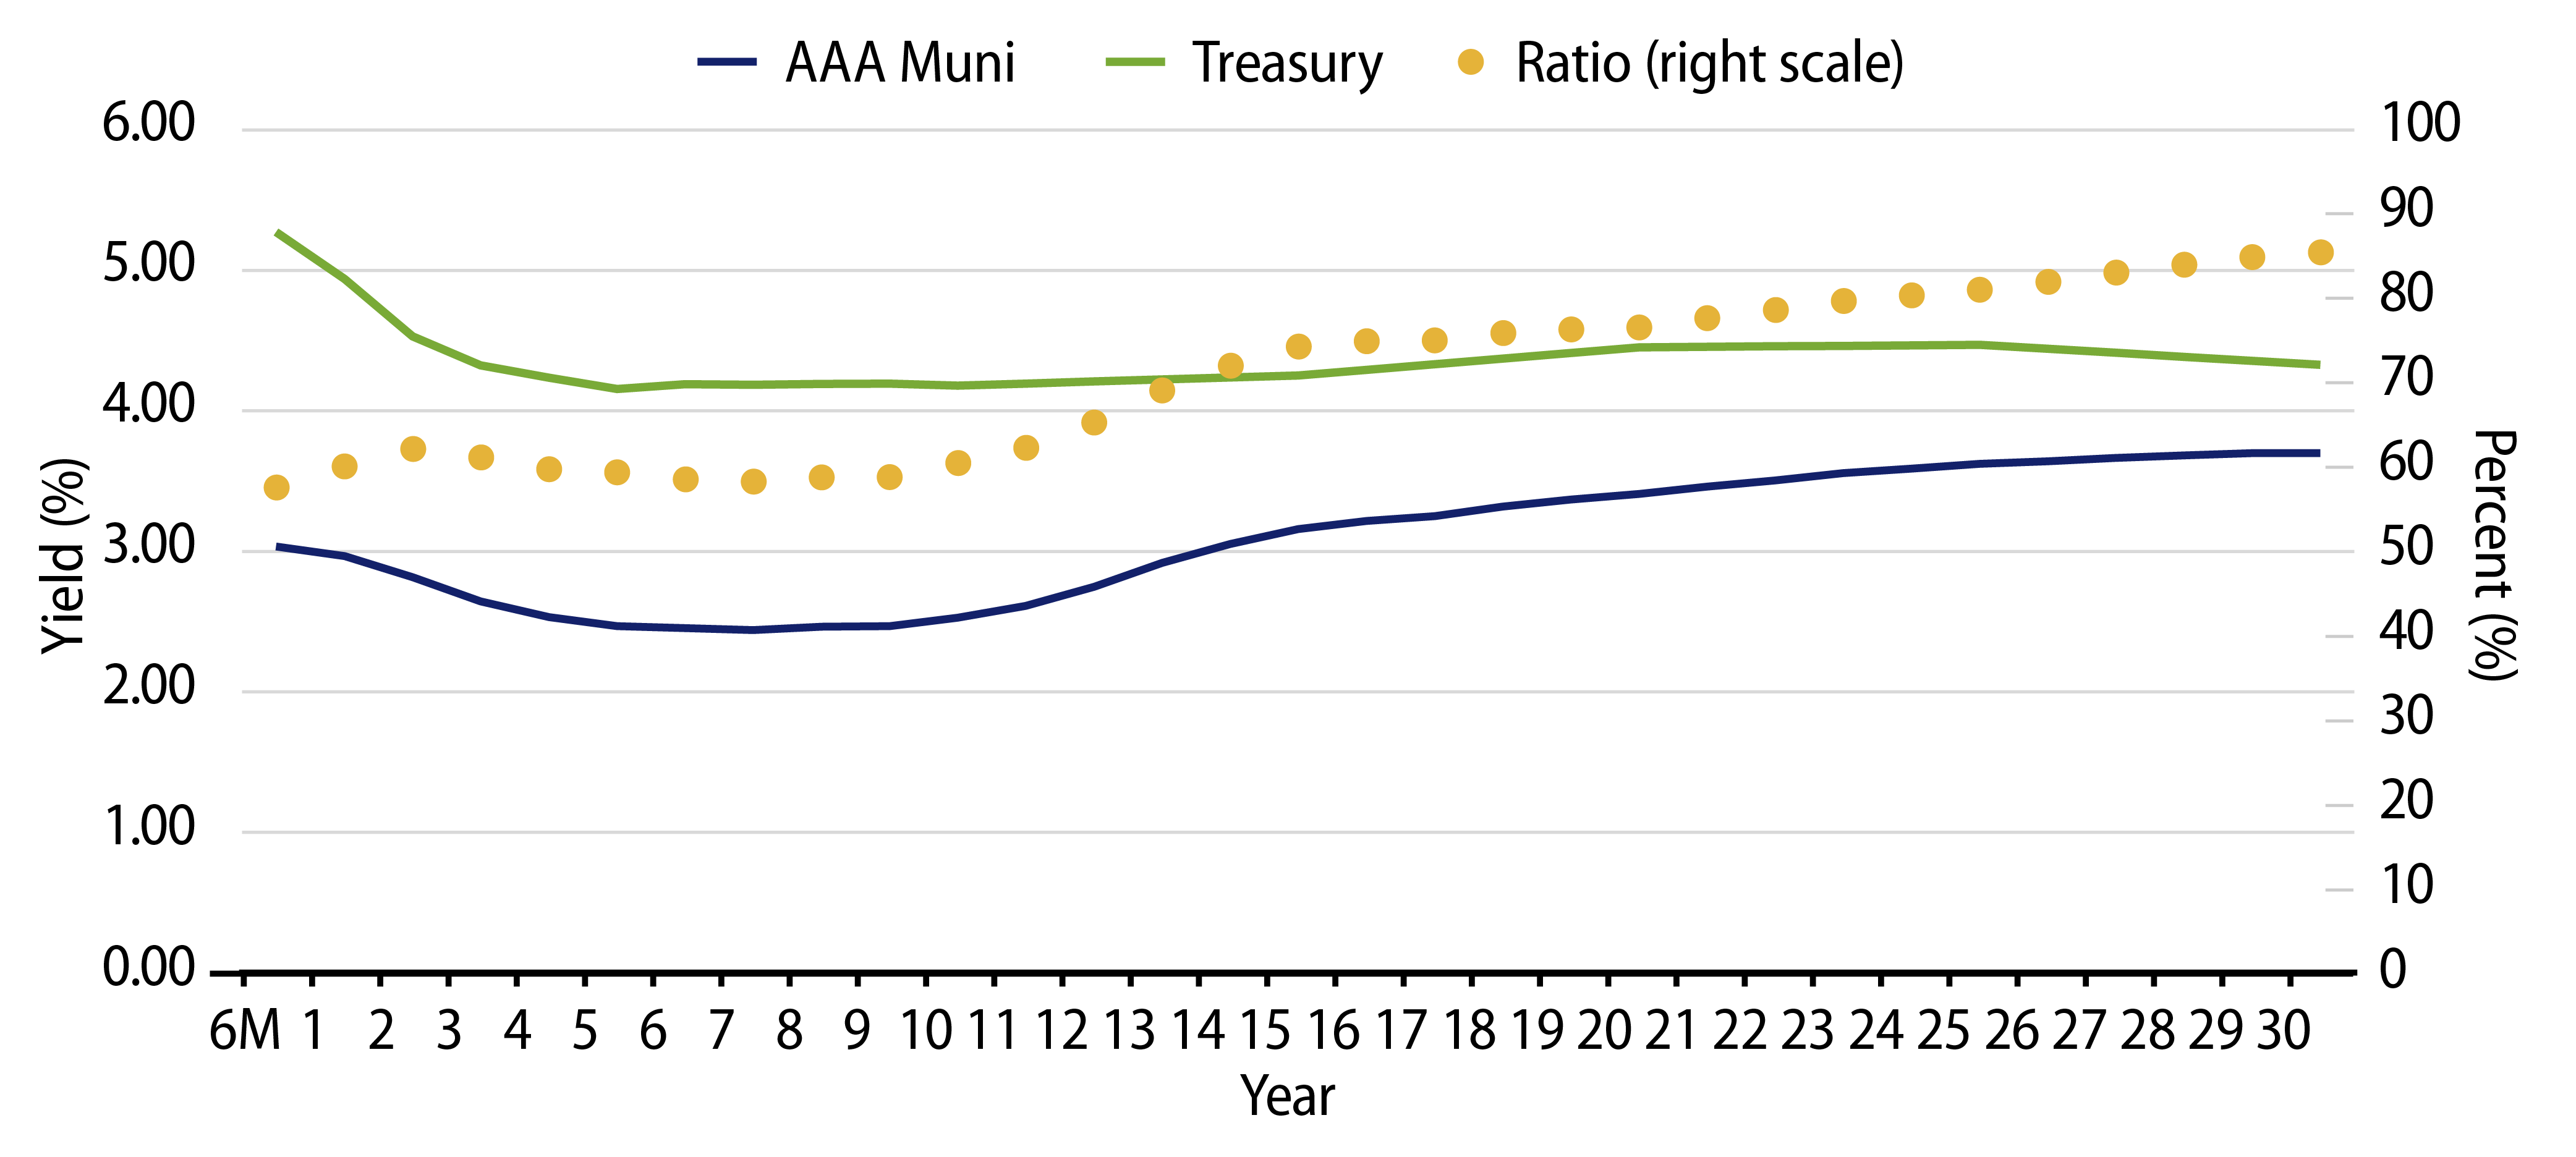
Theme #3: Munis offer attractive after-tax yield pickup versus long Treasuries and corporate credit.

Exhibit 10: Municipal vs. Taxable Fixed-Income Yields by Quality
Explore Municipal vs. Taxable Fixed-Income Yields by Quality
Source: Western Asset, Bloomberg. As of 01 Mar 24. Bloomberg BVAL AAA Muni Curve and US On-/Off-the-Run Sovereign Curve. After-tax yield considers top marginal tax rate of 40.8%. Select the image to expand the view.

© Western Asset Management Company, LLC 2024. The information contained in these materials ("the materials") is intended for the exclusive use of the designated recipient ("the recipient"). This information is proprietary and confidential and may contain commercially sensitive information, and may not be copied, reproduced or republished, in whole or in part, without the prior written consent of Western Asset Management Company ("Western Asset").
Past performance does not predict future returns. These materials should not be deemed to be a prediction or projection of future performance. These materials are intended for investment professionals including professional clients, eligible counterparties, and qualified investors only.
These materials have been produced for illustrative and informational purposes only. These materials contain Western Asset's opinions and beliefs as of the date designated on the materials; these views are subject to change and may not reflect real-time market developments and investment views.
Third party data may be used throughout the materials, and this data is believed to be accurate to the best of Western Asset's knowledge at the time of publication, but cannot be guaranteed. These materials may also contain strategy or product awards or rankings from independent third parties or industry publications which are based on unbiased quantitative and/or qualitative information determined independently by each third party or publication. In some cases, Western Asset may subscribe to these third party's standard industry services or publications. These standard subscriptions and services are available to all asset managers and do not influence rankings or awards in any way.
Investment strategies or products discussed herein may involve a high degree of risk, including the loss of some or all capital. Investments in any products or strategies described in these materials may be volatile, and investors should have the financial ability and willingness to accept such risks.
Unless otherwise noted, investment performance contained in these materials is reflective of a strategy composite. All other strategy data and information included in these materials reflects a representative portfolio which is an account in the composite that Western Asset believes most closely reflects the current portfolio management style of the strategy. Performance is not a consideration in the selection of the representative portfolio. The characteristics of the representative portfolio shown may differ from other accounts in the composite. Information regarding the representative portfolio and the other accounts in the composite are available upon request. Statements in these materials should not be considered investment advice. References, either general or specific, to securities and/or issuers in the materials are for illustrative purposes only and are not intended to be, and should not be interpreted as, recommendation to purchase or sell such securities. Employees and/or clients of Western Asset may have a position in the securities or issuers mentioned.
These materials are not intended to provide, and should not be relied on for, accounting, legal, tax, investment or other advice. The recipient should consult its own counsel, accountant, investment, tax, and any other advisers for this advice, including economic risks and merits, related to making an investment with Western Asset. The recipient is responsible for observing the applicable laws and regulations of their country of residence.
Founded in 1971, Western Asset Management Company is a global fixed-income investment manager with offices in Pasadena, New York, London, Singapore, Tokyo, Melbourne, São Paulo, Hong Kong, and Zürich. Western Asset is a wholly owned subsidiary of Franklin Resources, Inc. but operates autonomously. Western Asset is comprised of six legal entities across the globe, each with distinct regional registrations: Western Asset Management Company, LLC, a registered Investment Adviser with the Securities and Exchange Commission; Western Asset Management Company Distribuidora de Títulos e Valores Mobiliários Limitada is authorized and regulated by Comissão de Valores Mobiliários and Brazilian Central Bank; Western Asset Management Company Pty Ltd ABN 41 117 767 923 is the holder of the Australian Financial Services License 303160; Western Asset Management Company Pte. Ltd. Co. Reg. No. 200007692R is a holder of a Capital Markets Services License for fund management and regulated by the Monetary Authority of Singapore; Western Asset Management Company Ltd, a registered Financial Instruments Business Operator and regulated by the Financial Services Agency of Japan; and Western Asset Management Company Limited is authorised and regulated by the Financial Conduct Authority ("FCA") (FRN 145930). This communication is intended for distribution to Professional Clients only if deemed to be a financial promotion in the UK as defined by the FCA. This communication may also be intended for certain EEA countries where Western Asset has been granted permission to do so. For the current list of the approved EEA countries please contact Western Asset at +44 (0)20 7422 3000.