skip navigation
Blog

Stay up to date on timely topics and market events. Subscribe to our Blog now.

MARKETS
23 January 2024

Weekly Municipal Monitor—Bucking the “January Effect”

By Sam Weitzman

Stay up to date on timely topics and market events. Subscribe to our Blog now.

Municipals Sold Off with Treasuries Last Week

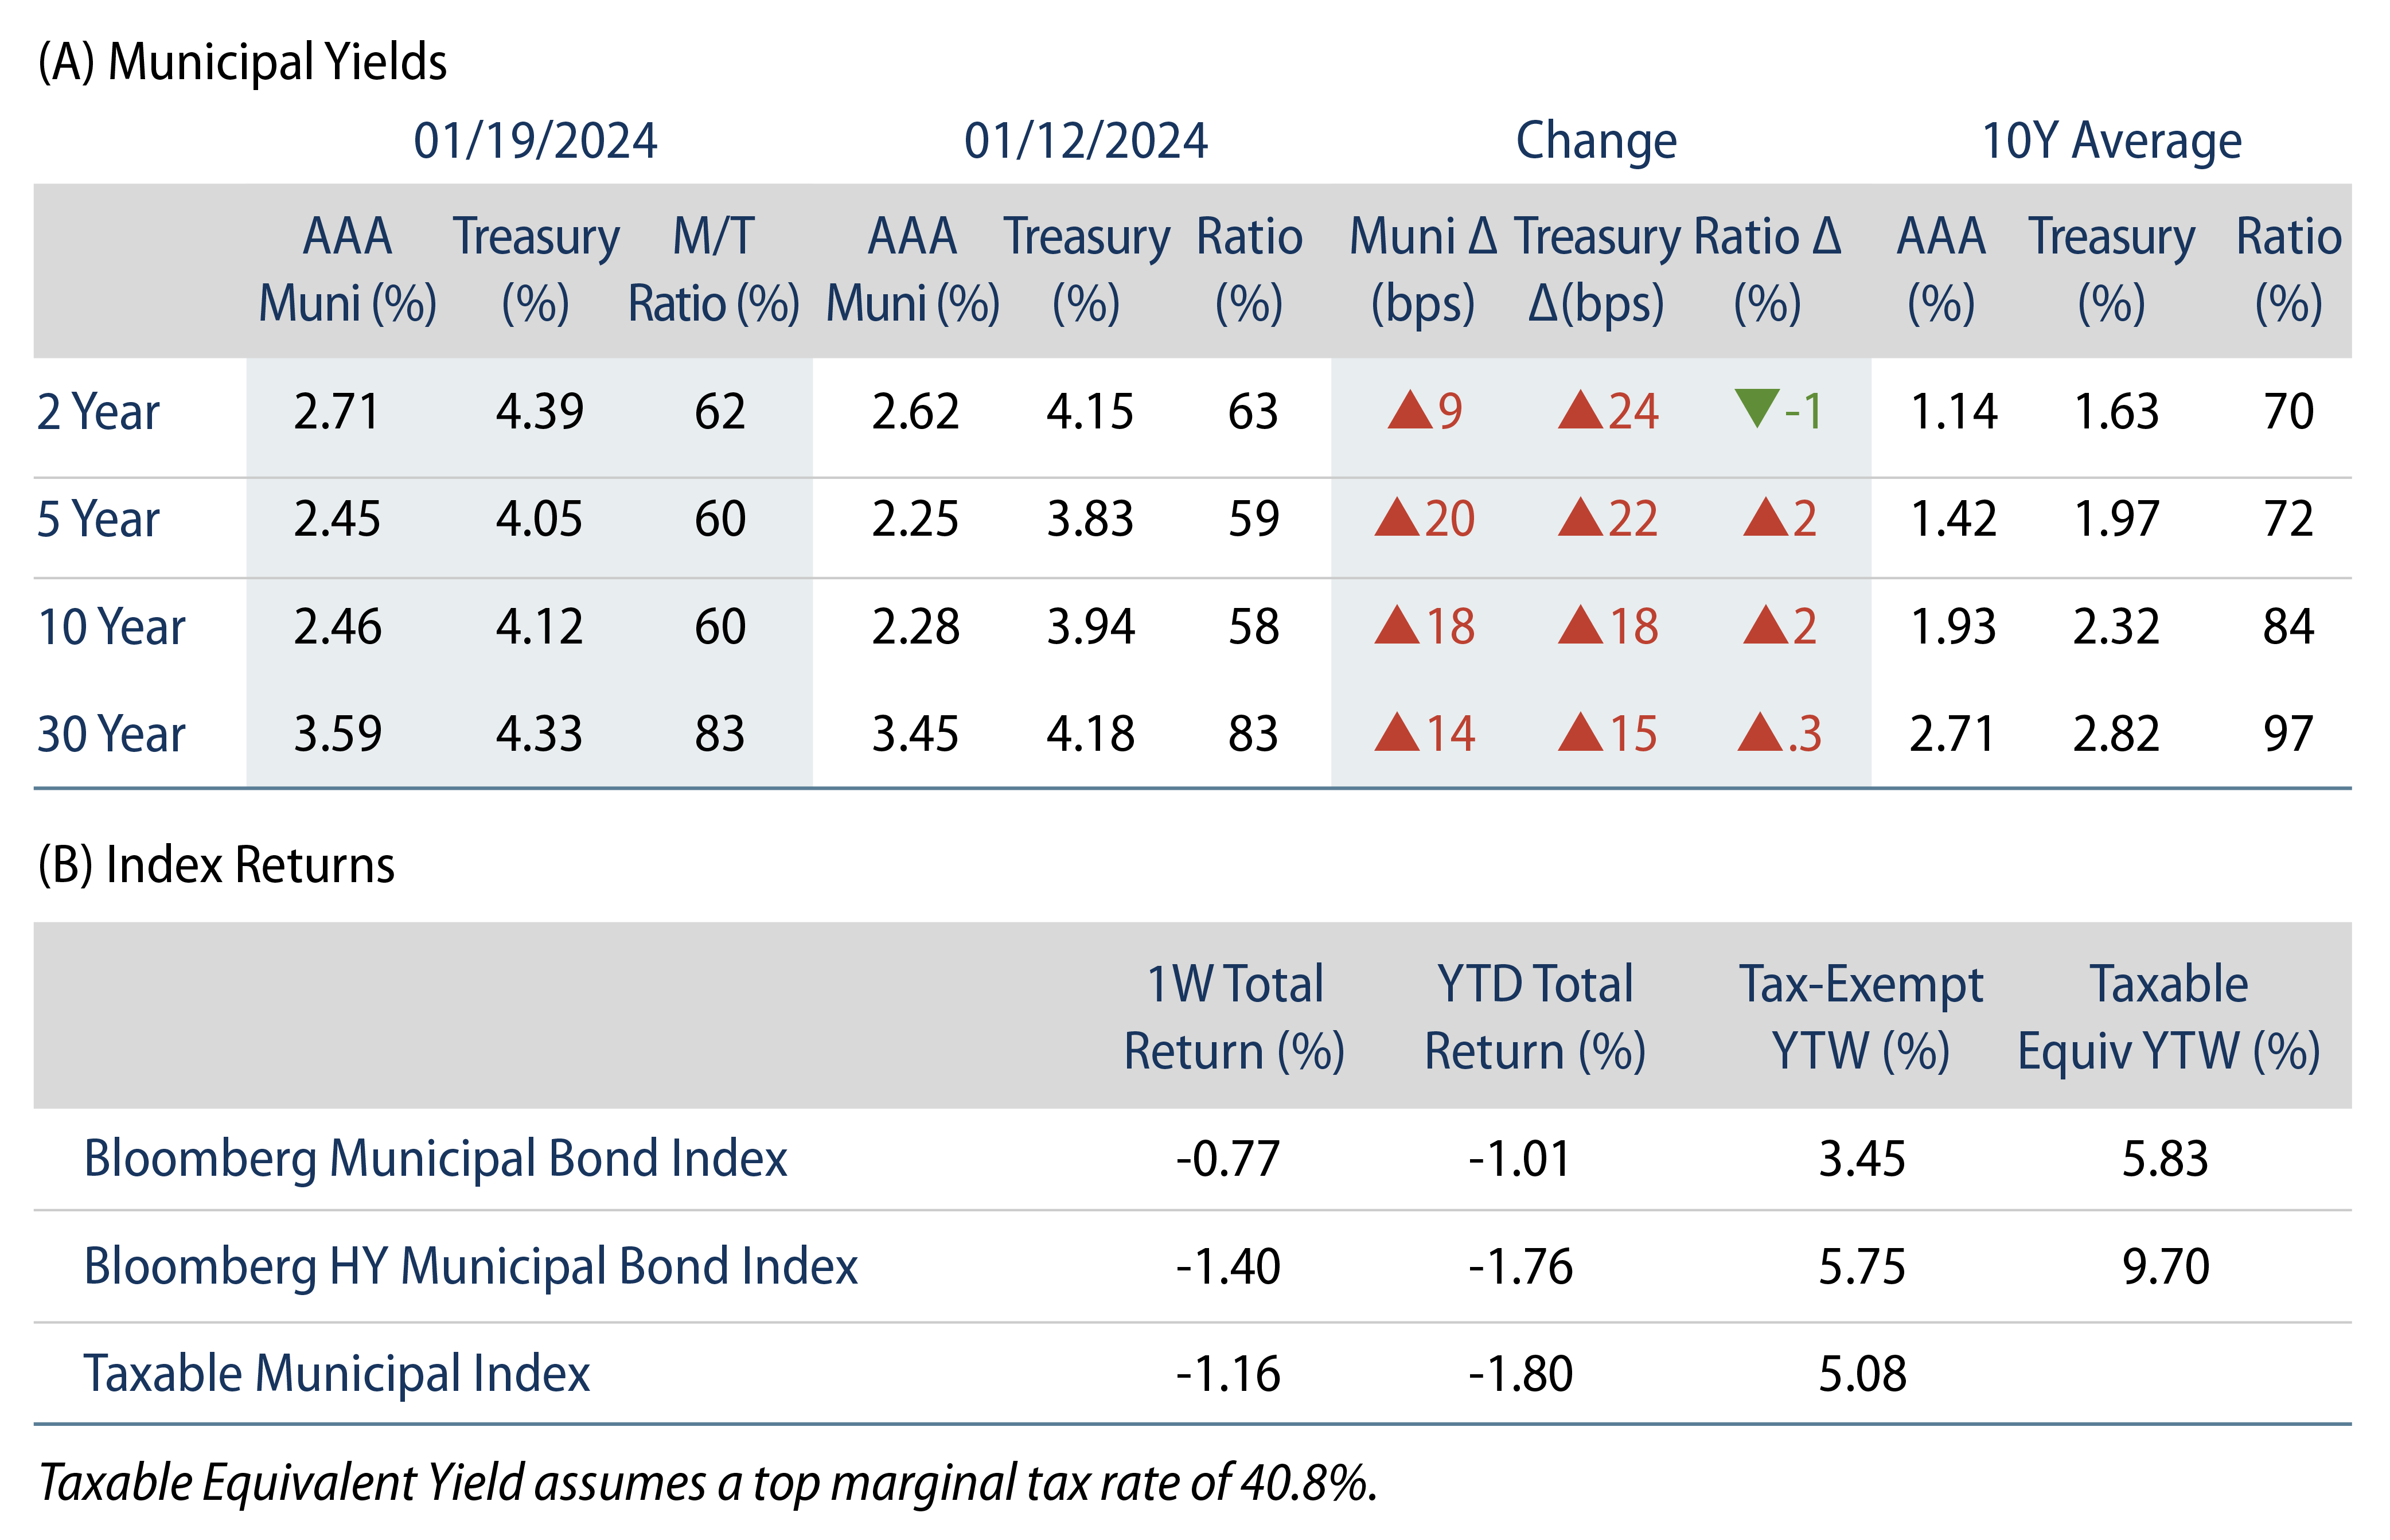
Munis sold off with Treasuries last week and followed Treasuries higher as stronger-than-anticipated retail sales data led the market to cut back expectations for near-term aggressive Fed rate cuts. High-grade muni yields moved 9-20 bps higher across the curve. Meanwhile, market technicals improved as municipal mutual funds recorded inflows. The Bloomberg Municipal Index returned -0.77% during the week, the High Yield Muni Index returned -1.40% and the Taxable Muni Index returned -1.16%. This week we highlight drivers of underperformance in the muni market so far this year, which have countered the traditionally strong “January Effect.”

Technicals Improved Over the Week Amid Higher Demand and Lower Supply Conditions

Fund Flows: During the week ending January 17, weekly reporting municipal mutual funds recorded $898 million of net inflows, according to Lipper. Long-term funds recorded $828 million of inflows, high-yield funds recorded $295 million of inflows and intermediate funds recorded $194 million of inflows. This week’s inflows led year-to-date (YTD) net mutual fund flows higher to $379 million.

Supply: The muni market recorded $9 billion of new-issue volume last week, down 21% from the prior week. YTD issuance of $19 billion is 40% higher from last year’s level. This week’s calendar is expected to fall slightly to $8 billion. The largest transactions include $1.7 billion University of California Board of Regents and $540 million Commonwealth of Massachusetts.

This Week in Munis: Bucking the “January Effect”

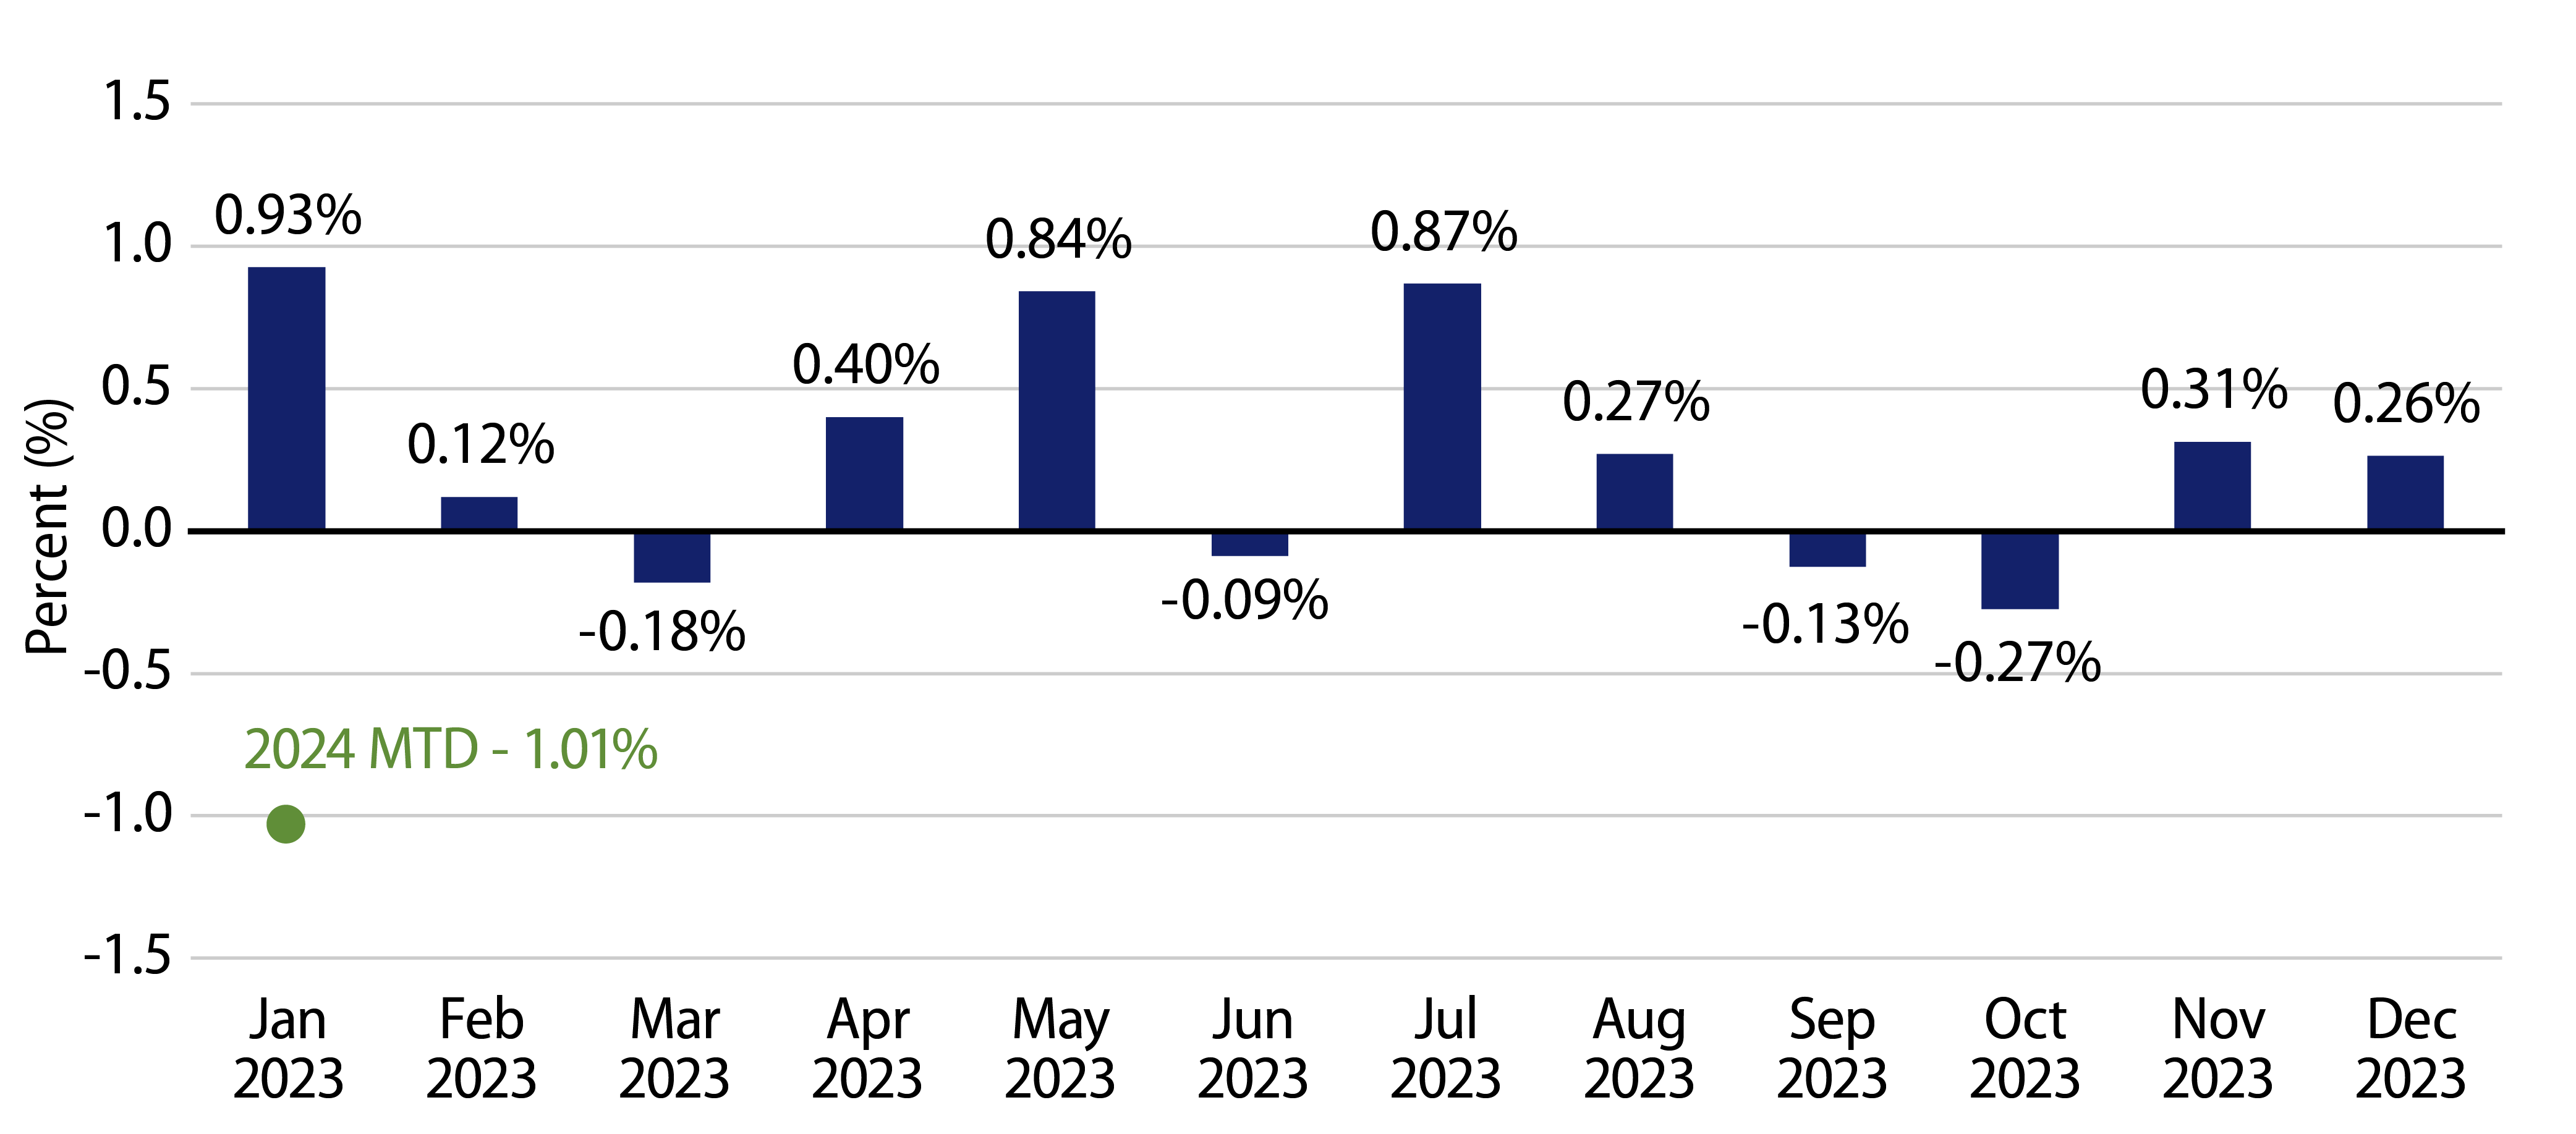
From 2009 to 2023, the month of January has represented the strongest month of total returns, averaging 0.93%. This historically strong performance is characterized by the “January Effect” of low supply as issuers return from the holidays and improved demand as investors rebalance portfolios and put seasonally high coupon payments back to work. Despite the seasonal technical strength, through the first three weeks of 2024 the Bloomberg Muni Index posted a relatively sharp negative total return of -1.01% as the muni market contended with ongoing interest-rate volatility following the strong rally at the end of 2023.

Exhibit 1: Bloomberg Muni Index Average Monthly Returns (2009 to 2023)
Bloomberg Muni Index Average Monthly Returns from 2009 to 2023
Source: Bloomberg, Western Asset. As of 19 Jan 24. Select the image to expand the view.

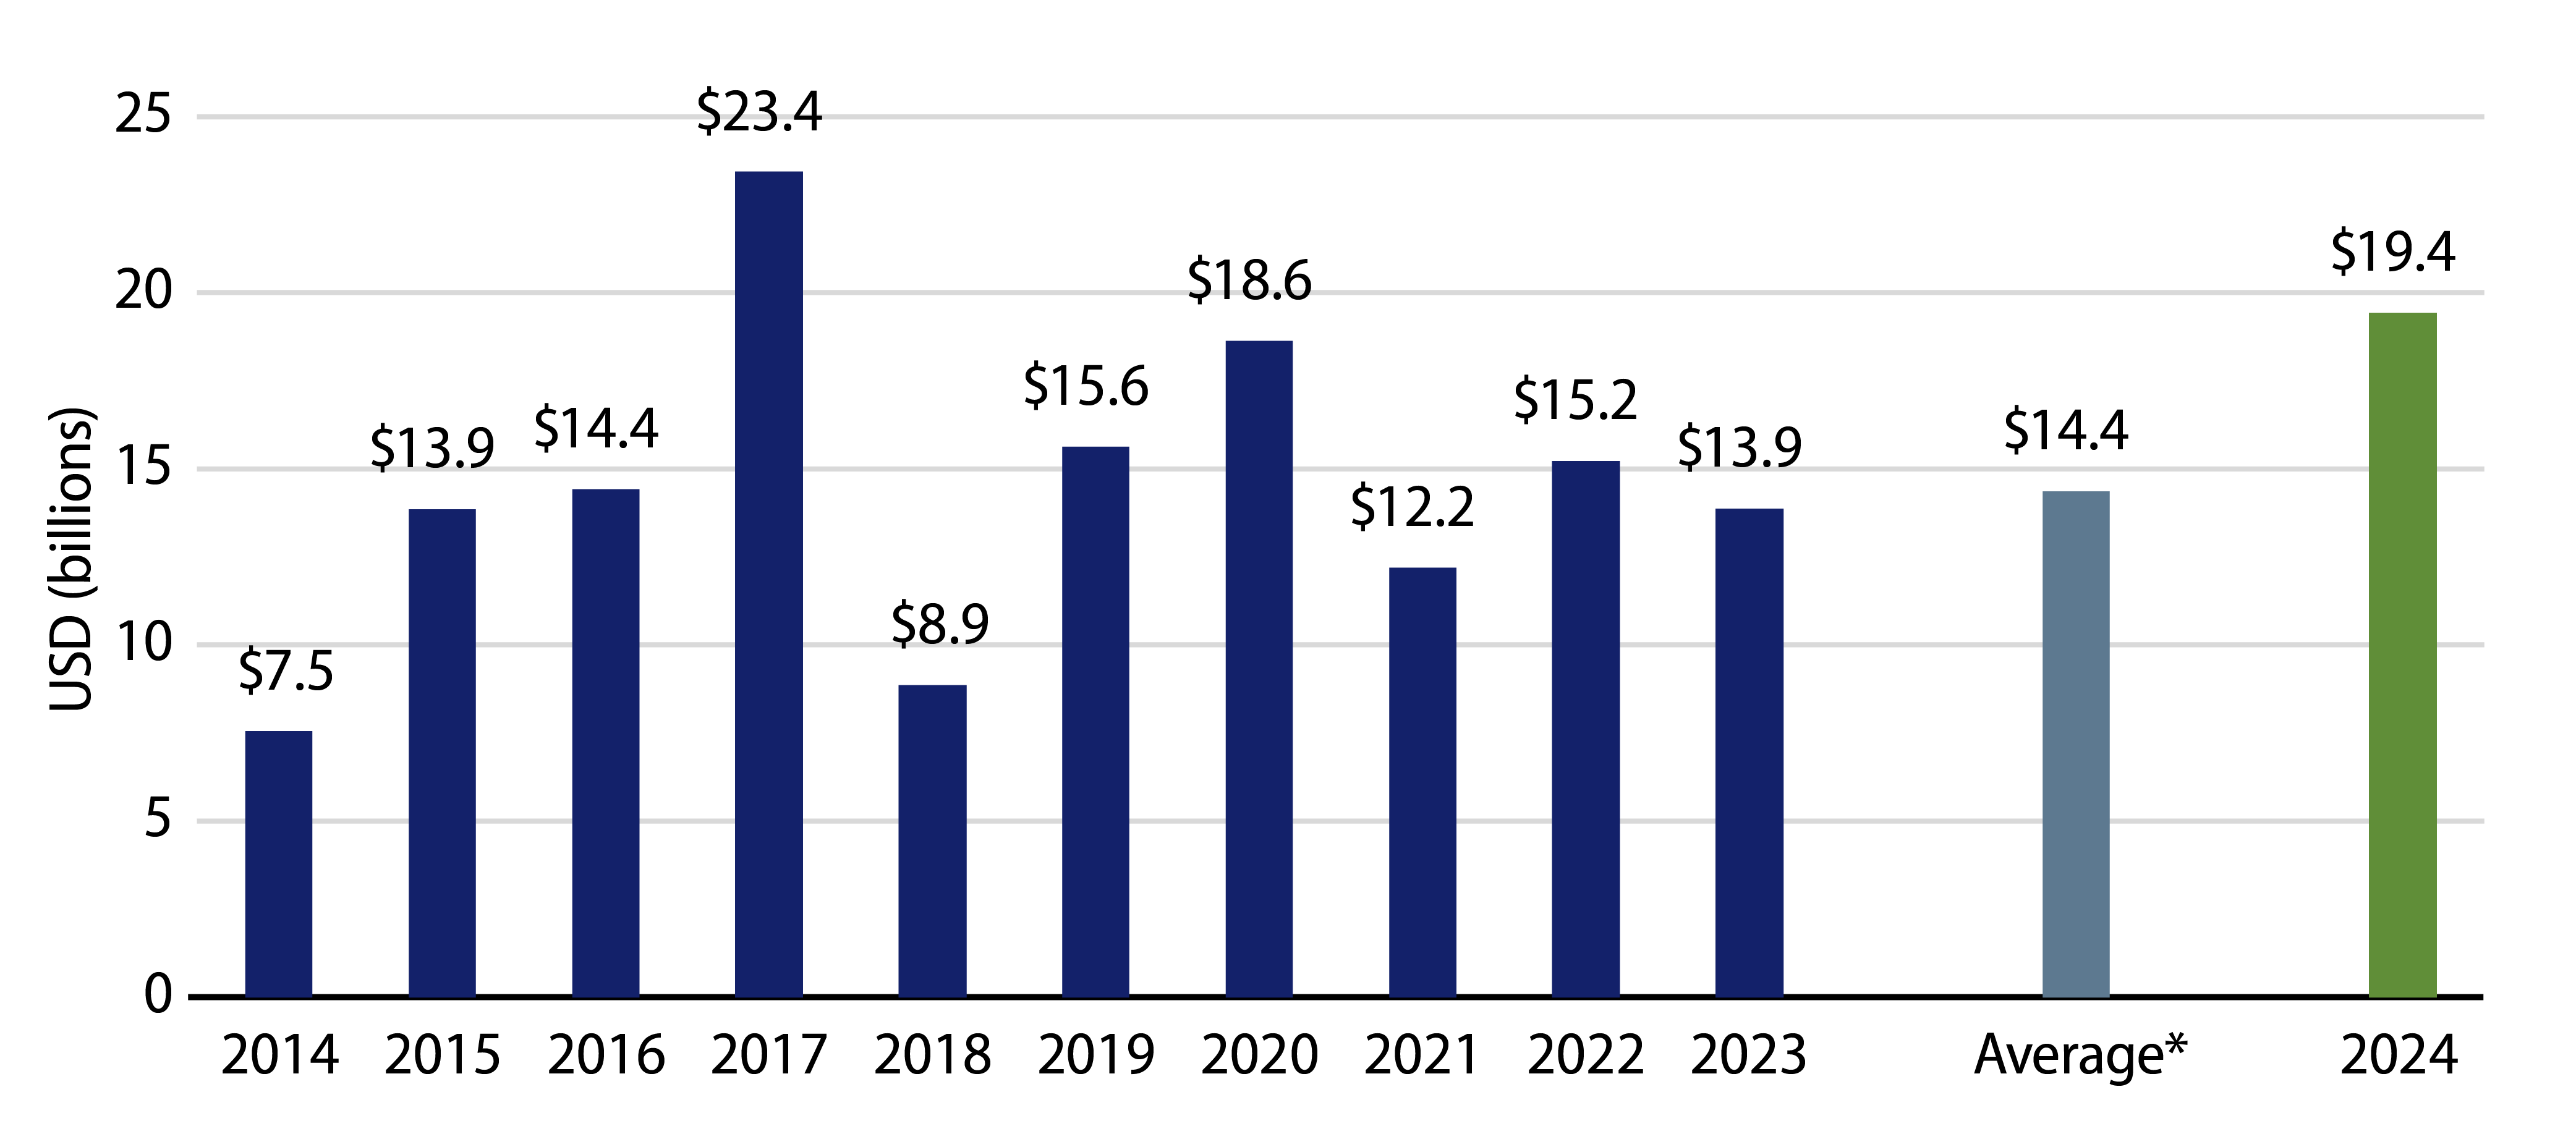
From a supply standpoint, 2024 new issuance has been greater than typically observed in January, contributing to relative market weakness. Through the first three weeks of the year, total muni new-issue supply of $19 billion was 35% above the prior 10-year average, and marked the second highest total supply level over the last decade.

Exhibit 2: Muni Issuance by Year (January 1 to January 19)
Muni Issuance by Year from January 1 to January 19
Source: Bloomberg. As of 19 Jan 24. *Average over the prior 10 years. Select the image to expand the view.

The demand perspective appears a bit more constructive for the market conditions. Through January 17, municipal mutual funds recorded nearly $379 million of inflows, according to Lipper. While the slow return of demand to muni mutual funds is positive for the market, the month’s inflows remain dwarfed by the past two consecutive years of net outflows, which surpassed $122 billion.

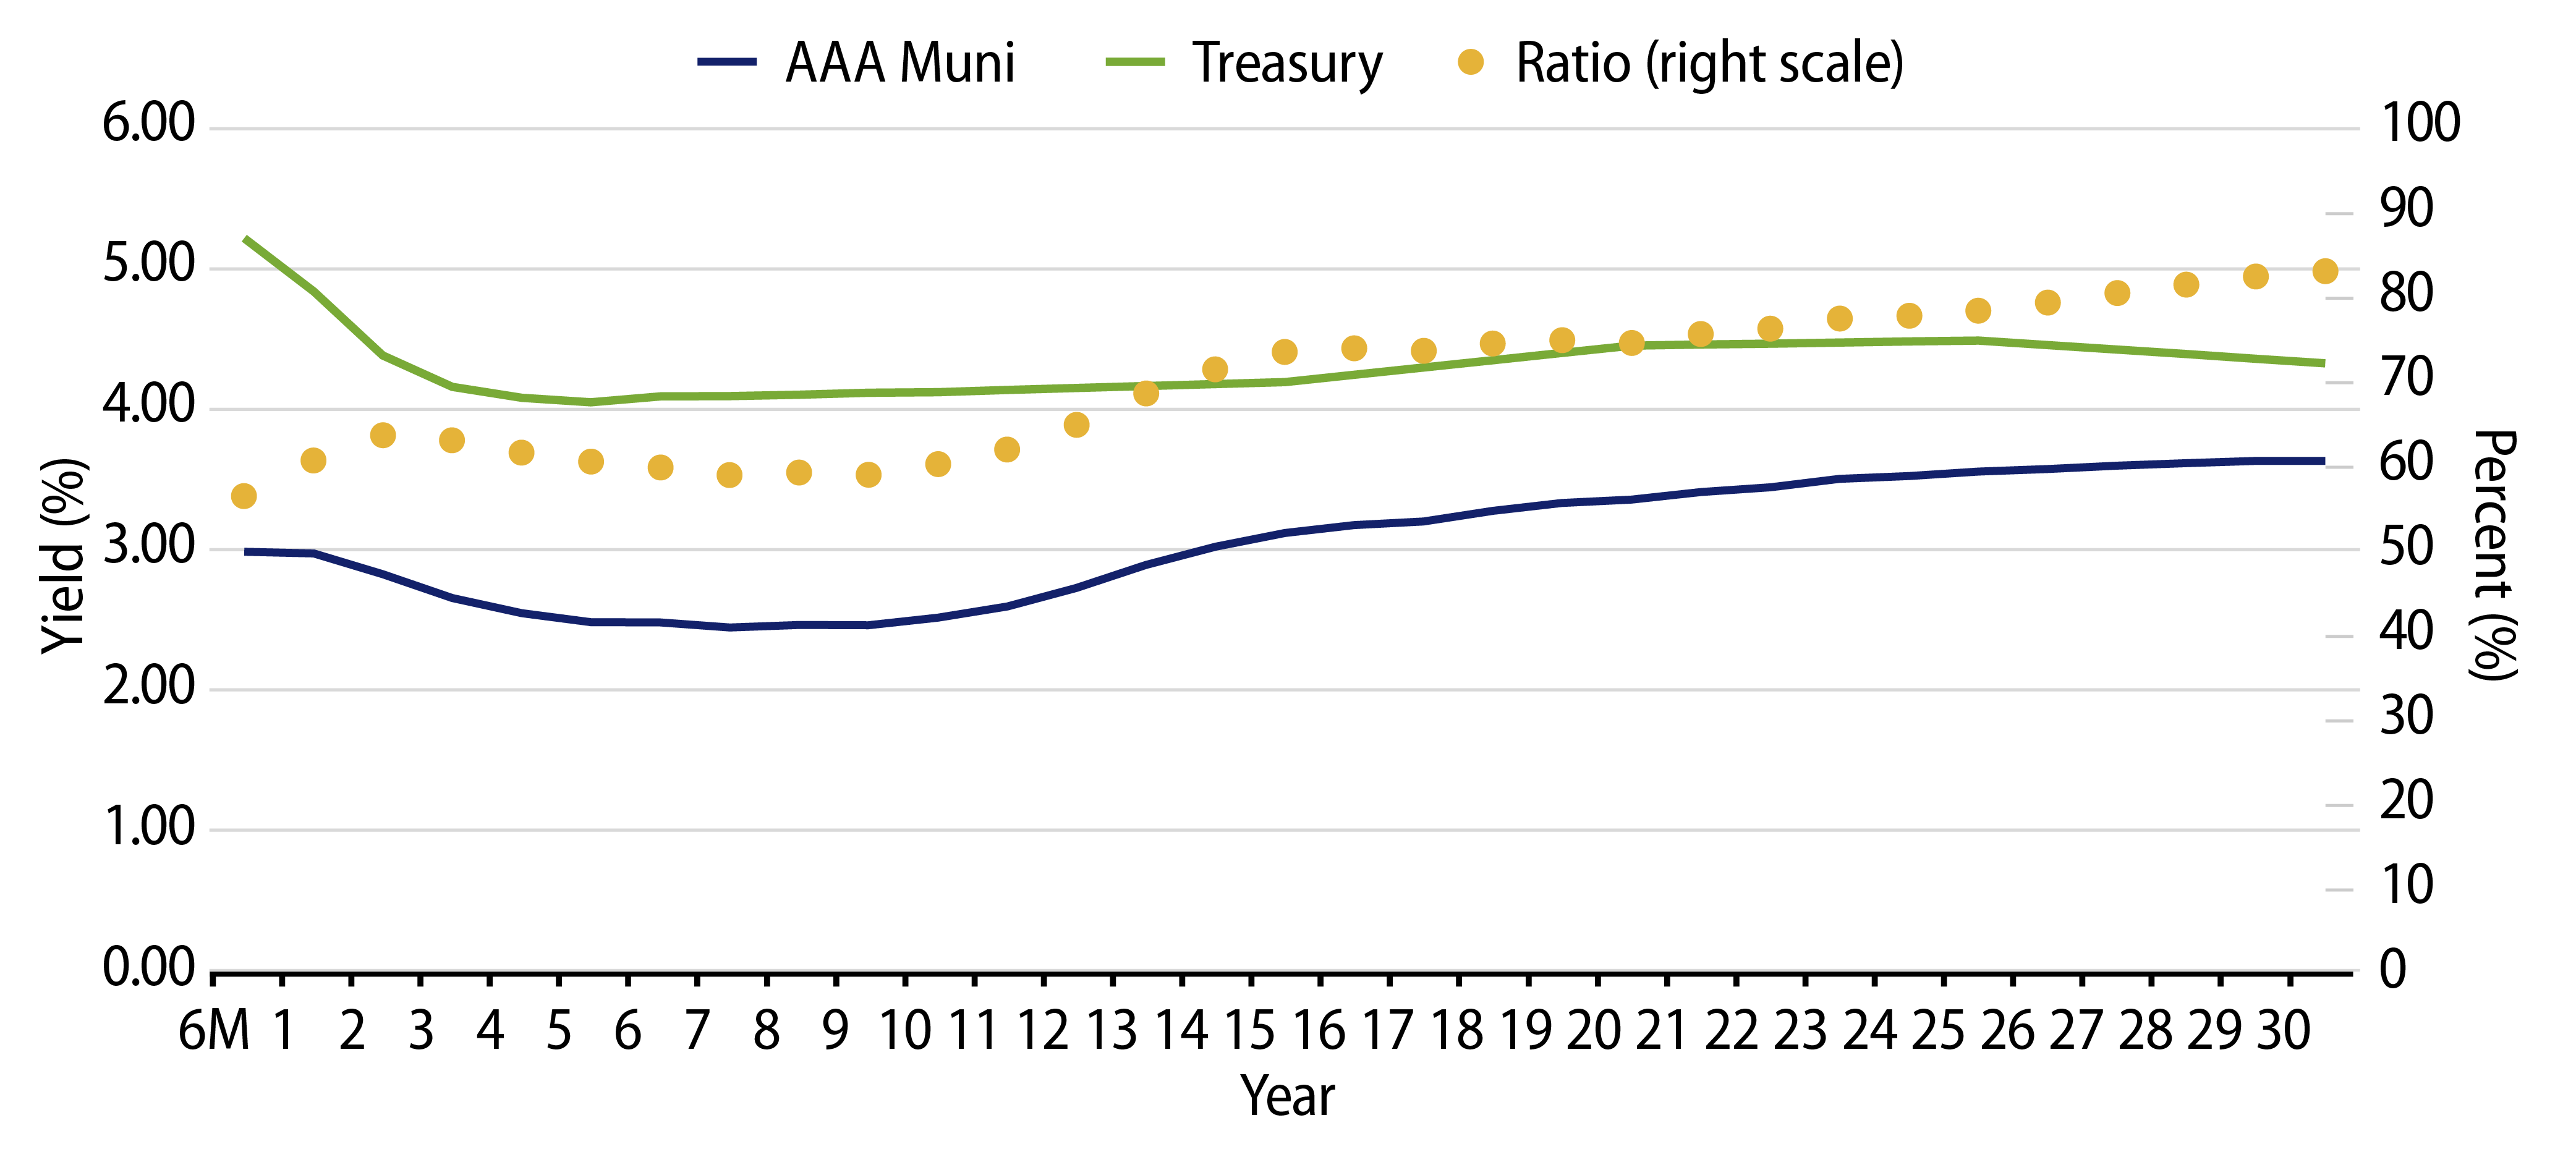
Considering the offsetting supply and demand dynamics, the negative returns that counter traditional January strength are most attributable to the extended rate volatility, and relatively rich Municipal/Treasury ratios that have led the muni investor base to question whether the 8%+ rally that occurred during the final two months of 2023 went too far, too fast. Nevertheless, the higher municipal yields observed this month should provide tax-exempt income investors a more attractive entry point than was seen at the start of the year. As municipal yields remain well above what could be achieved on average for the past decade, we believe muni investors will be rewarded by taking advantage of these tax-exempt income opportunities, particularly given the backdrop of slowing growth and inflation that could drive future yields and tax-exempt income opportunities lower.

Exhibit 3: Tax-Exempt Muni Credit Curves
Tax-Exempt Muni Credit Curves
Source: Bloomberg, Western Asset. As of 19 Jan 24. Bloomberg BVAL Municipal Credit Indices (AAA, AA, A, BBB, respectively) and US Sovereign Curves. Taxable-Equivalent Muni Credit Curves consider the top marginal effective tax rate of 40.8%. Select the image to expand the view.
Exhibit 4: Taxable-Equivalent Muni Credit Curves
Taxable-Equivalent Muni Credit Curves
Source: Bloomberg, Western Asset. As of 19 Jan 24. Bloomberg BVAL Municipal Credit Indices (AAA, AA, A, BBB, respectively) and US Sovereign Curves. Taxable-Equivalent Muni Credit Curves consider the top marginal effective tax rate of 40.8%. Select the image to expand the view.
Exhibit 5: Municipal Bond Yields and Index Returns
Municipal Bond Yields and Index Returns
Source: Bloomberg. As of 19 Jan 24. Past performance is not a guarantee of future results. It is not possible to invest directly in an Index. Select the image to expand the view.
Exhibit 6: Tax-Exempt and Taxable Muni Valuations
Tax-Exempt and Taxable Muni Valuations
Source: Bloomberg. As of 19 Jan 24. Select the image to expand the view.

Western Asset Key Themes for Muni Investors

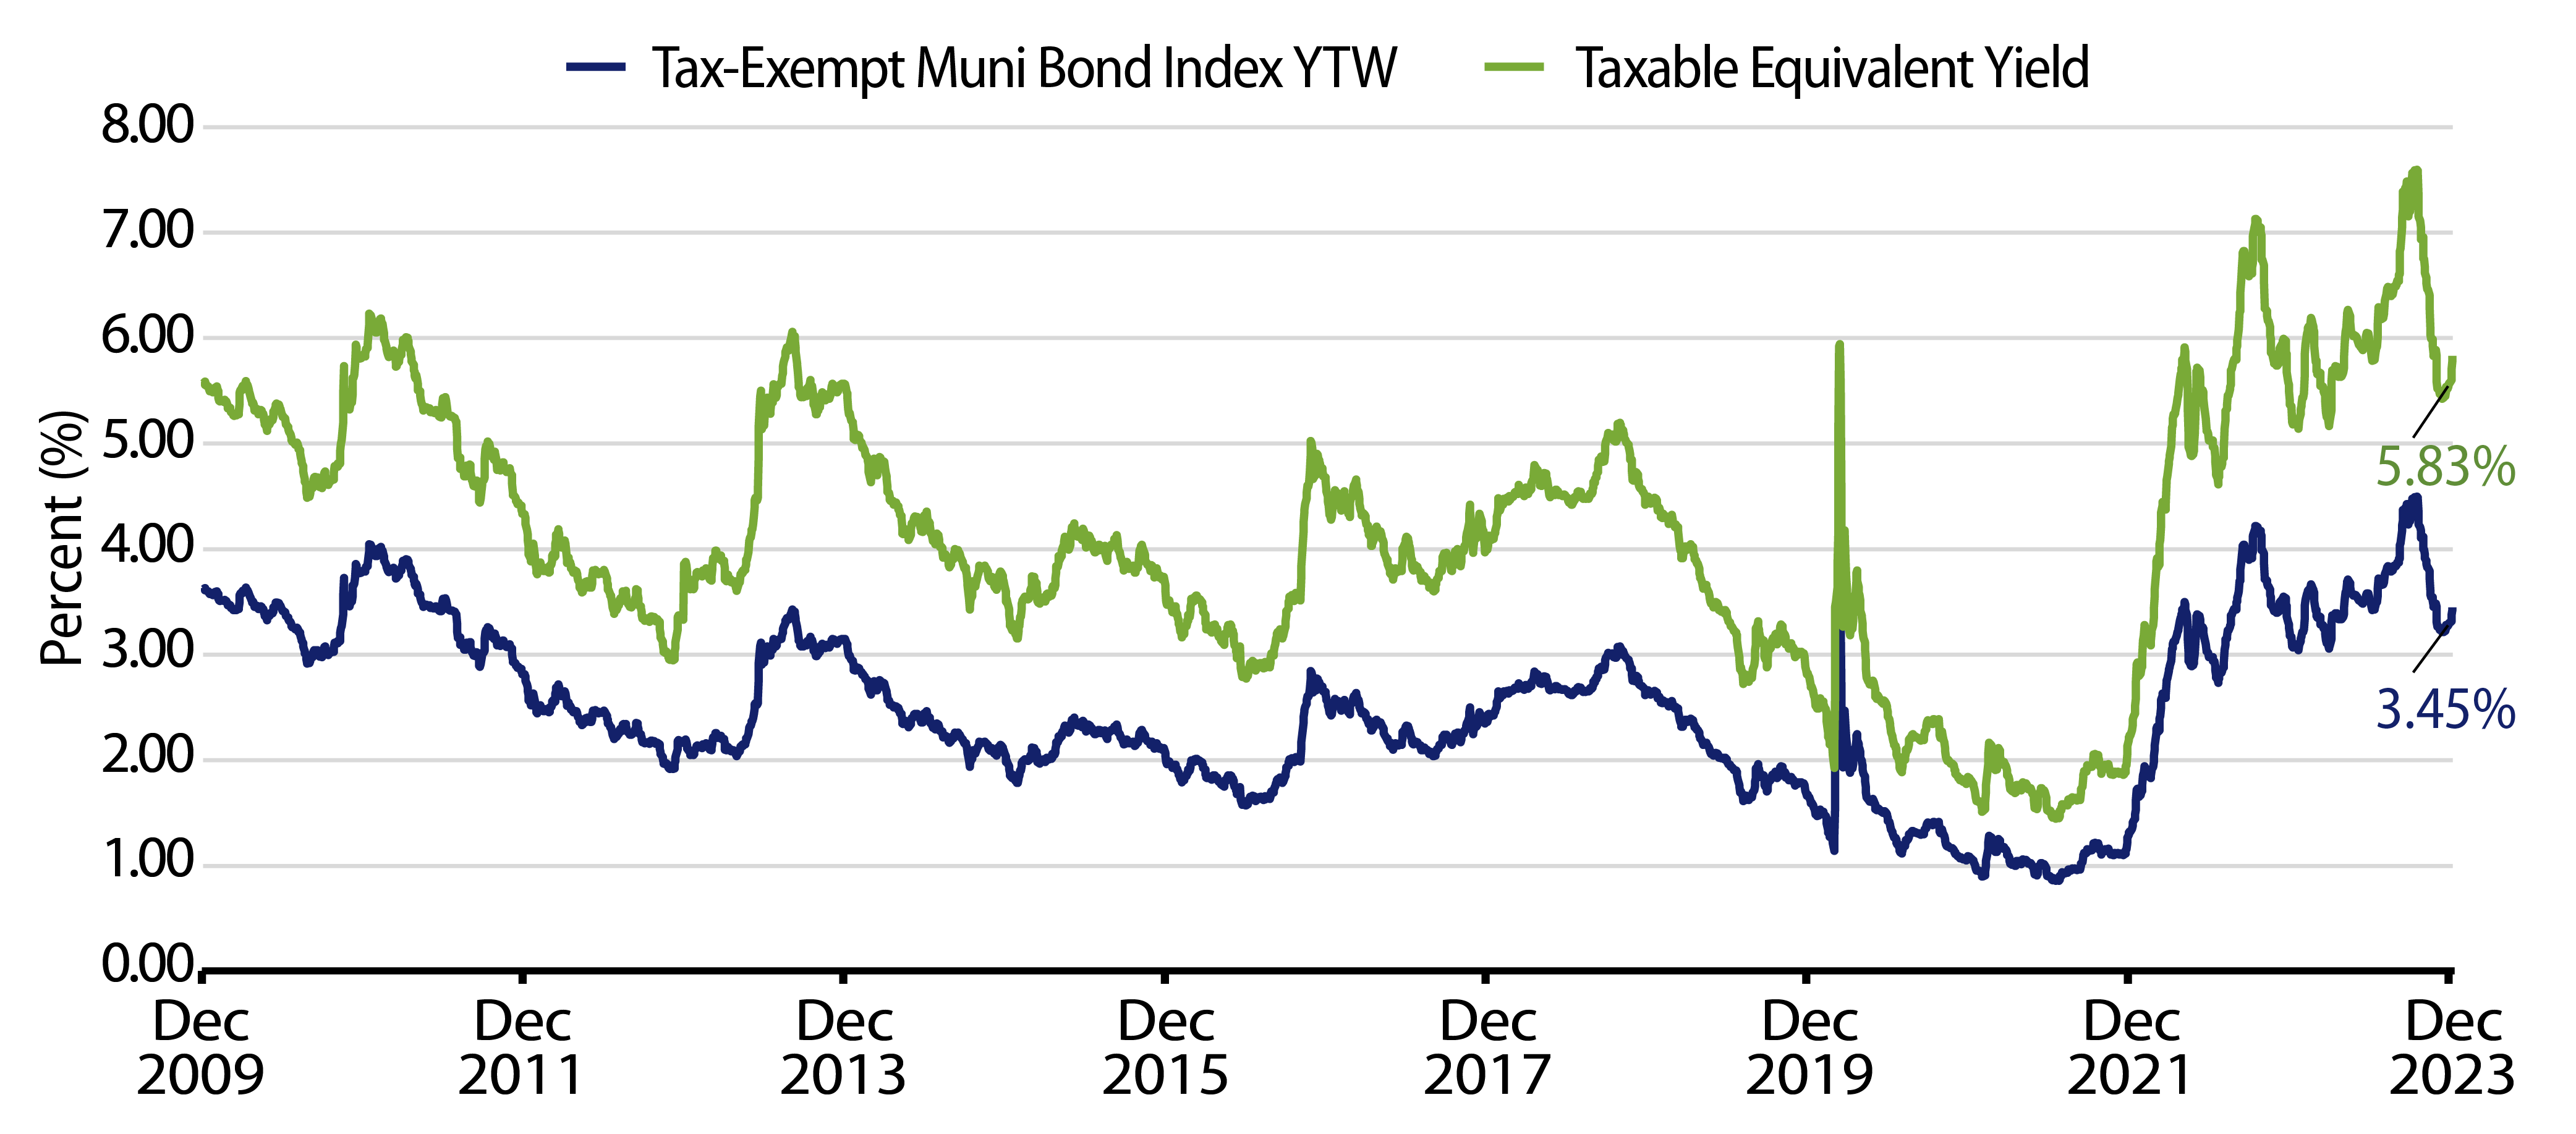
Theme #1: Municipal index yields and taxable-equivalent yields are above decade highs.

Exhibit 7: Muni and Taxable-Equivalent Muni Yield-to-Worst
Muni and Taxable-Equivalent Muni Yield-to-Worst
Source: Bloomberg, Western Asset. As of 19 Jan 24. Bloomberg Municipal Bond Index Yield Considering Highest Marginal Tax Rate. Select the image to expand the view.

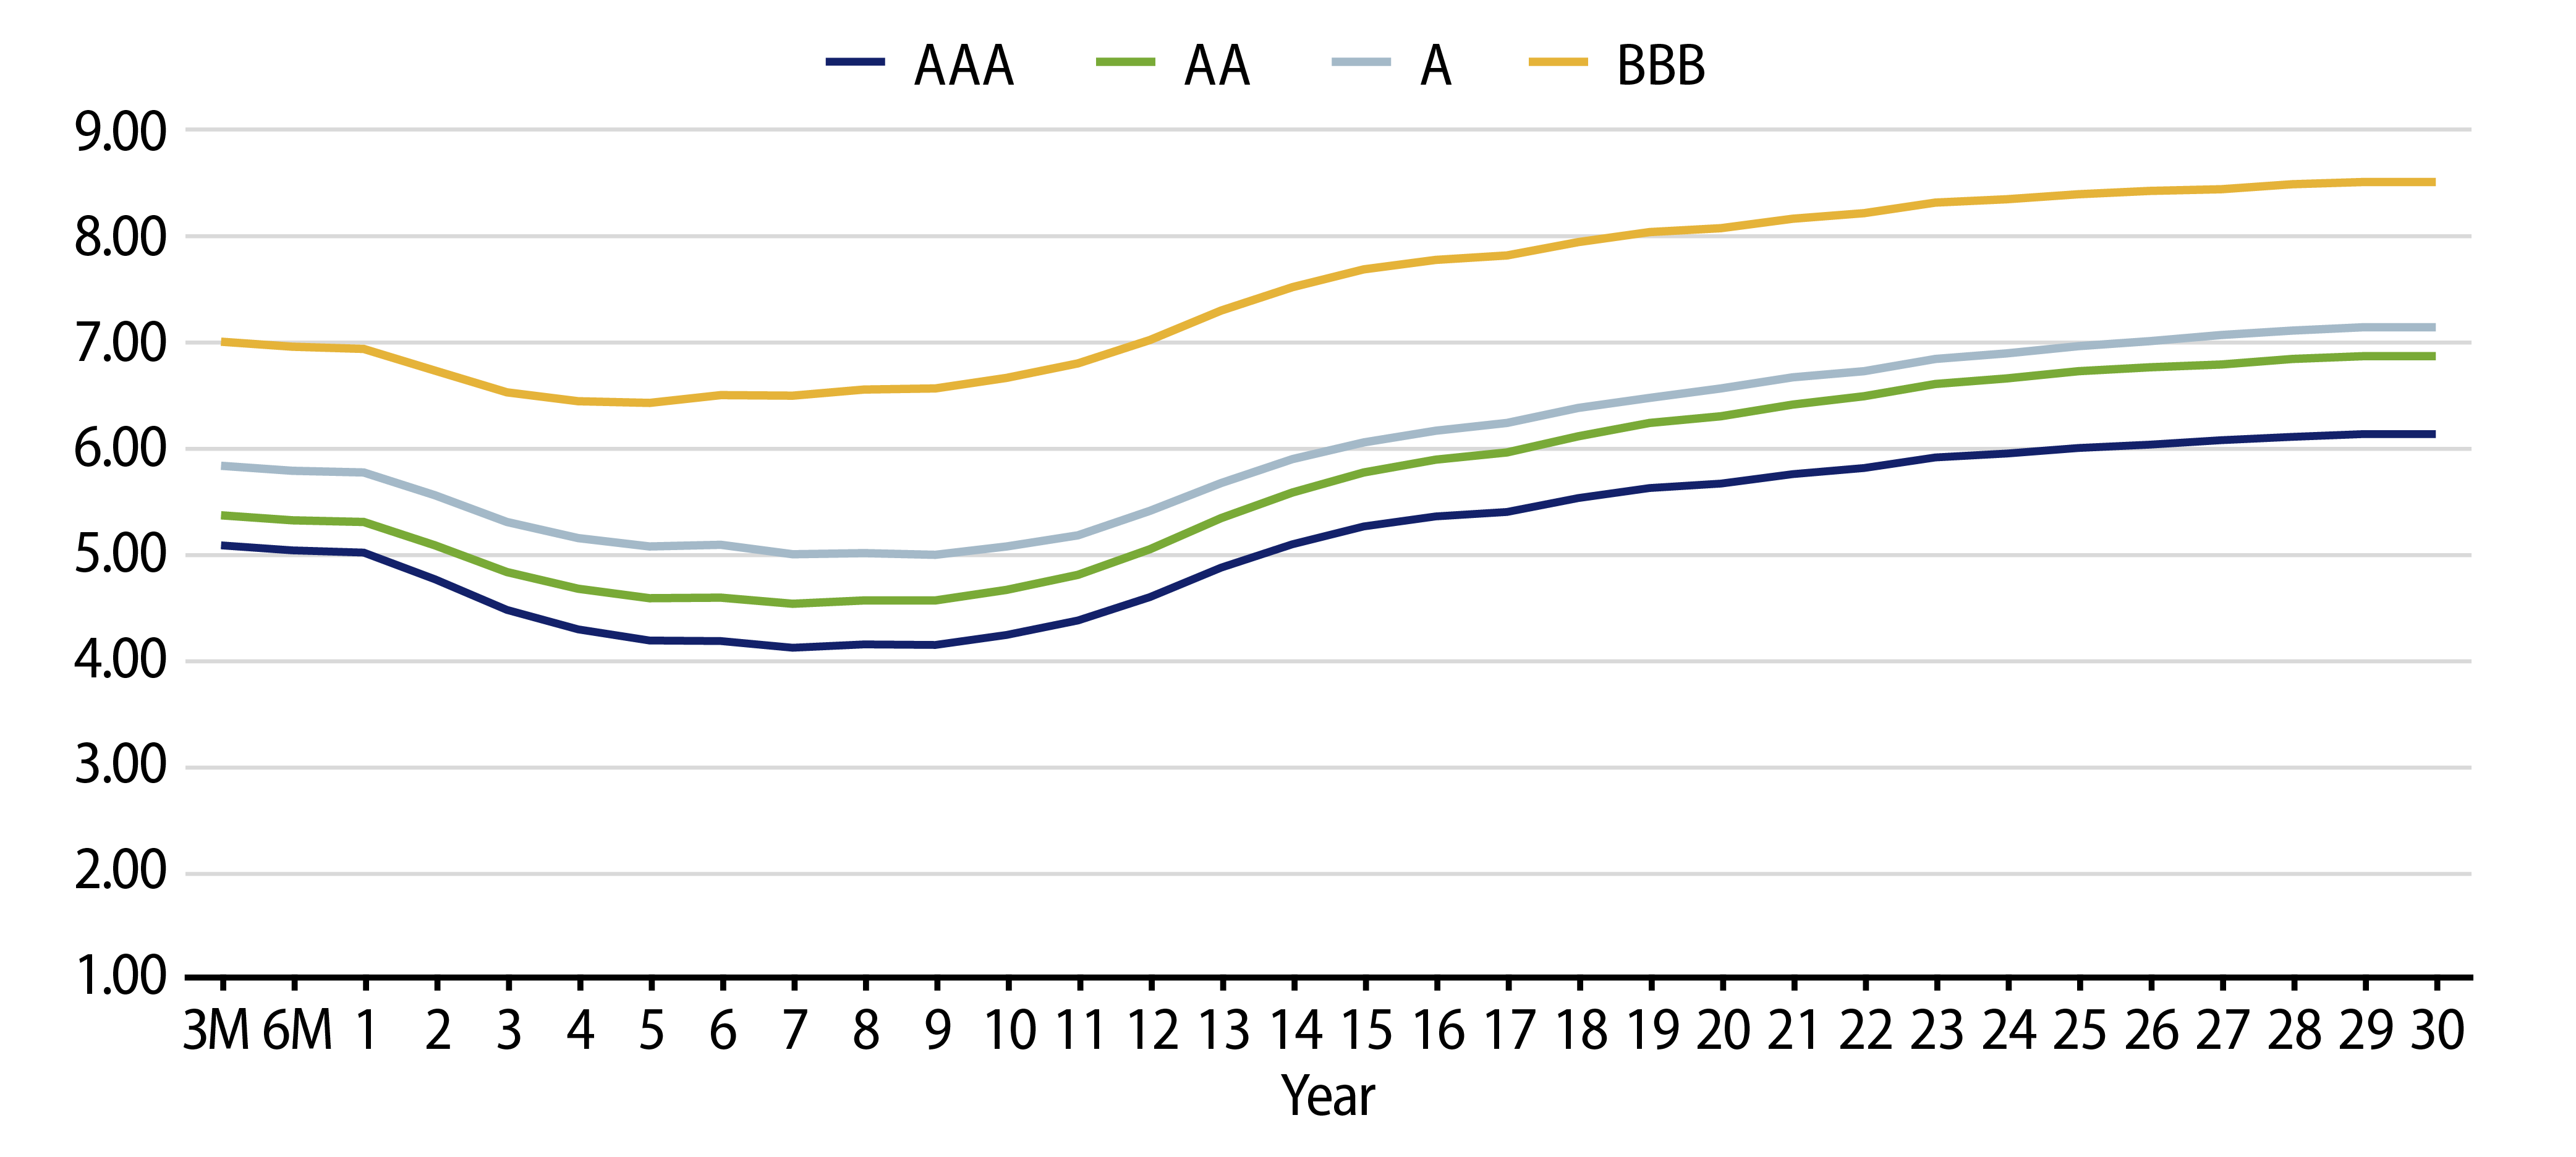
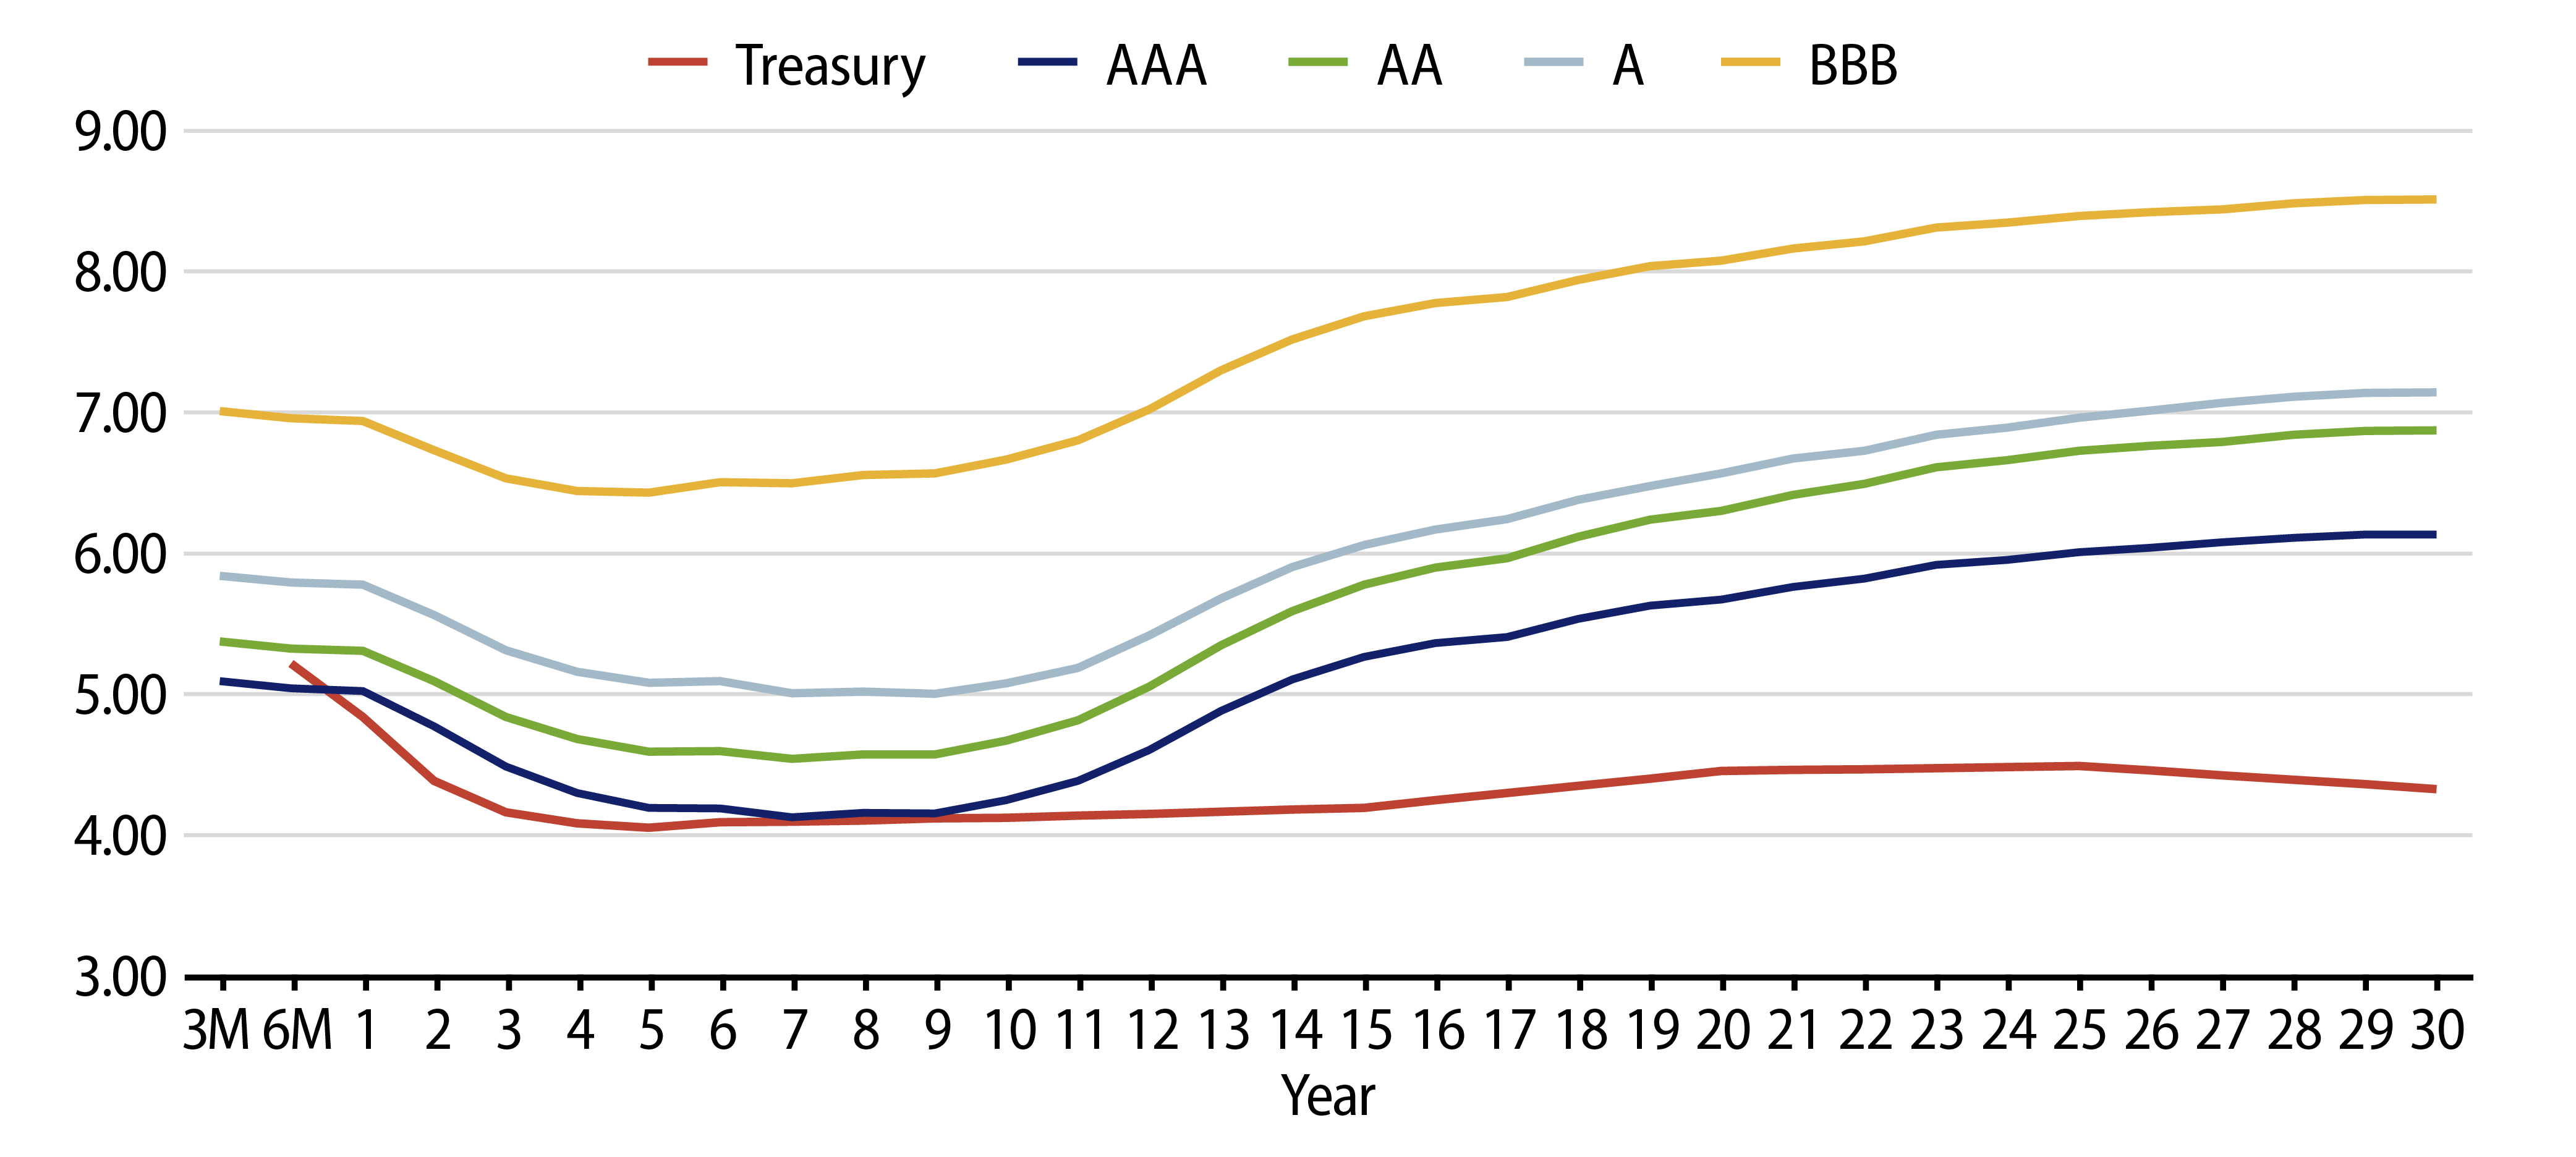
Theme #2: Recent yield curve steepening has highlighted value in moving out to longer maturities.

Exhibit 8: AAA Municipal vs. Treasury Yield Curves
AAA Municipal vs. Treasury Yield Curves
Source: Bloomberg, Western Asset. As of 19 Jan 24. Bloomberg BVAL AAA Muni Curve and US On-/Off-the-Run Sovereign Curve. Select the image to expand the view.

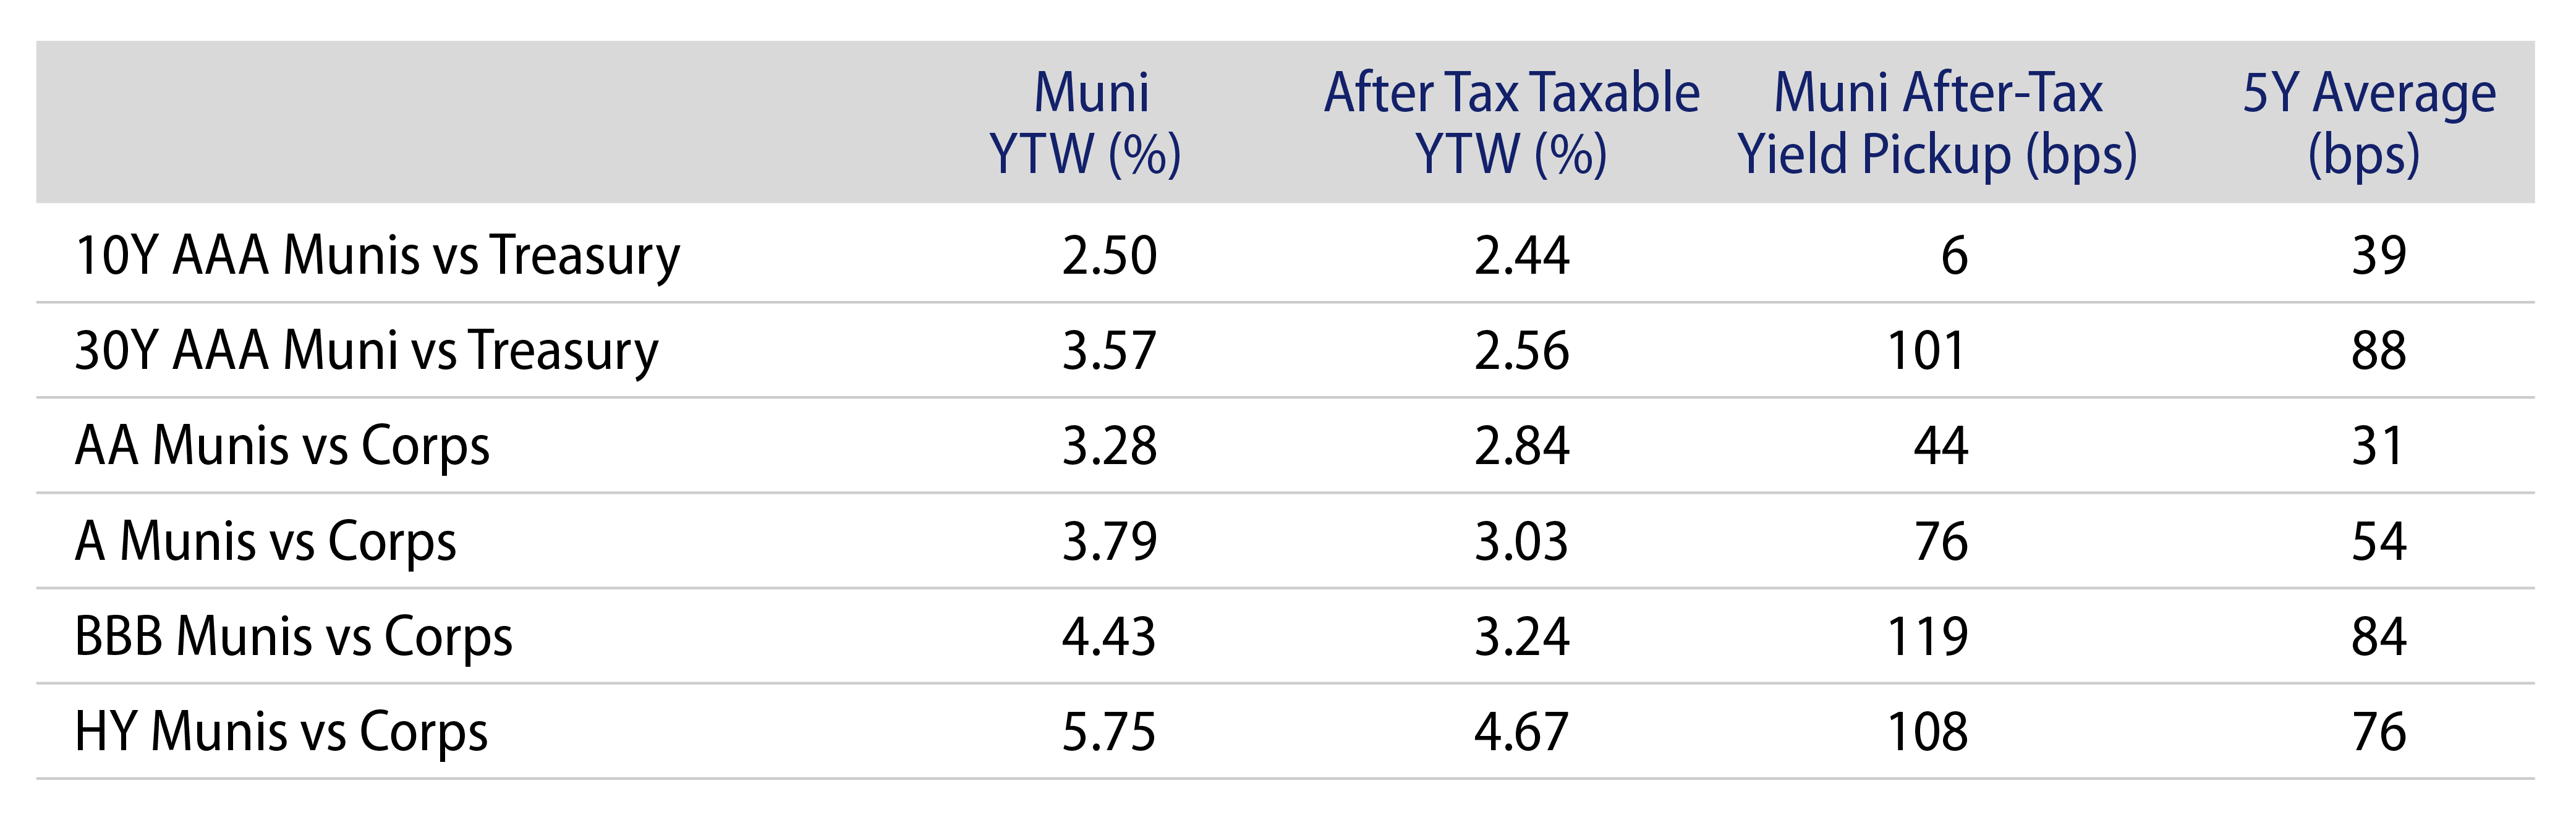
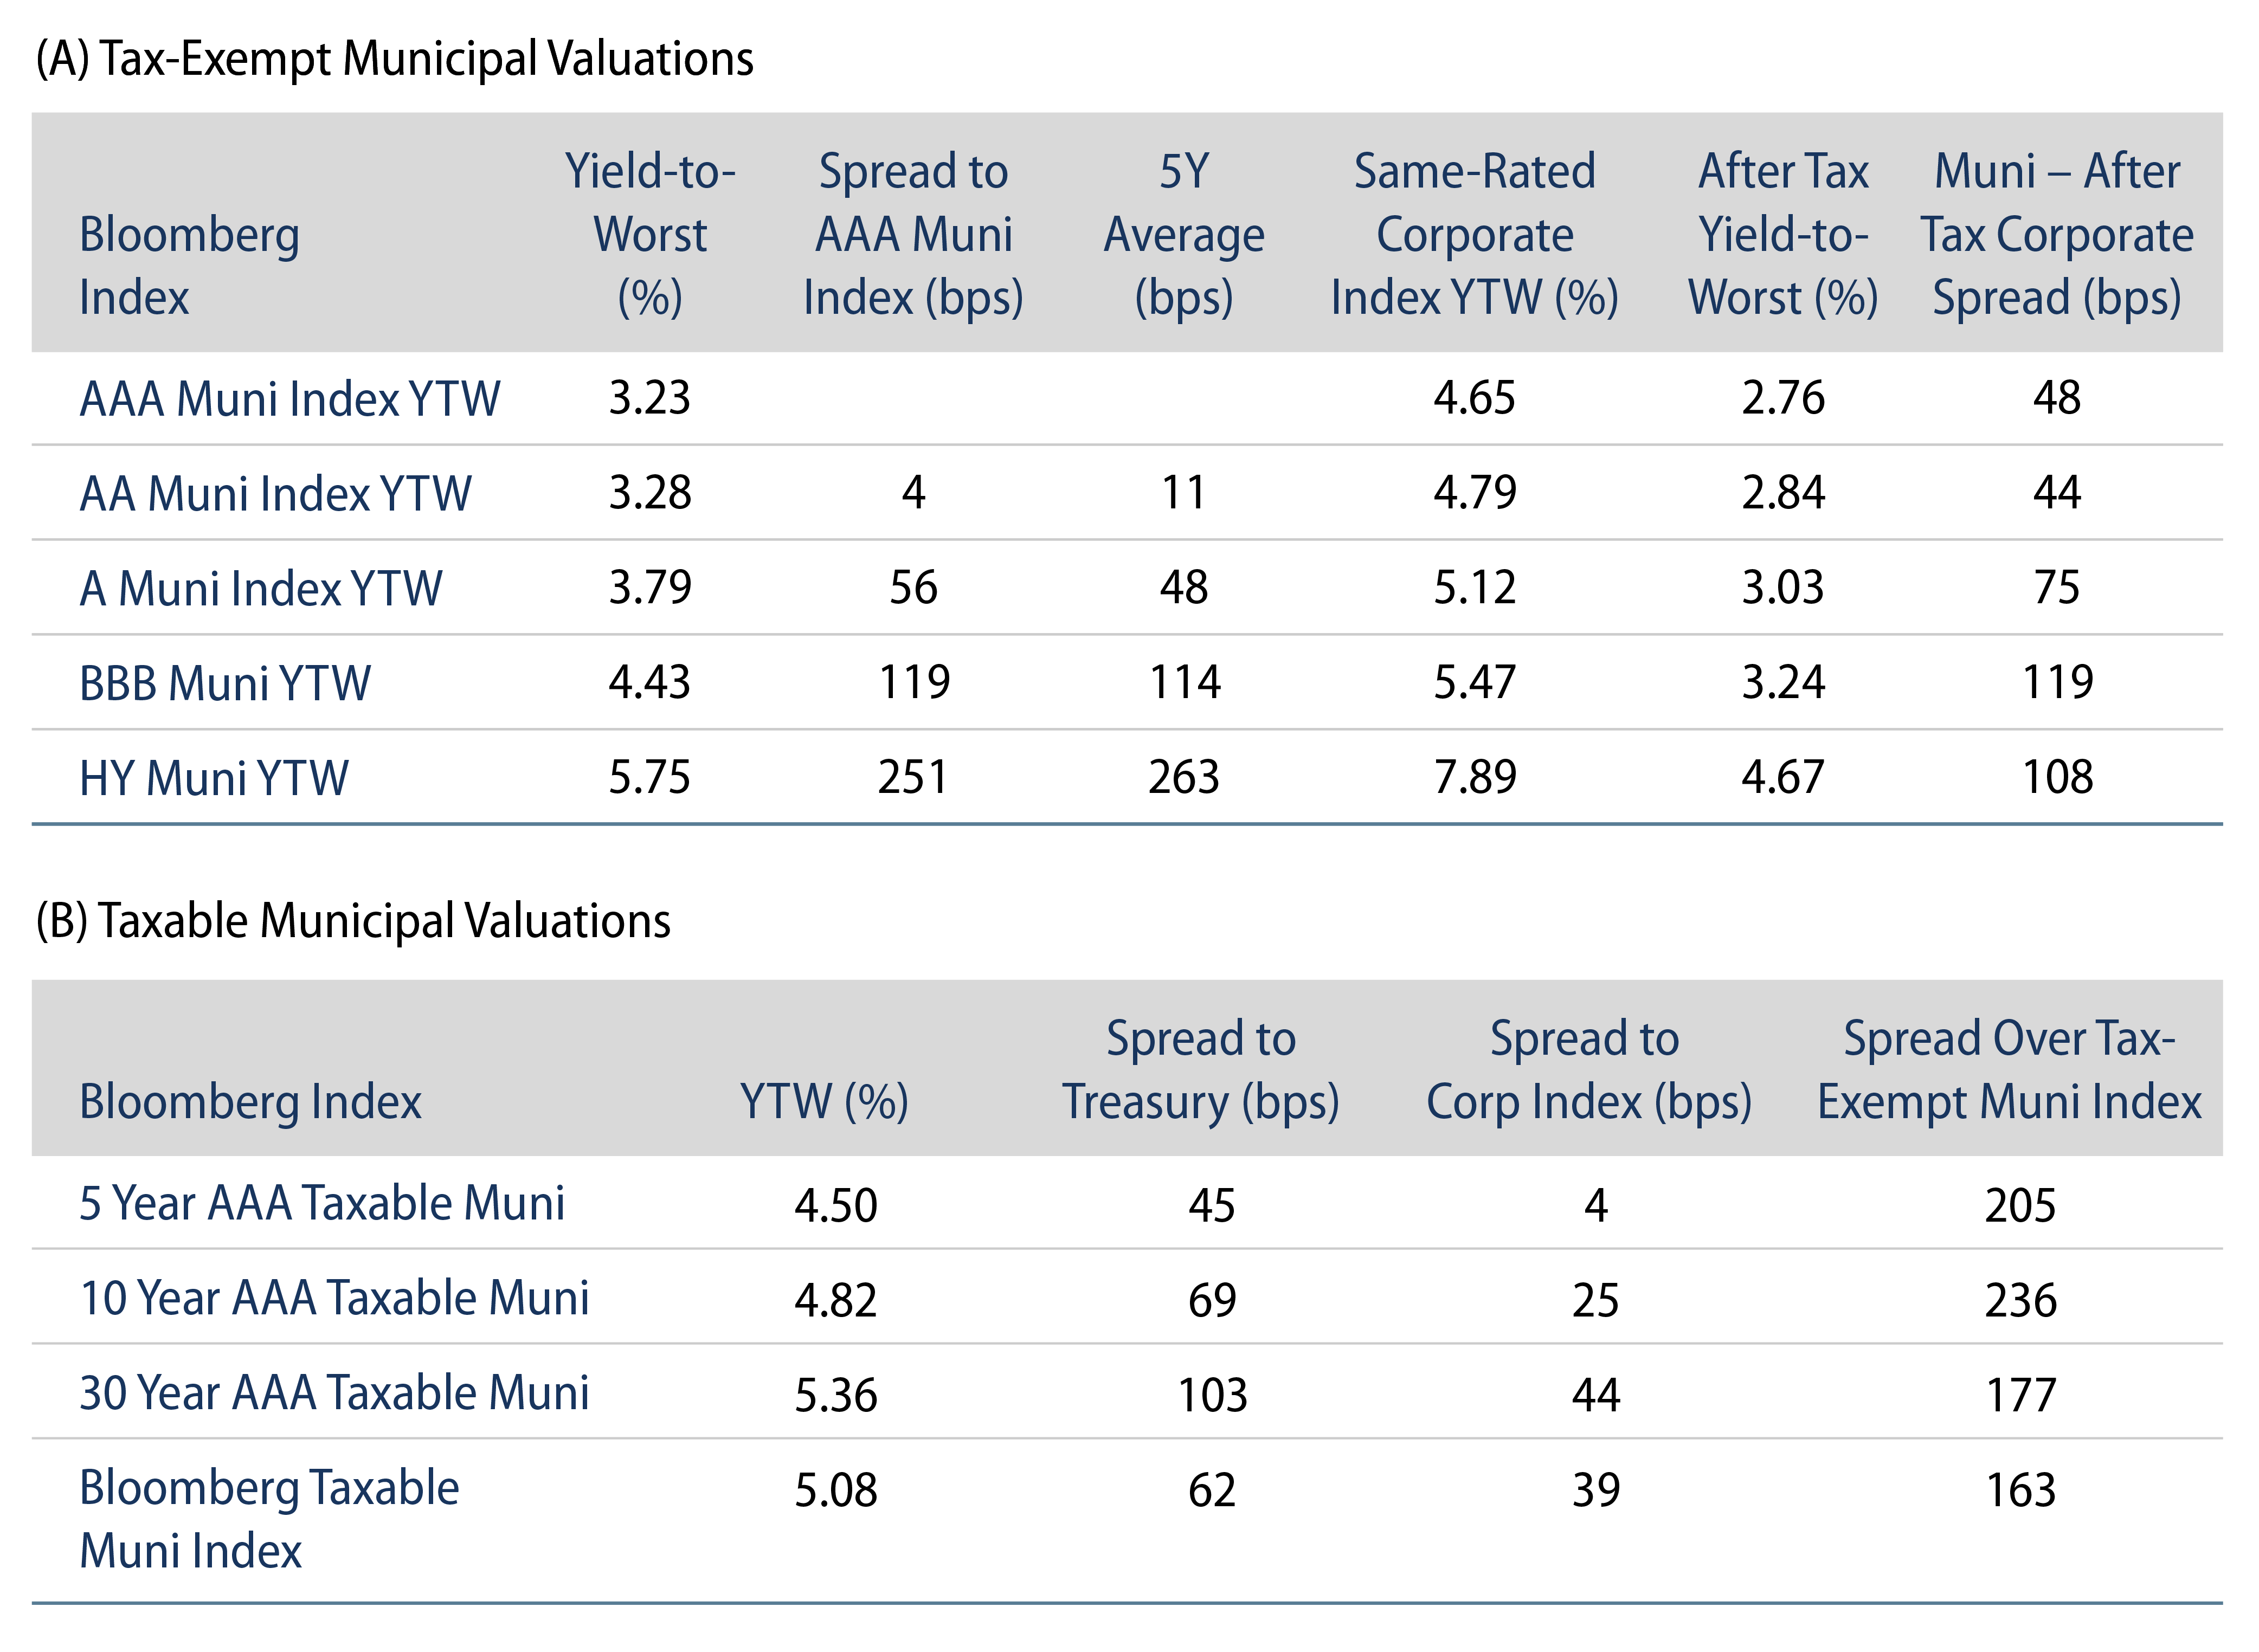
Theme #3: Munis offer attractive after-tax yield pickup versus long Treasuries and corporate credit.

Exhibit 9: Municipal vs. Taxable Fixed-Income Yields by Quality
Municipal vs. Taxable Fixed-Income Yields by Quality
Source: Western Asset, Bloomberg. As 19 Jan 24. Bloomberg BVAL AAA Muni Curve and US On-/Off-the-Run Sovereign Curve. After-tax yield considers top marginal tax rate of 40.8%. Select the image to expand the view.

© Western Asset Management Company, LLC 2024. The information contained in these materials ("the materials") is intended for the exclusive use of the designated recipient ("the recipient"). This information is proprietary and confidential and may contain commercially sensitive information, and may not be copied, reproduced or republished, in whole or in part, without the prior written consent of Western Asset Management Company ("Western Asset").
Past performance does not predict future returns. These materials should not be deemed to be a prediction or projection of future performance. These materials are intended for investment professionals including professional clients, eligible counterparties, and qualified investors only.
These materials have been produced for illustrative and informational purposes only. These materials contain Western Asset's opinions and beliefs as of the date designated on the materials; these views are subject to change and may not reflect real-time market developments and investment views.
Third party data may be used throughout the materials, and this data is believed to be accurate to the best of Western Asset's knowledge at the time of publication, but cannot be guaranteed. These materials may also contain strategy or product awards or rankings from independent third parties or industry publications which are based on unbiased quantitative and/or qualitative information determined independently by each third party or publication. In some cases, Western Asset may subscribe to these third party's standard industry services or publications. These standard subscriptions and services are available to all asset managers and do not influence rankings or awards in any way.
Investment strategies or products discussed herein may involve a high degree of risk, including the loss of some or all capital. Investments in any products or strategies described in these materials may be volatile, and investors should have the financial ability and willingness to accept such risks.
Unless otherwise noted, investment performance contained in these materials is reflective of a strategy composite. All other strategy data and information included in these materials reflects a representative portfolio which is an account in the composite that Western Asset believes most closely reflects the current portfolio management style of the strategy. Performance is not a consideration in the selection of the representative portfolio. The characteristics of the representative portfolio shown may differ from other accounts in the composite. Information regarding the representative portfolio and the other accounts in the composite are available upon request. Statements in these materials should not be considered investment advice. References, either general or specific, to securities and/or issuers in the materials are for illustrative purposes only and are not intended to be, and should not be interpreted as, recommendation to purchase or sell such securities. Employees and/or clients of Western Asset may have a position in the securities or issuers mentioned.
These materials are not intended to provide, and should not be relied on for, accounting, legal, tax, investment or other advice. The recipient should consult its own counsel, accountant, investment, tax, and any other advisers for this advice, including economic risks and merits, related to making an investment with Western Asset. The recipient is responsible for observing the applicable laws and regulations of their country of residence.
Founded in 1971, Western Asset Management Company is a global fixed-income investment manager with offices in Pasadena, New York, London, Singapore, Tokyo, Melbourne, São Paulo, Hong Kong, and Zürich. Western Asset is a wholly owned subsidiary of Franklin Resources, Inc. but operates autonomously. Western Asset is comprised of six legal entities across the globe, each with distinct regional registrations: Western Asset Management Company, LLC, a registered Investment Adviser with the Securities and Exchange Commission; Western Asset Management Company Distribuidora de Títulos e Valores Mobiliários Limitada is authorized and regulated by Comissão de Valores Mobiliários and Brazilian Central Bank; Western Asset Management Company Pty Ltd ABN 41 117 767 923 is the holder of the Australian Financial Services License 303160; Western Asset Management Company Pte. Ltd. Co. Reg. No. 200007692R is a holder of a Capital Markets Services License for fund management and regulated by the Monetary Authority of Singapore; Western Asset Management Company Ltd, a registered Financial Instruments Business Operator and regulated by the Financial Services Agency of Japan; and Western Asset Management Company Limited is authorised and regulated by the Financial Conduct Authority ("FCA") (FRN 145930). This communication is intended for distribution to Professional Clients only if deemed to be a financial promotion in the UK as defined by the FCA. This communication may also be intended for certain EEA countries where Western Asset has been granted permission to do so. For the current list of the approved EEA countries please contact Western Asset at +44 (0)20 7422 3000.