

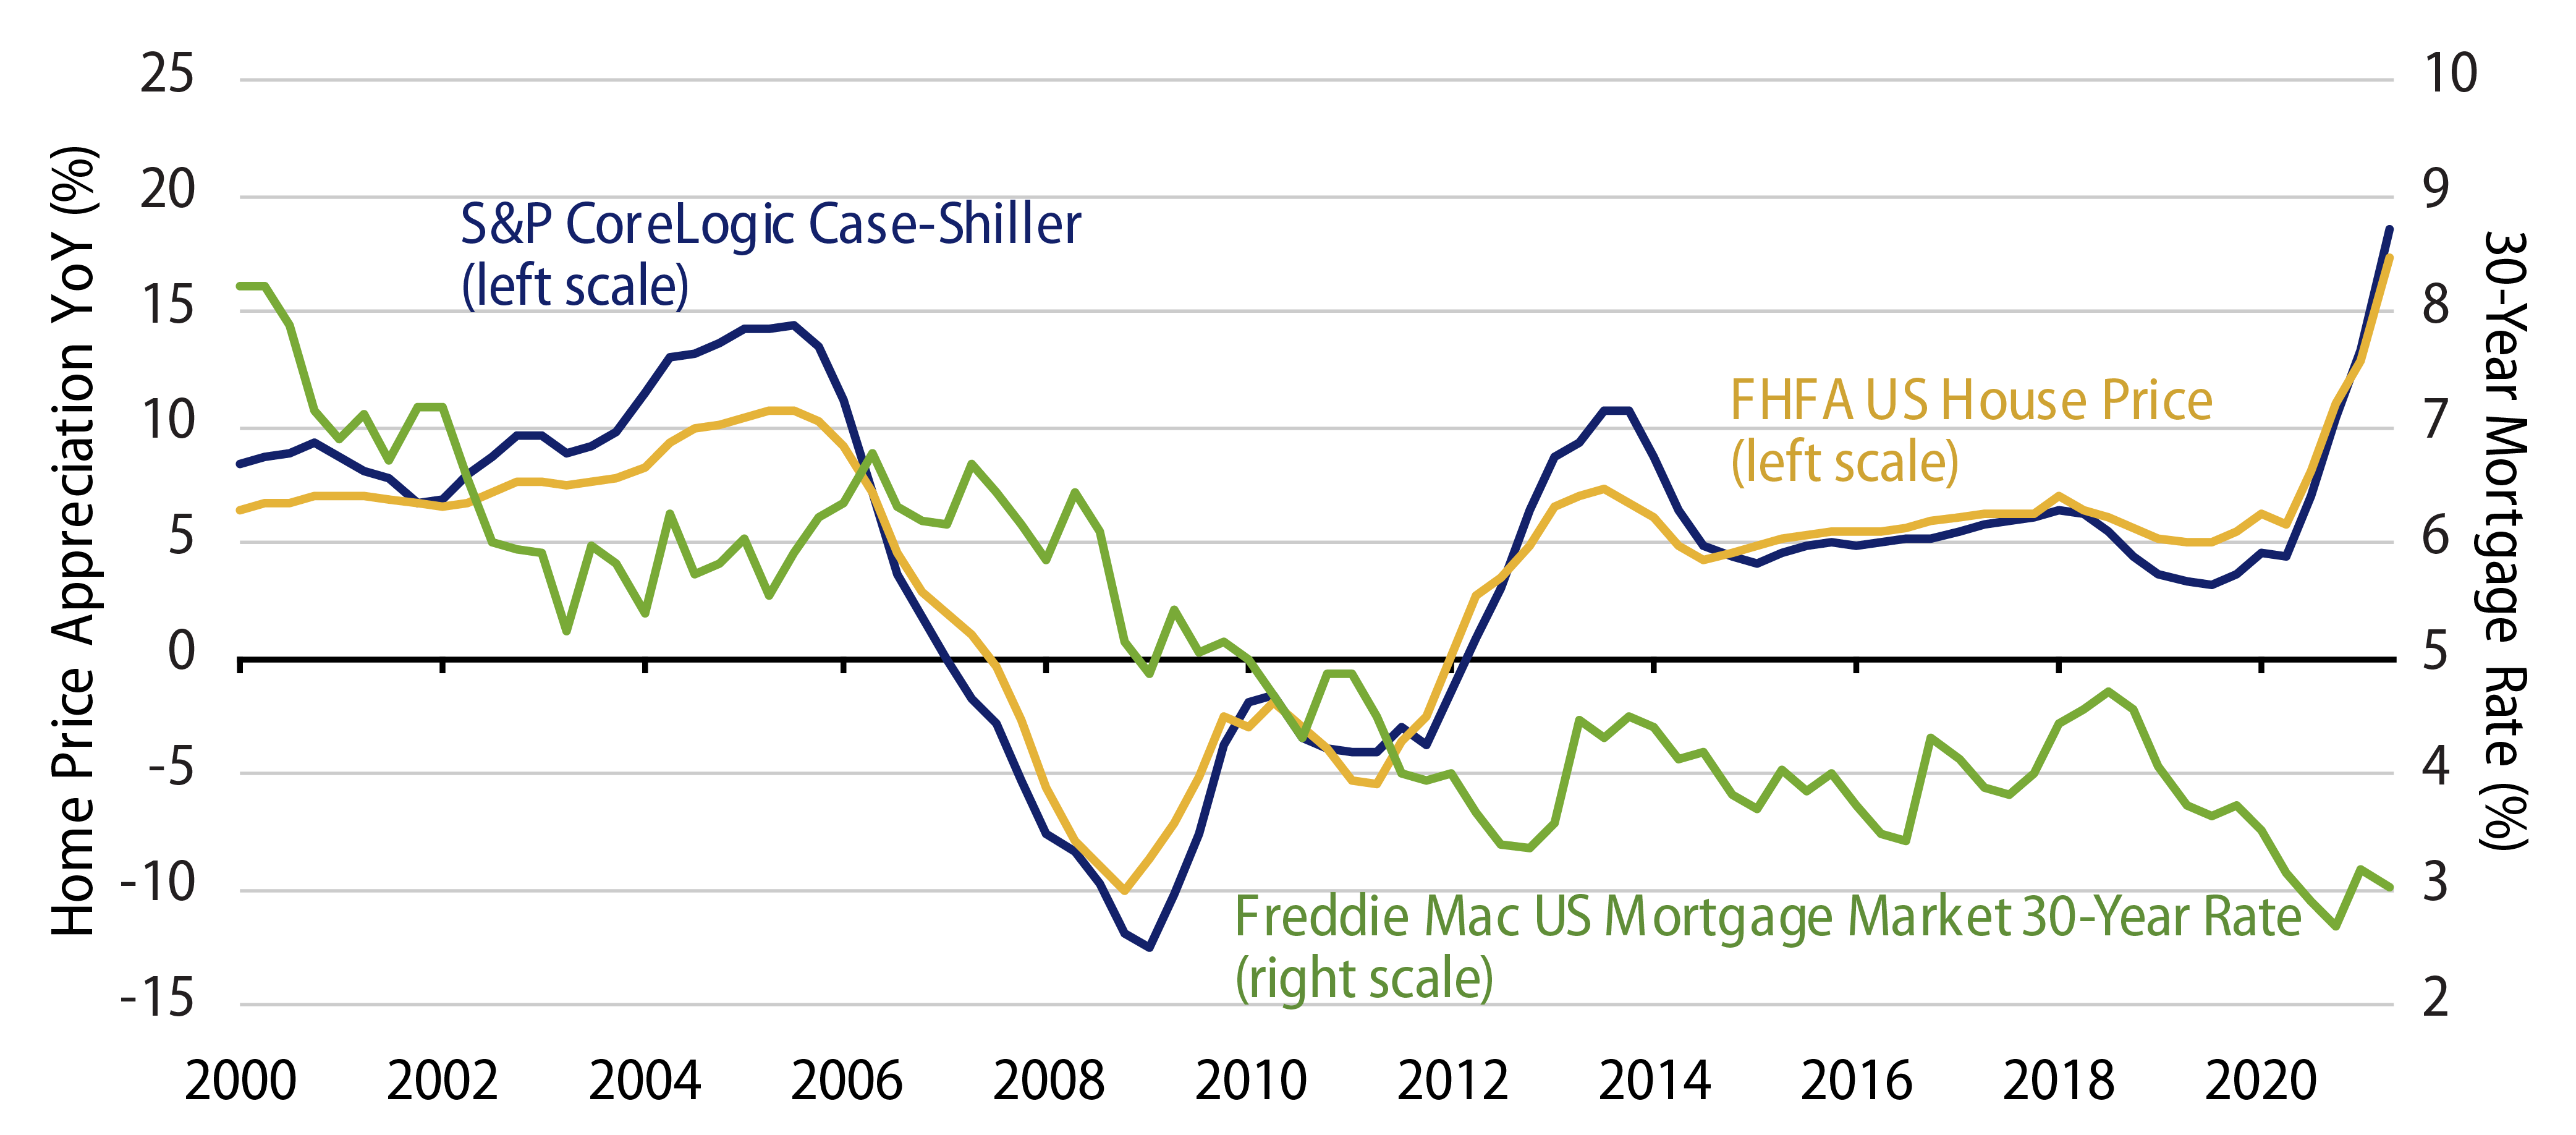
US housing data has begun to show a cooling cycle emerging from what has been a hot housing market. Perhaps one of the more noticeable data points of late is the recent change to the median price of existing homes sold, down 0.8% month-over-month. This is the first downward movement in price action since the start of the year. While July reports for both the S&P/Case-Shiller and the Federal Housing Finance Authority (FHFA) home price indices have reached multi-decade highs, various data points suggest a cooling has begun to take hold. The question a number of people are asking is whether this is in fact a gradual cooling or the beginning of a “burst” in housing, implying we have been otherwise experiencing a bubble. What would make this a cooling off rather than a bursting bubble? In a word, fundamentals.
Through various mechanisms, mortgage underwriting today is performed much more responsibly than it was prior to the global financial crisis (GFC) of 2008. A consequence of this is that consumers are less burdened with mortgage payments. In response to strong housing demand and low mortgage rates, new-home inventories are up—but nowhere near the levels present prior to the GFC—and currently there does not appear to be any danger of a supply glut. The housing market today is built on a foundation of much stronger fundamentals and support than it was leading up to the GFC.
While roughly 15 years separate today from the dark days of the GFC, the memories and lessons learned are not so distant. Many technical aspects of the housing market today resemble those of 2005 and 2006. For example, throughout 2005, yearly home price growth was in the low double-digits, much like we have had in 2020 and 2021. The rise in prices this year, however, has been heavily influenced by an increased need for housing and at-home workspace due to the COVID-19 pandemic. Still, it is true that home prices were steadily rising well before the pandemic took hold. Low mortgage rates have also contributed to the recent increase in home prices, but rates were relatively low during the 2005 and 2006 time frame as well. What’s critically different this time around is that the mortgage products available are much more traditional and have been designed with many more regulatory safeguards than the early 2000s. Robust underwriting and regulatory oversight have given fundamental strength to today’s housing market, including its ability to withstand home price fluctuations and swings in economic conditions.
The mortgage products being employed today are fundamental to the strength of the mortgage market. By contrast, the products that contributed to the GFC are commonly referred to as “affordability products.” Created with little regulatory oversight, lenders were free to give loans to borrowers based on loose underwriting guidelines and limited financial verification. Lenders were then able to sell those mortgages into securitizations and virtually wash their hands clean of any liability. Due to post-GFC regulatory requirements, predominantly created by Dodd-Frank, those loose forms of lending and securitization no longer take place. Standards such as Qualified Mortgages (QM) and Ability to Repay (ATR) were put in place to impose responsibilities on mortgage lenders. Lenders have the responsibility to create mortgage products that borrowers can repay and to lend against properties with verifiable appraisals. In addition to overhauling mortgage underwriting standards, regulations were created that require sponsors of securitized transactions to retain risk in the deals they sell to investors. This mechanism of “risk retention” puts the sponsor of a securitization in a similar risk position as securitized investors. Depending on the specifics of the transaction, sponsors are required to retain particular portions of their deals for periods of five years or more. This gives both parties, investors and sponsors, a vested interest in the performance of the underlying mortgage assets. It is yet another fundamental support beam built into the mortgage market structure today compared to the pre-GFC structure.
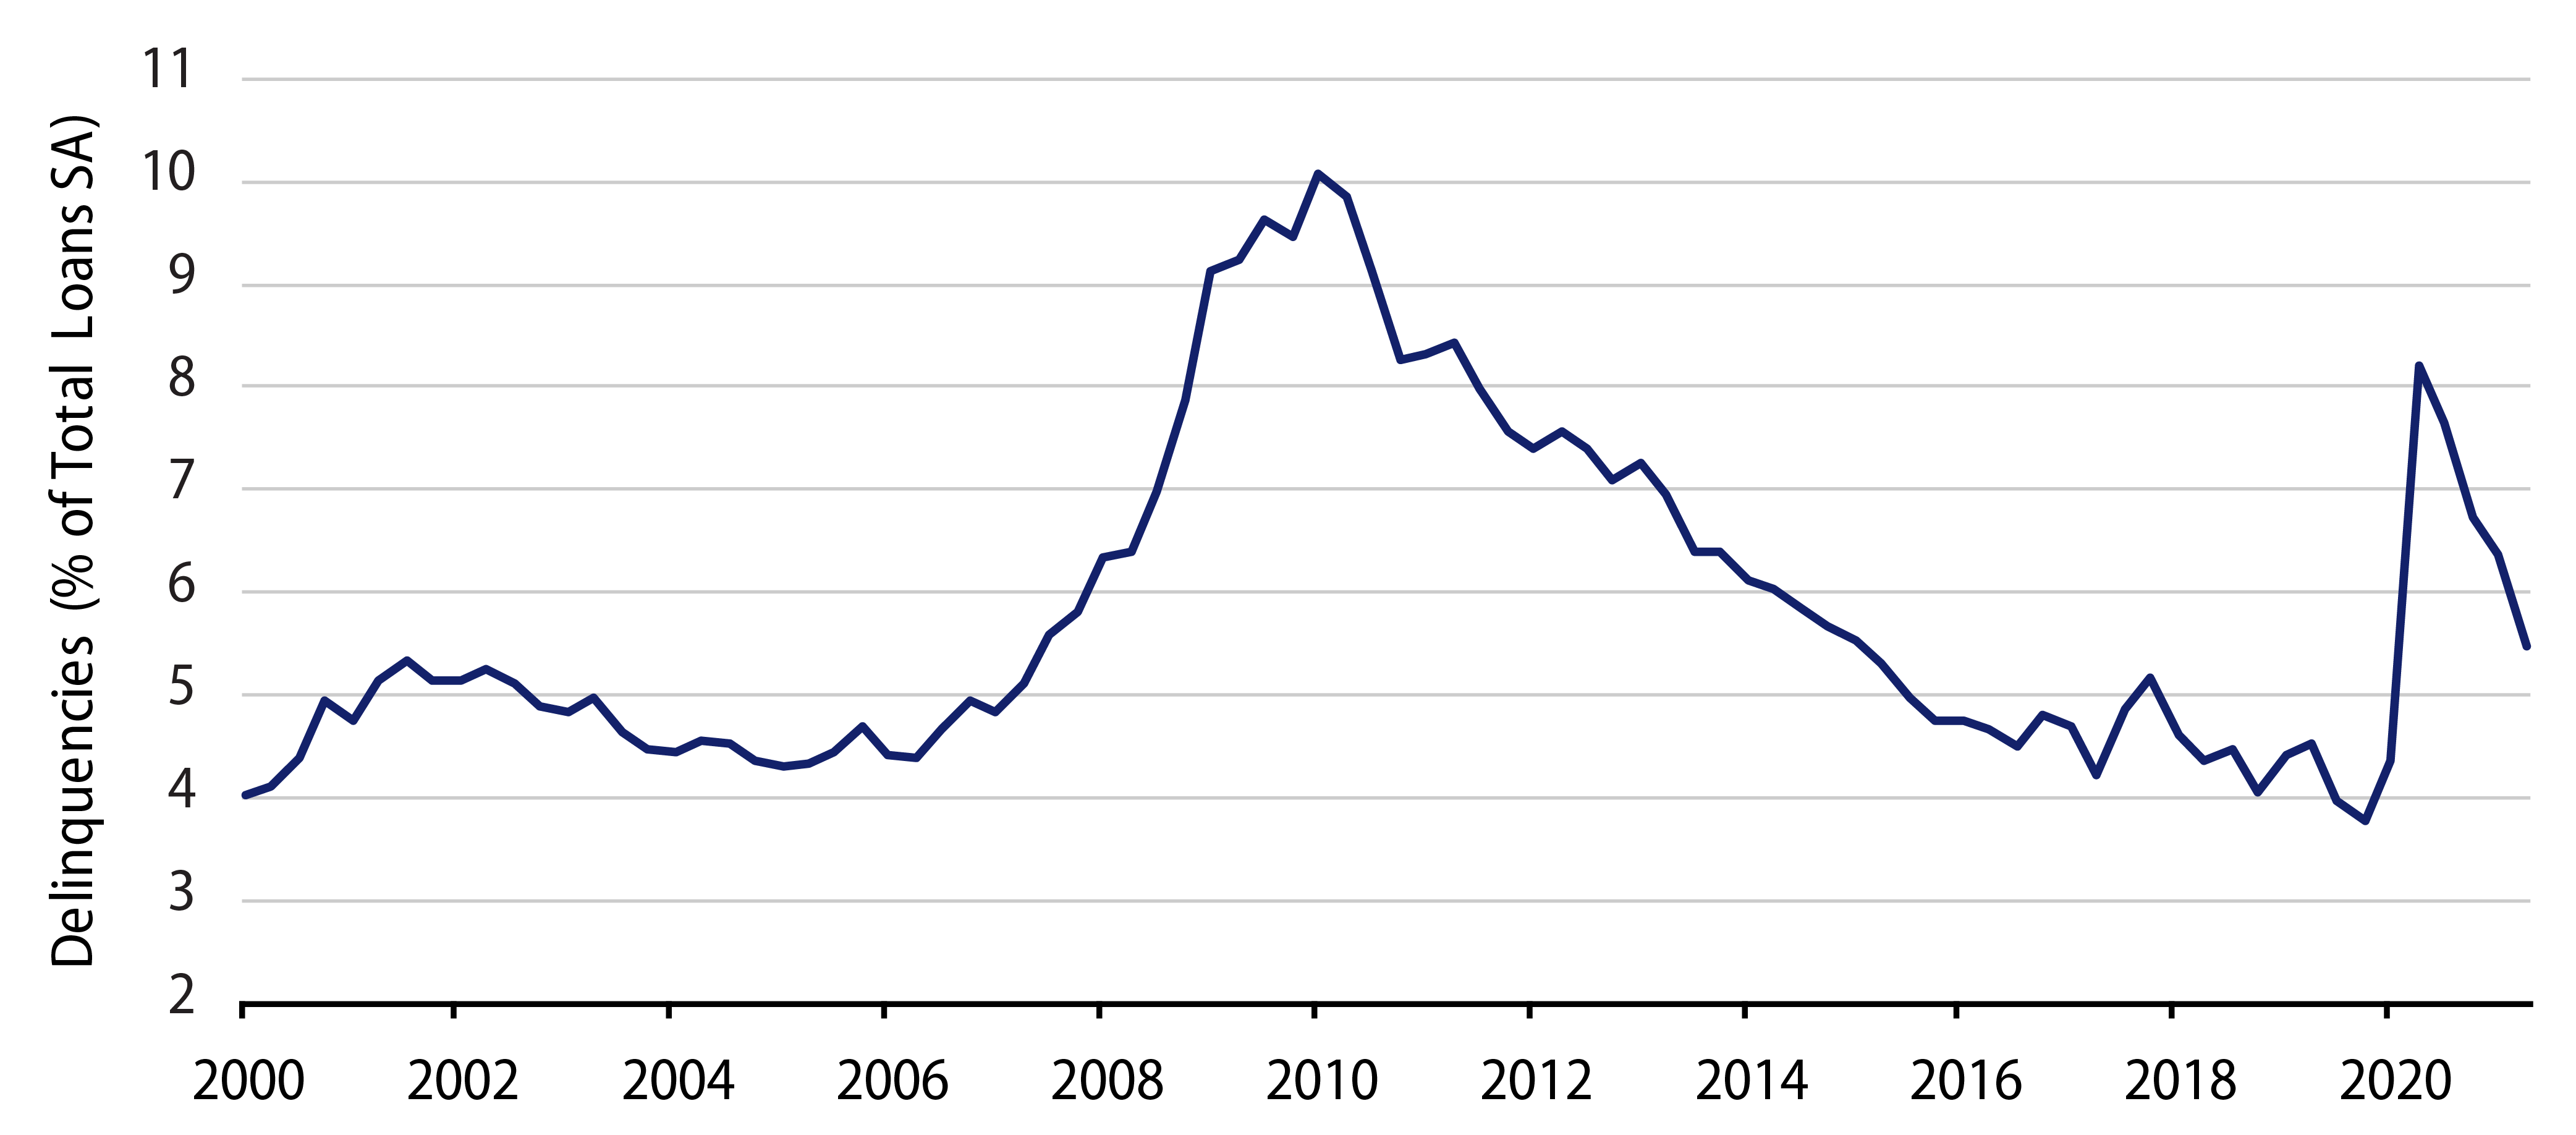
Additional differences between today’s housing market and the housing market during the GFC involve the support provided to consumers throughout the recent economic downturn. At the end of 2019, US mortgage delinquency rates were 3.7% nationally, the lowest levels since the 1990s. As Covid-related shutdowns took hold during the second quarter of 2020, delinquency rates topped out at 8.2%. While borrowers’ ability to stay current on their mortgage payments was initially in doubt, government agencies were quick to assist and quell investor concerns. Both the FHFA and Consumer Financial Protection Bureau (CFPB) put in place deferral and forbearance plans that gave borrowers and renters substantial grace periods on their payments. In addition, foreclosure and eviction moratoriums were enacted by the Centers for Disease Control and Prevention (CDC) to limit the spread of the infectious disease by displaced people. Upon exiting assistance programs, borrowers continue to have various options; they can cure missed payments, undergo loan modifications or take advantage of built-up equity and sell their properties. While a number of the assistance plans are set to expire by the end of 2021, declining delinquency rates and strong recovery rates have helped drive the performance of the mortgage market. Without a doubt lessons from the GFC and the rapid response from government agencies have helped strengthen the mortgage landscape of today.
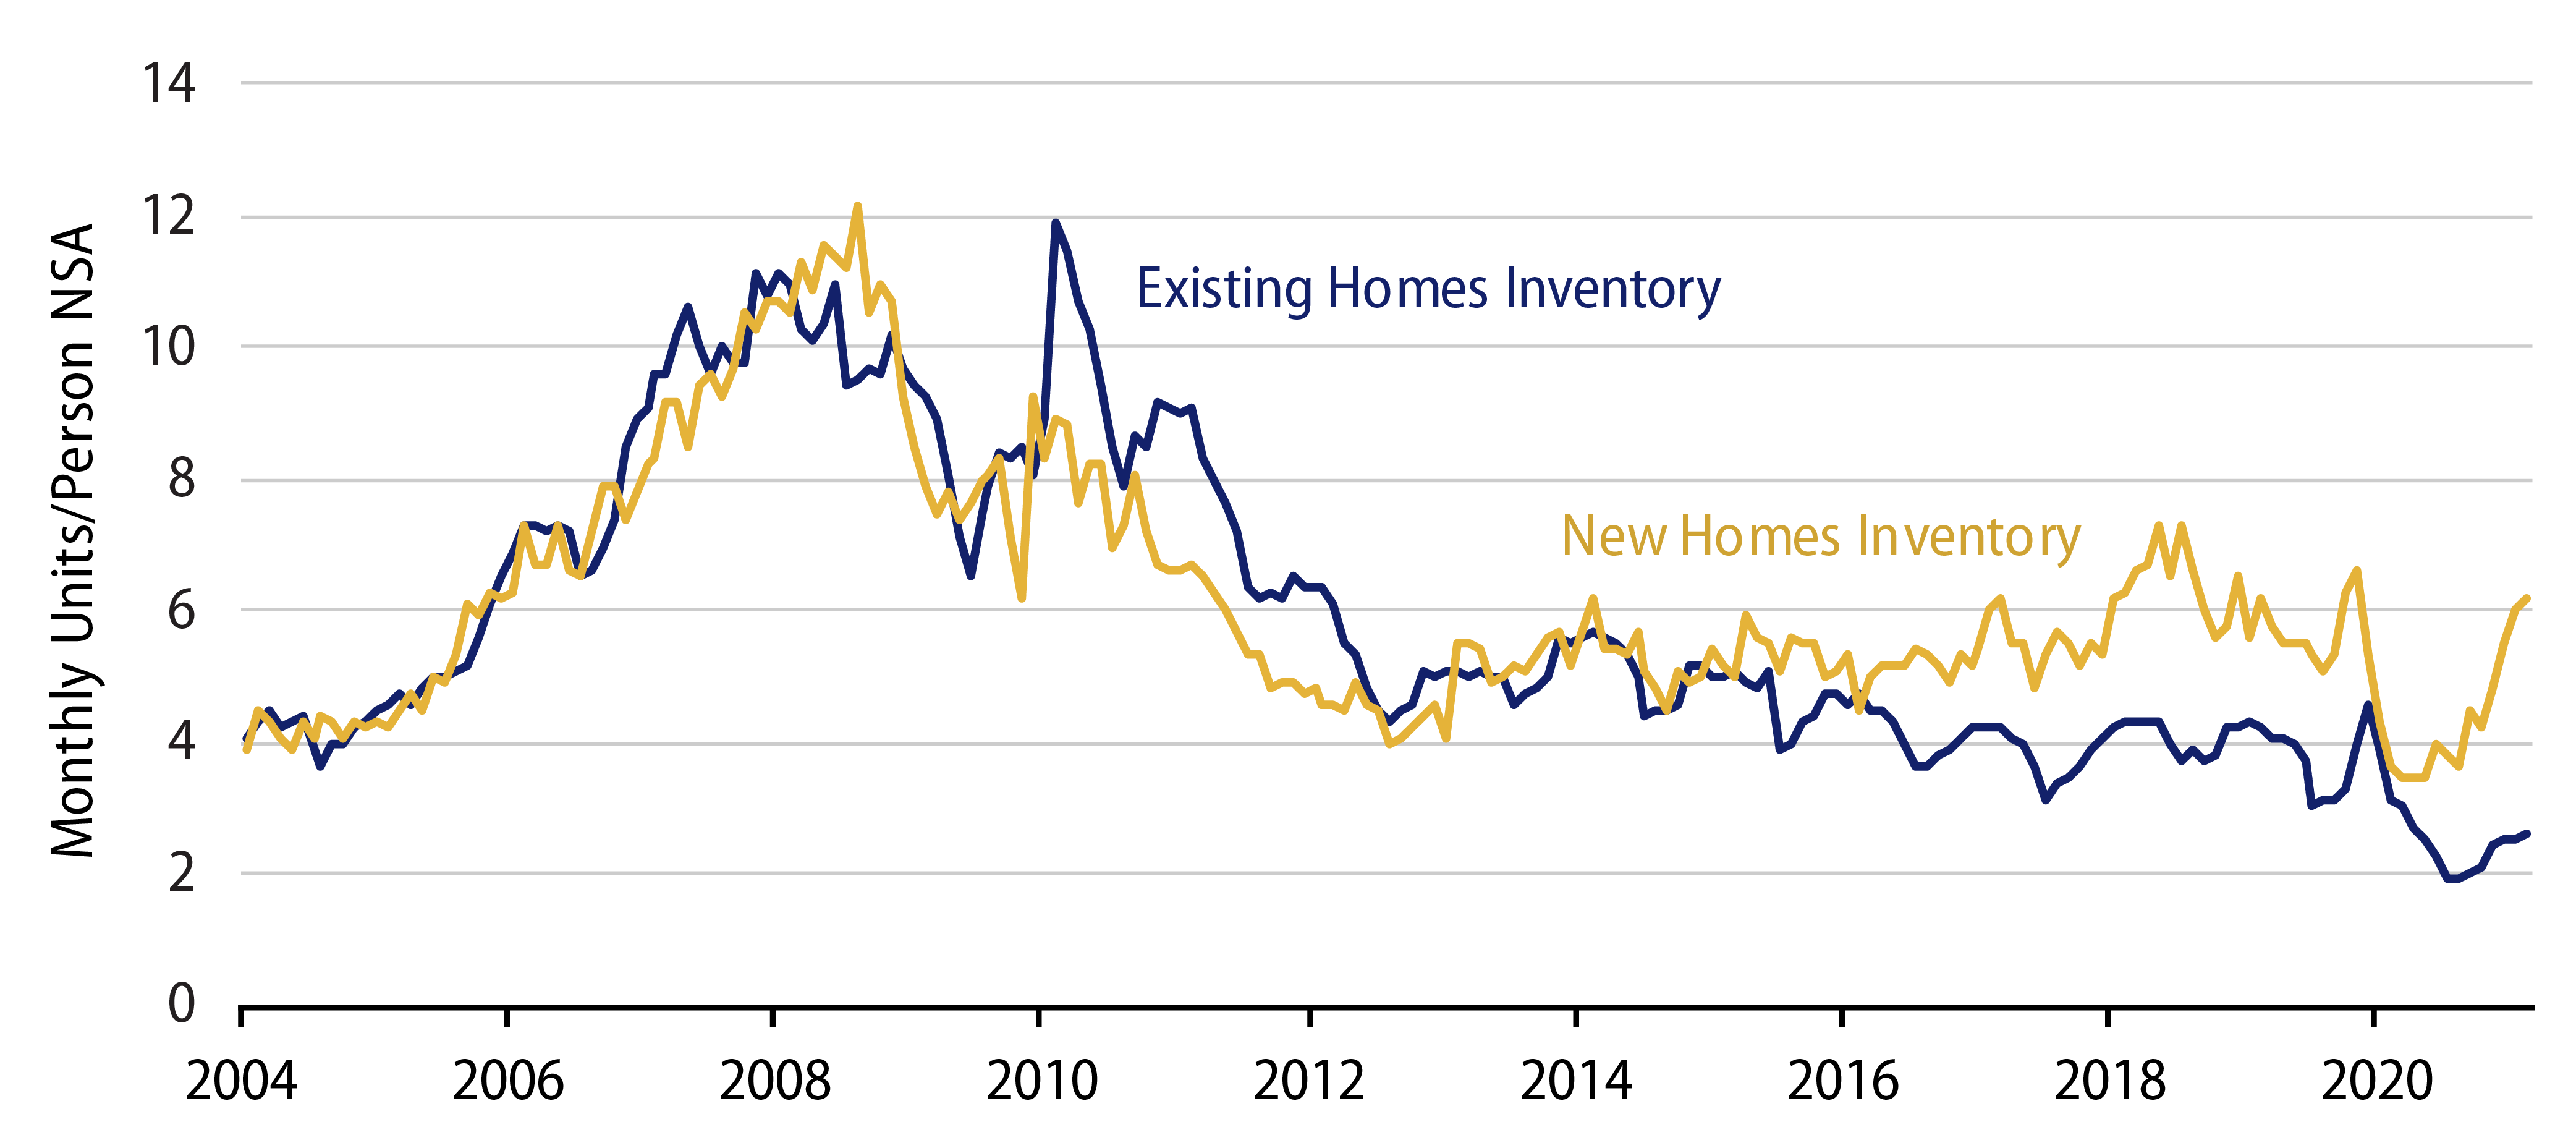
In addition to prices, the level of housing inventory in the mortgage market has begun to shift. Existing home inventory, which is measured by months of housing supply on the market, printed 2.6 months this past July, up 36% from 1.9 months at the start of the year. While a dramatic jump in percentage terms, 2.6 months of existing housing inventory is historically a very low number. In the period leading up to the GFC, existing months of supply averaged 4.5 months and peaked around 12 months in mid-2010. One area of housing inventory worth monitoring is new-home inventory. Leading up to the GFC, the months of new-home inventory on the market averaged four, inventory levels peaked at 12 months by the end of 2008; today the figure is 6.2 months. There are various reasons for the rise. Homebuilders today are dealing with a great number of external forces on the supply side. Supply-chain backlogs, timeline disruptions and building materials price increases along with various other Covid-related disturbances have influenced the new-homebuilding/selling process. Housing starts are showing signs of the impacts as well. In July, overall housing starts dropped 7%, with single-family units down 4.5%. A difference between the early 2000s housing crisis and today is that now the level of total housing starts is well below the peak seen during 2005—1.5 million today versus 2.2 million in February 2005. All of these factors will put short-term pressure on home prices and building levels. However, while fluctuating levels of building and inventory will continue to take place, consumer health and demand for housing is robust.
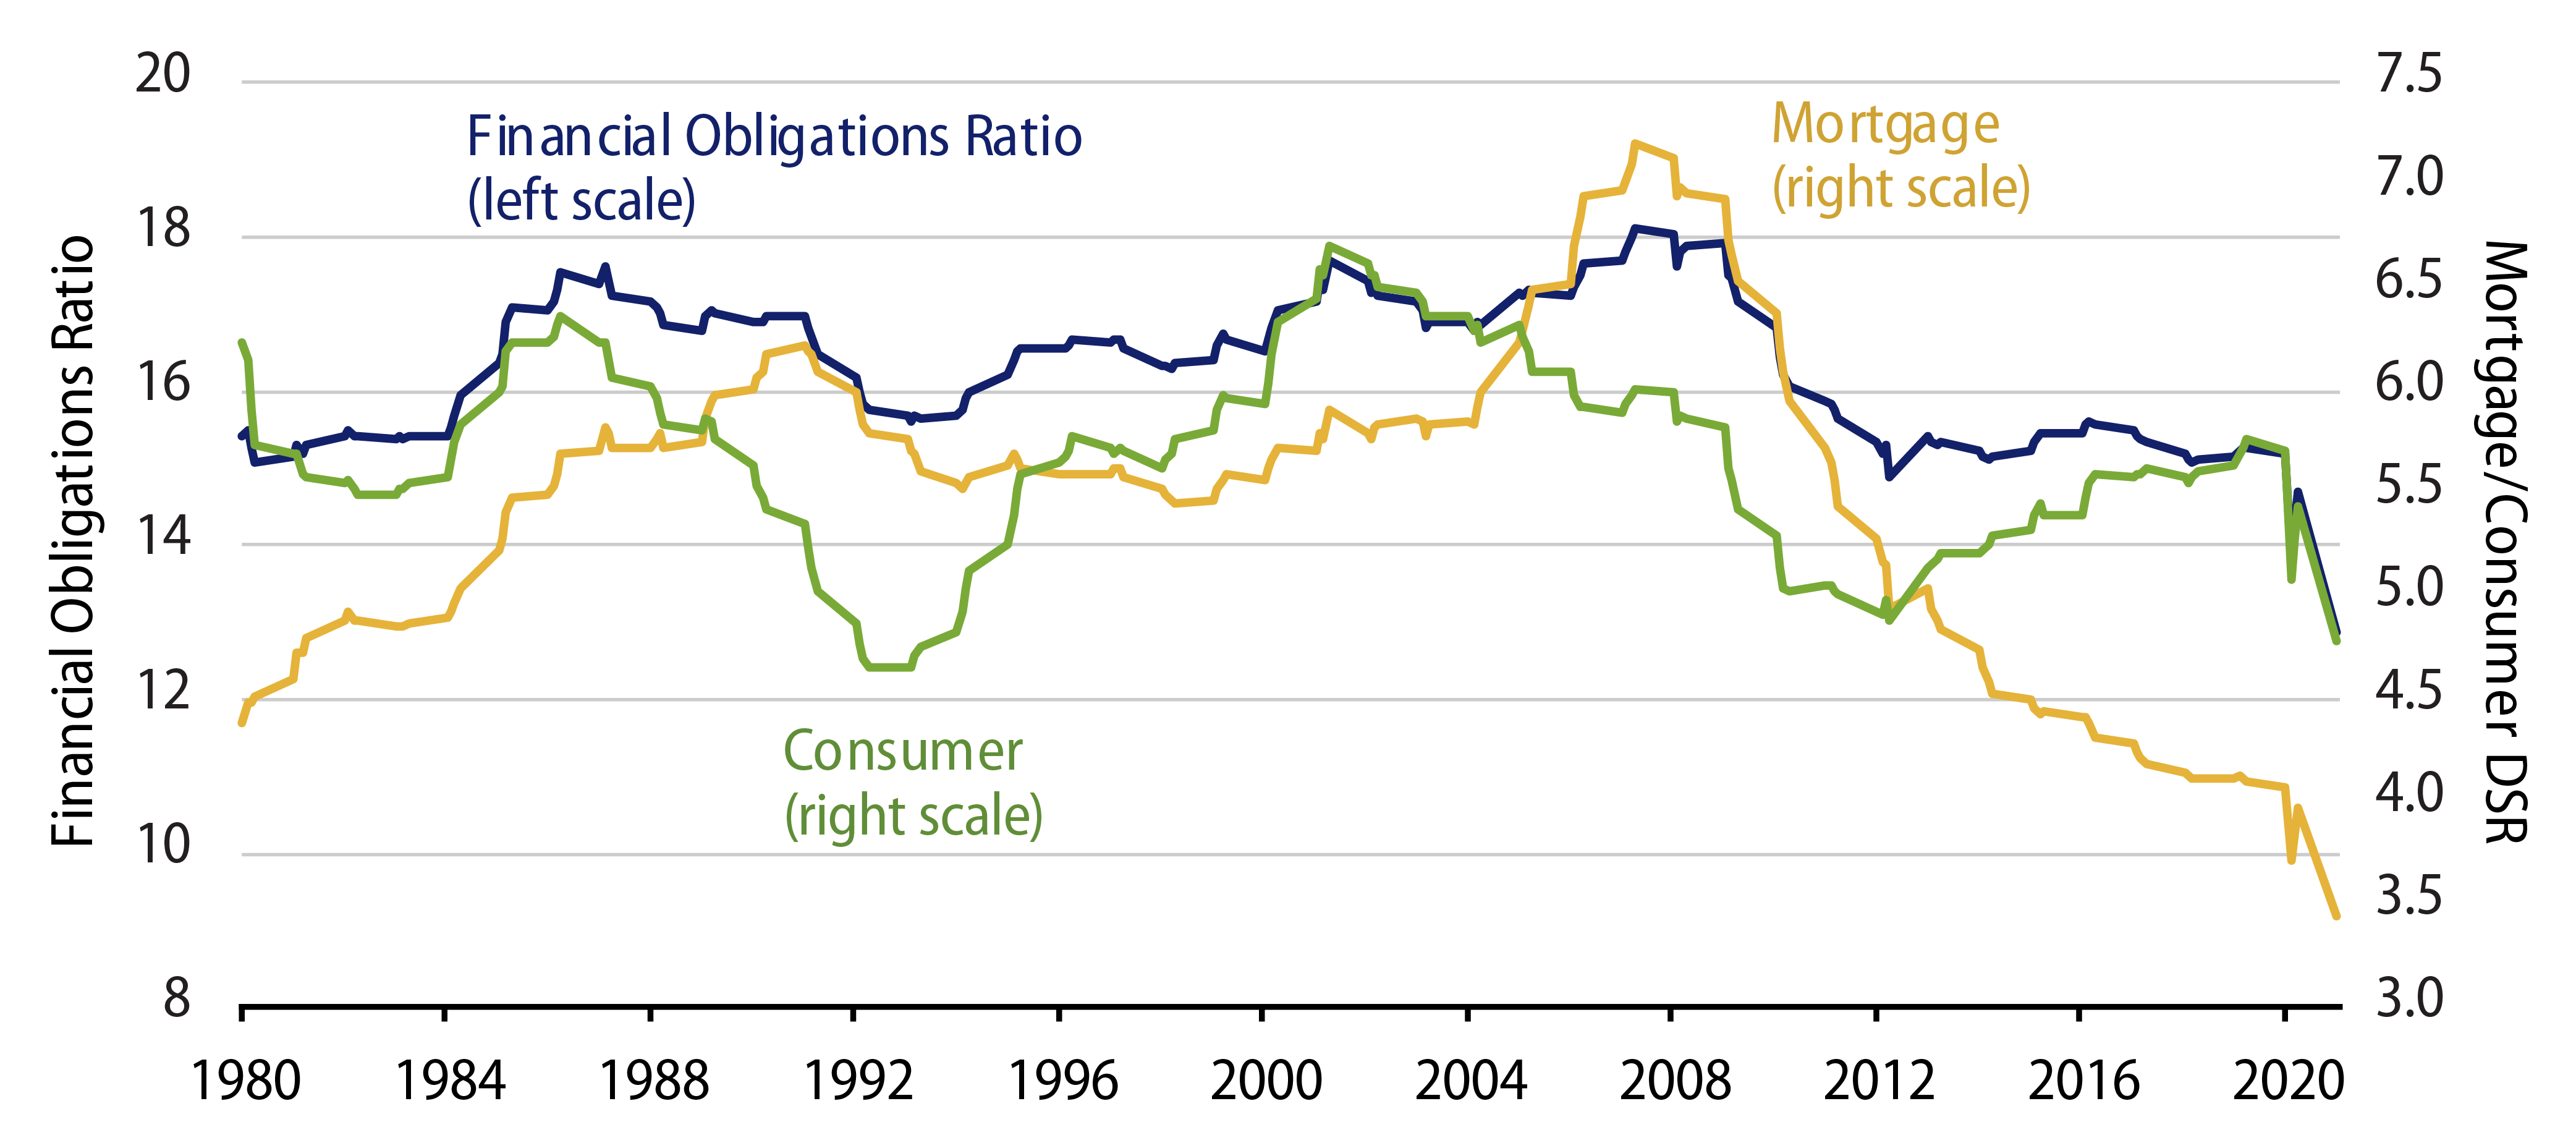
An additional contributor to mortgage fundamentals is consumer health and the levels of debt managed by consumers. As reported by the New York Fed, total consumer debt outstanding is roughly $15 trillion; mortgage debt is $10 trillion of that while auto, credit card, student loan and a few others comprise the remainder. Total debt, as well as mortgage debt, has been steadily rising since 2013. Between 2007 and 2008 mortgage debt was 73% of total outstanding debt; today it is 70%. During that same period, student loan debt went from 4% of total outstanding debt to now being 10% of outstanding debt—a more dramatic change. While outstanding debt is on the rise, the ratio of disposable income required to service that debt is falling. Due to low interest rates, the current mortgage debt service ratio (total quarterly required mortgage payments divided by total quarterly disposable personal income) is hovering around the lowest levels seen in 40 years. Broadly speaking, financial obligation ratios are at some of the lowest levels seen since the 1980s; however, a rapid rise in interest rates could move these ratios closer to historical averages and are worth keeping a close eye on as the mortgage market shows signs of cooling.
It’s hard to envision a scenario where home prices can continue such rapid growth; however, a rapid decline of the market is equally hard to imagine. The lessons learned from the 2008 housing crisis have helped create fundamental strengths that propelled the mortgage market to where it is today. Lender underwriting guidelines enforced with strict qualification criteria and financial verifications backed by robust property valuations have created strong mortgage products. Banking and securitization regulations have helped to put the onus on sponsors to create soundly structured investments. The rapid and thoughtful response from government agencies to assist borrowers during unprecedented economic hardships have enforced support for consumers. The demand for housing in the US continues to be strong and consumers are not overly burdened by debt. While a cooling cycle does appear to be starting, we believe the housing market is strong and will remain well supported.