

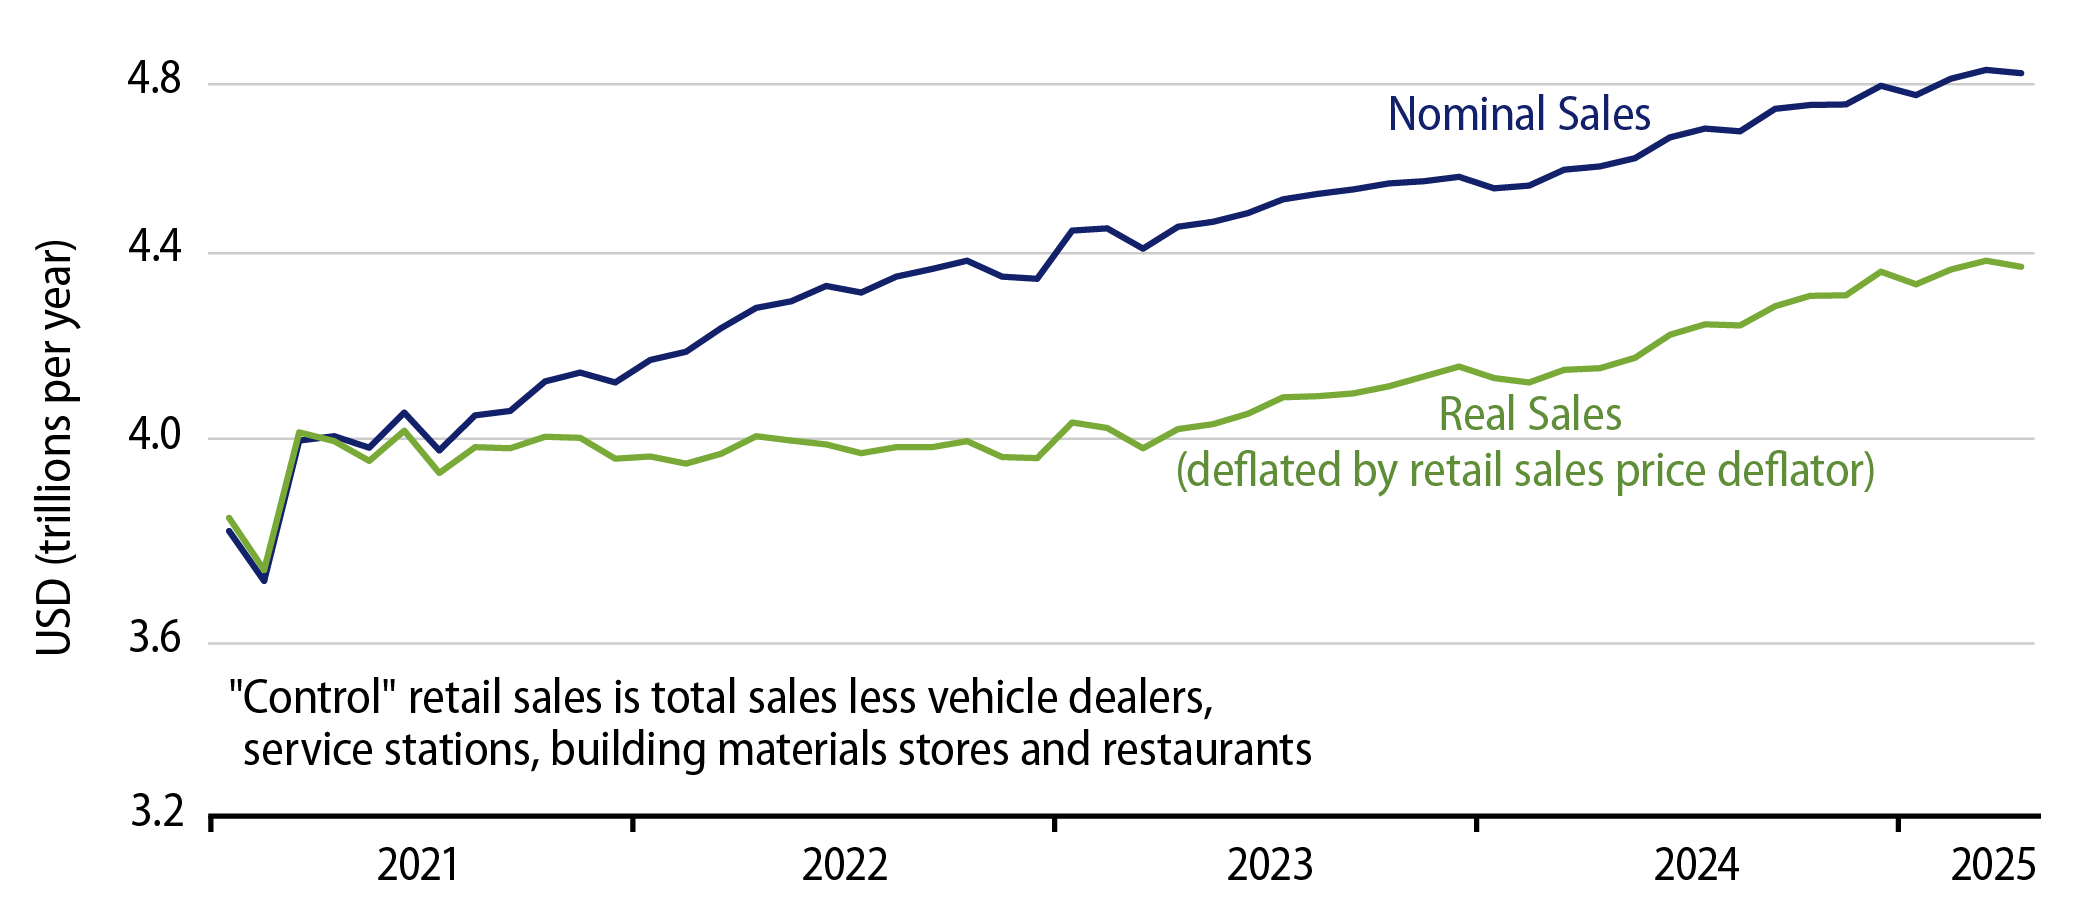
Headline retail sales rose a slight 0.1% in April, while the closely watched “control” sales measure dipped -0.2%. Control retail sales exclude sales at car dealers, building material stores, gas stations and restaurants so as to focus on store types dominated by household customers rather than commercial customers.
While the April results were softer than those of preceding months, they do not at this time suggest a meaningful change in sales trends, given the usual amount of monthly variation. As you can see in Exhibit 1, in both real and nominal terms, control sales through April were generally in line with recent trends.
Among store types, sales were down noticeably at “miscellaneous” retailers (-2.1%, mostly office supply and flower stores), department stores (-1.4%) and sporting goods/hobby stores (-2.5%). Even these declines were not out of the range of normal monthly fluctuations for these store types. Ditto for restaurant sales, which rose +1.2%, after having softened earlier in 2025. There were more modest sales gains at furniture, electronics and building material stores and similarly modest declines at gas stations and clothing stores. Car dealer sales held essentially steady (down 0.1%), but after a strong March gain, so that April sales were way above 2024 sales levels.
Within today’s release, the Census Bureau also announced benchmark revisions for the retail data. The biggest change was in its methodology for handling “mom-and-pop stores”—that is, retailers with no non-owner employees. Previous data had “benchmark” estimates for such retailers, and the revised data now reflect much different estimates. Apparently, mom-and-pop stores did far less business than the Census previously thought, as headline retail sales were revised lower by almost 2% all the way back to 1992, and there were much larger downward revisions for store types such as hobby stores (book dealers?), miscellaneous and non-store vendors.
The relevant question is whether these revisions fundamentally change the current retail picture, and the answer is no, as you can glean from Exhibit 2. That chart shows control sales estimates before and after the revisions. To make the chart more visually informative, we have “bumped” the old data down. That is, as of January 2023, the revised control sales data were 2.6% lower than previous estimates. So, we lowered the previous data by 2.6% across 2021-2025 to reflect recent sales trends.
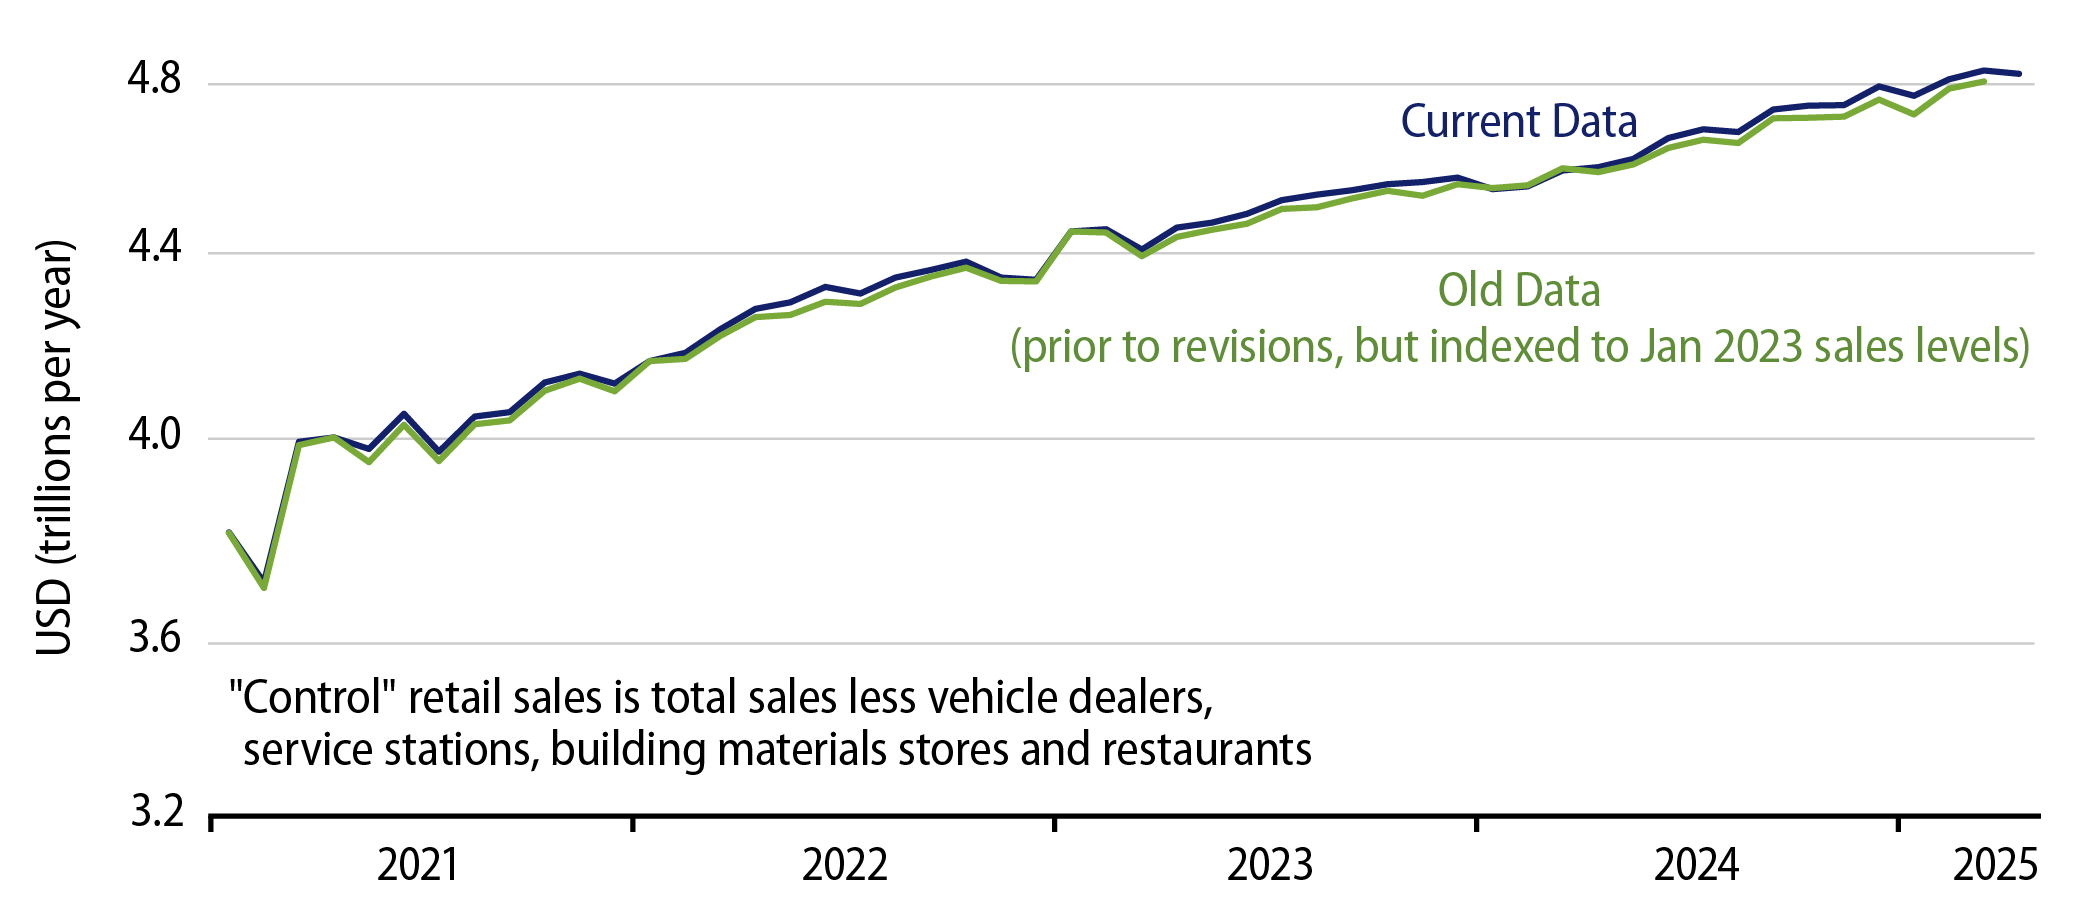
As you can see in Exhibit 2, both measures thus show the same January 2023 sales level. The new, revised data then show very slightly better sales growth through March 2025, before the aforementioned slight April drop. In other words, all the apparent sound and fury of big downward revisions is just a statistical redefinition. Recent data are essentially unaffected by the revisions. So, we stand by our earlier remark that sales held generally steady through April.