
This blog post features a series of charts with brief commentaries to describe each graphic; in total we think the charts present a comprehensive update regarding the economic progress North Asia is making on the road to a rebound after suffering the economic effects of the COVID-19 lockdowns/social distancing.
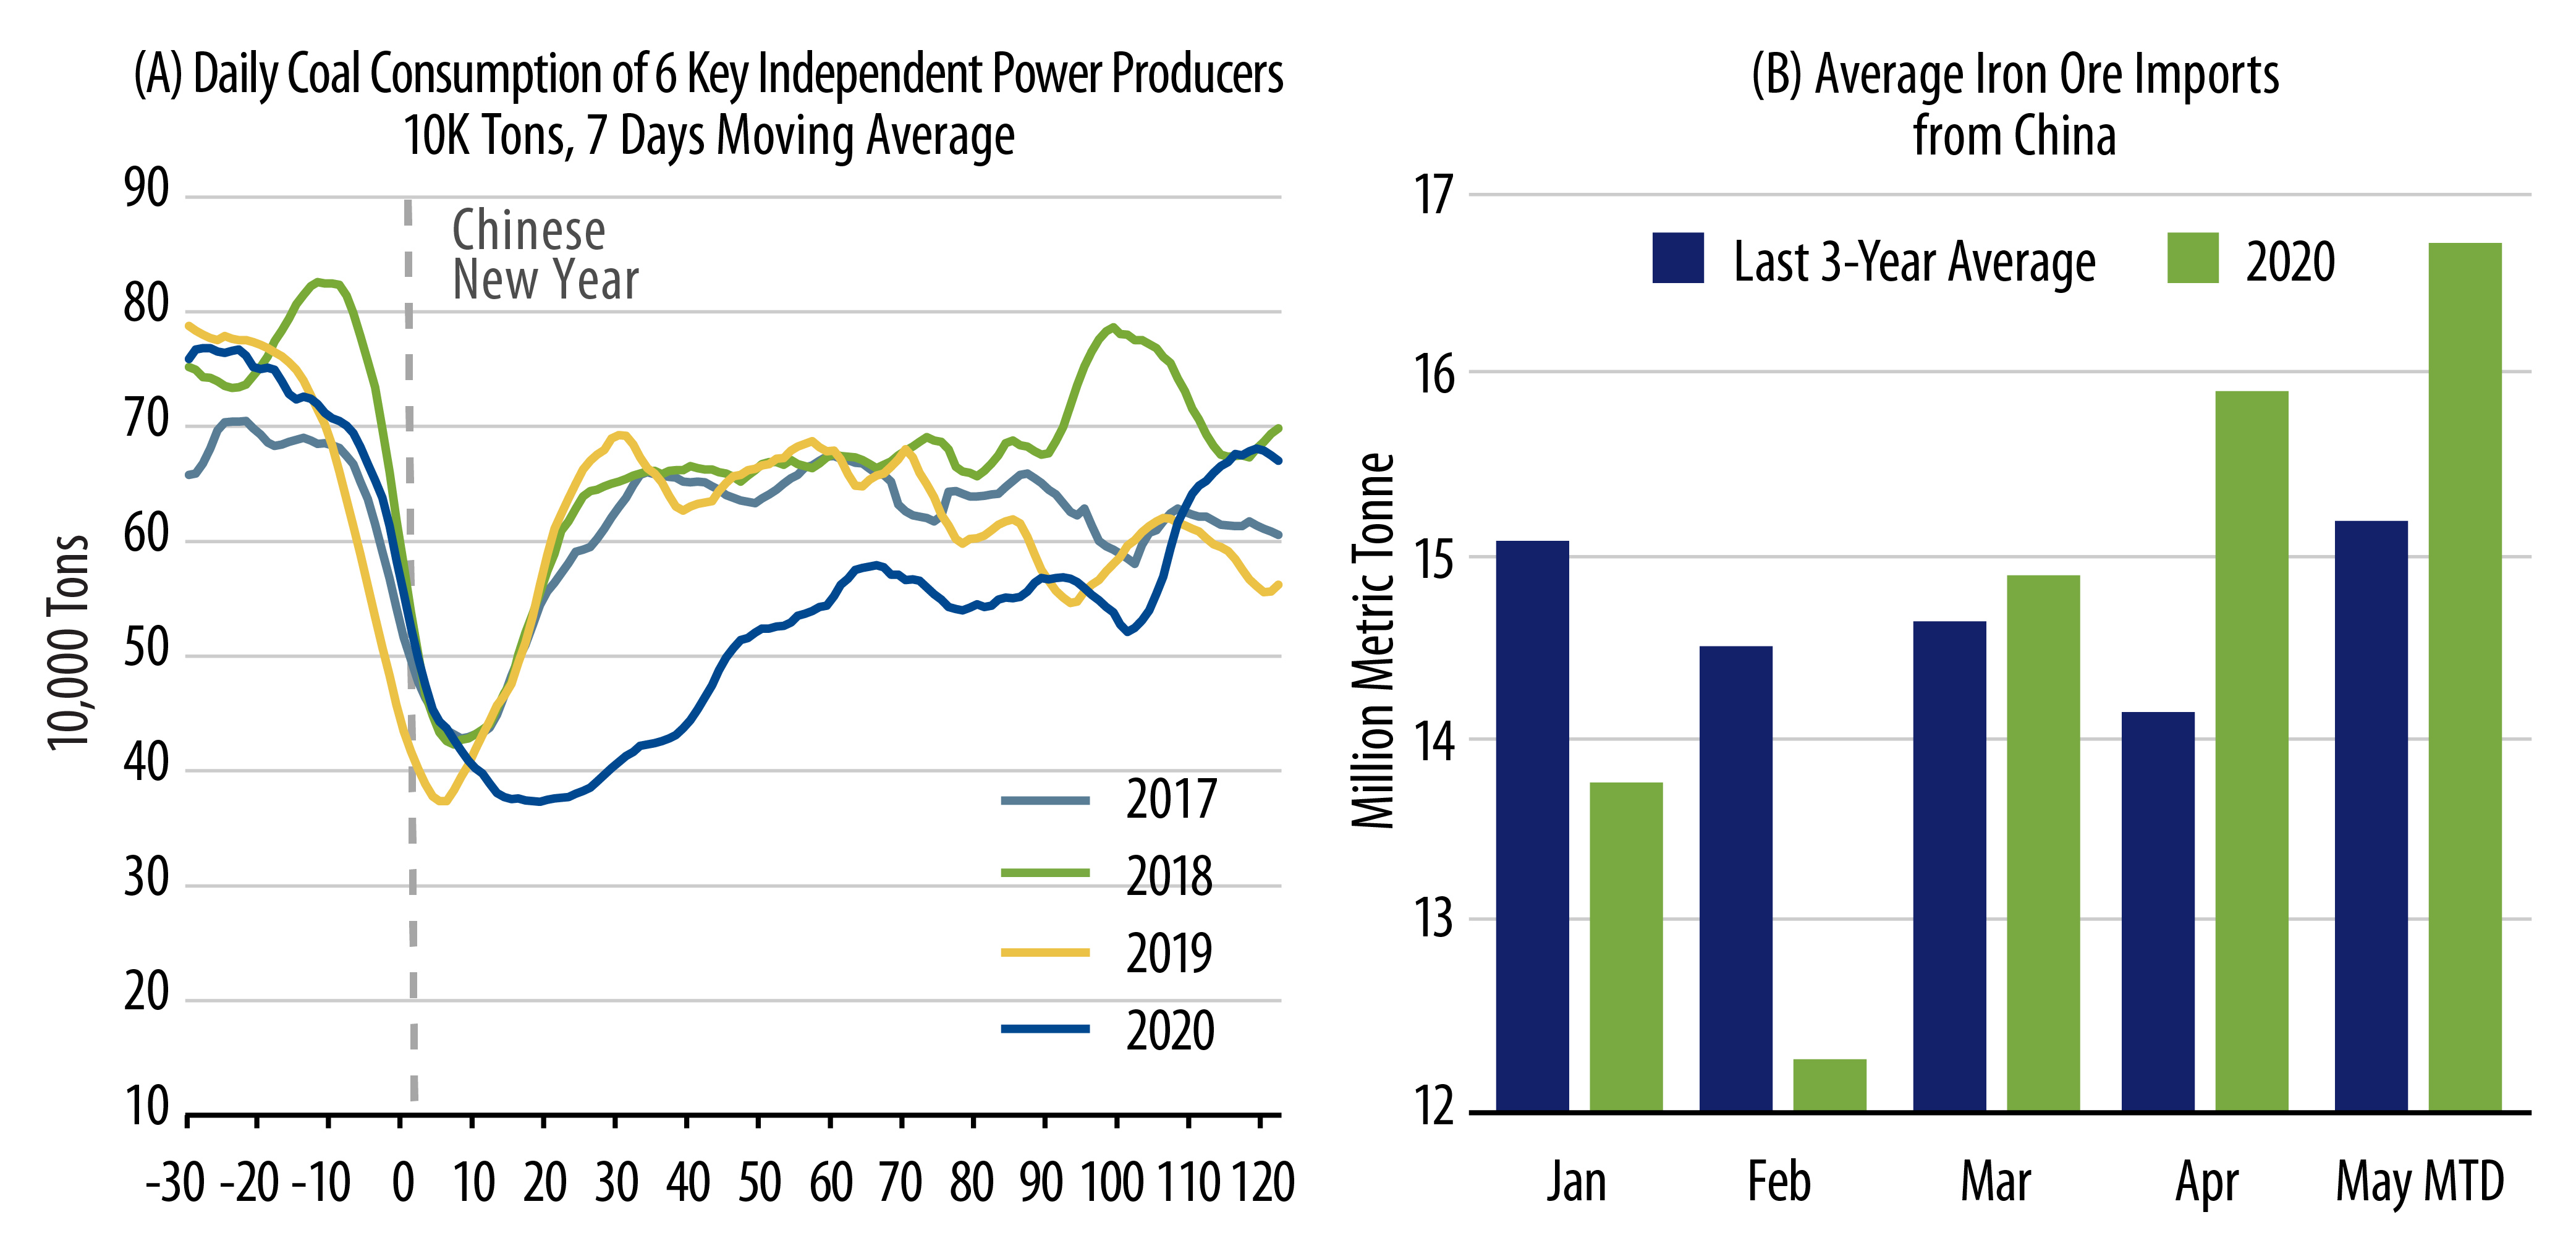
China Business Activity—Supply/Manufacturing
Recent data shows that China’s industrial activities have returned to 80%-100% of their level last year. Combining the coal consumption of the six key independent power producers (IPPs), their total coal consumption has returned to +5% year-over-year (YoY) growth in May, from -10% in April and -20% in March. Likewise, China’s iron ore imports have recovered to pre COVID-19 levels given the government’s focus on intra-structural projects in Central and Western China to cushion the economic shock of the pandemic. Over 90% of migrant workers have returned to their workplace, but there is significant under-employment (e.g., no overtime pay) and reduced labor participation (i.e., drop from formal sector to informal work).
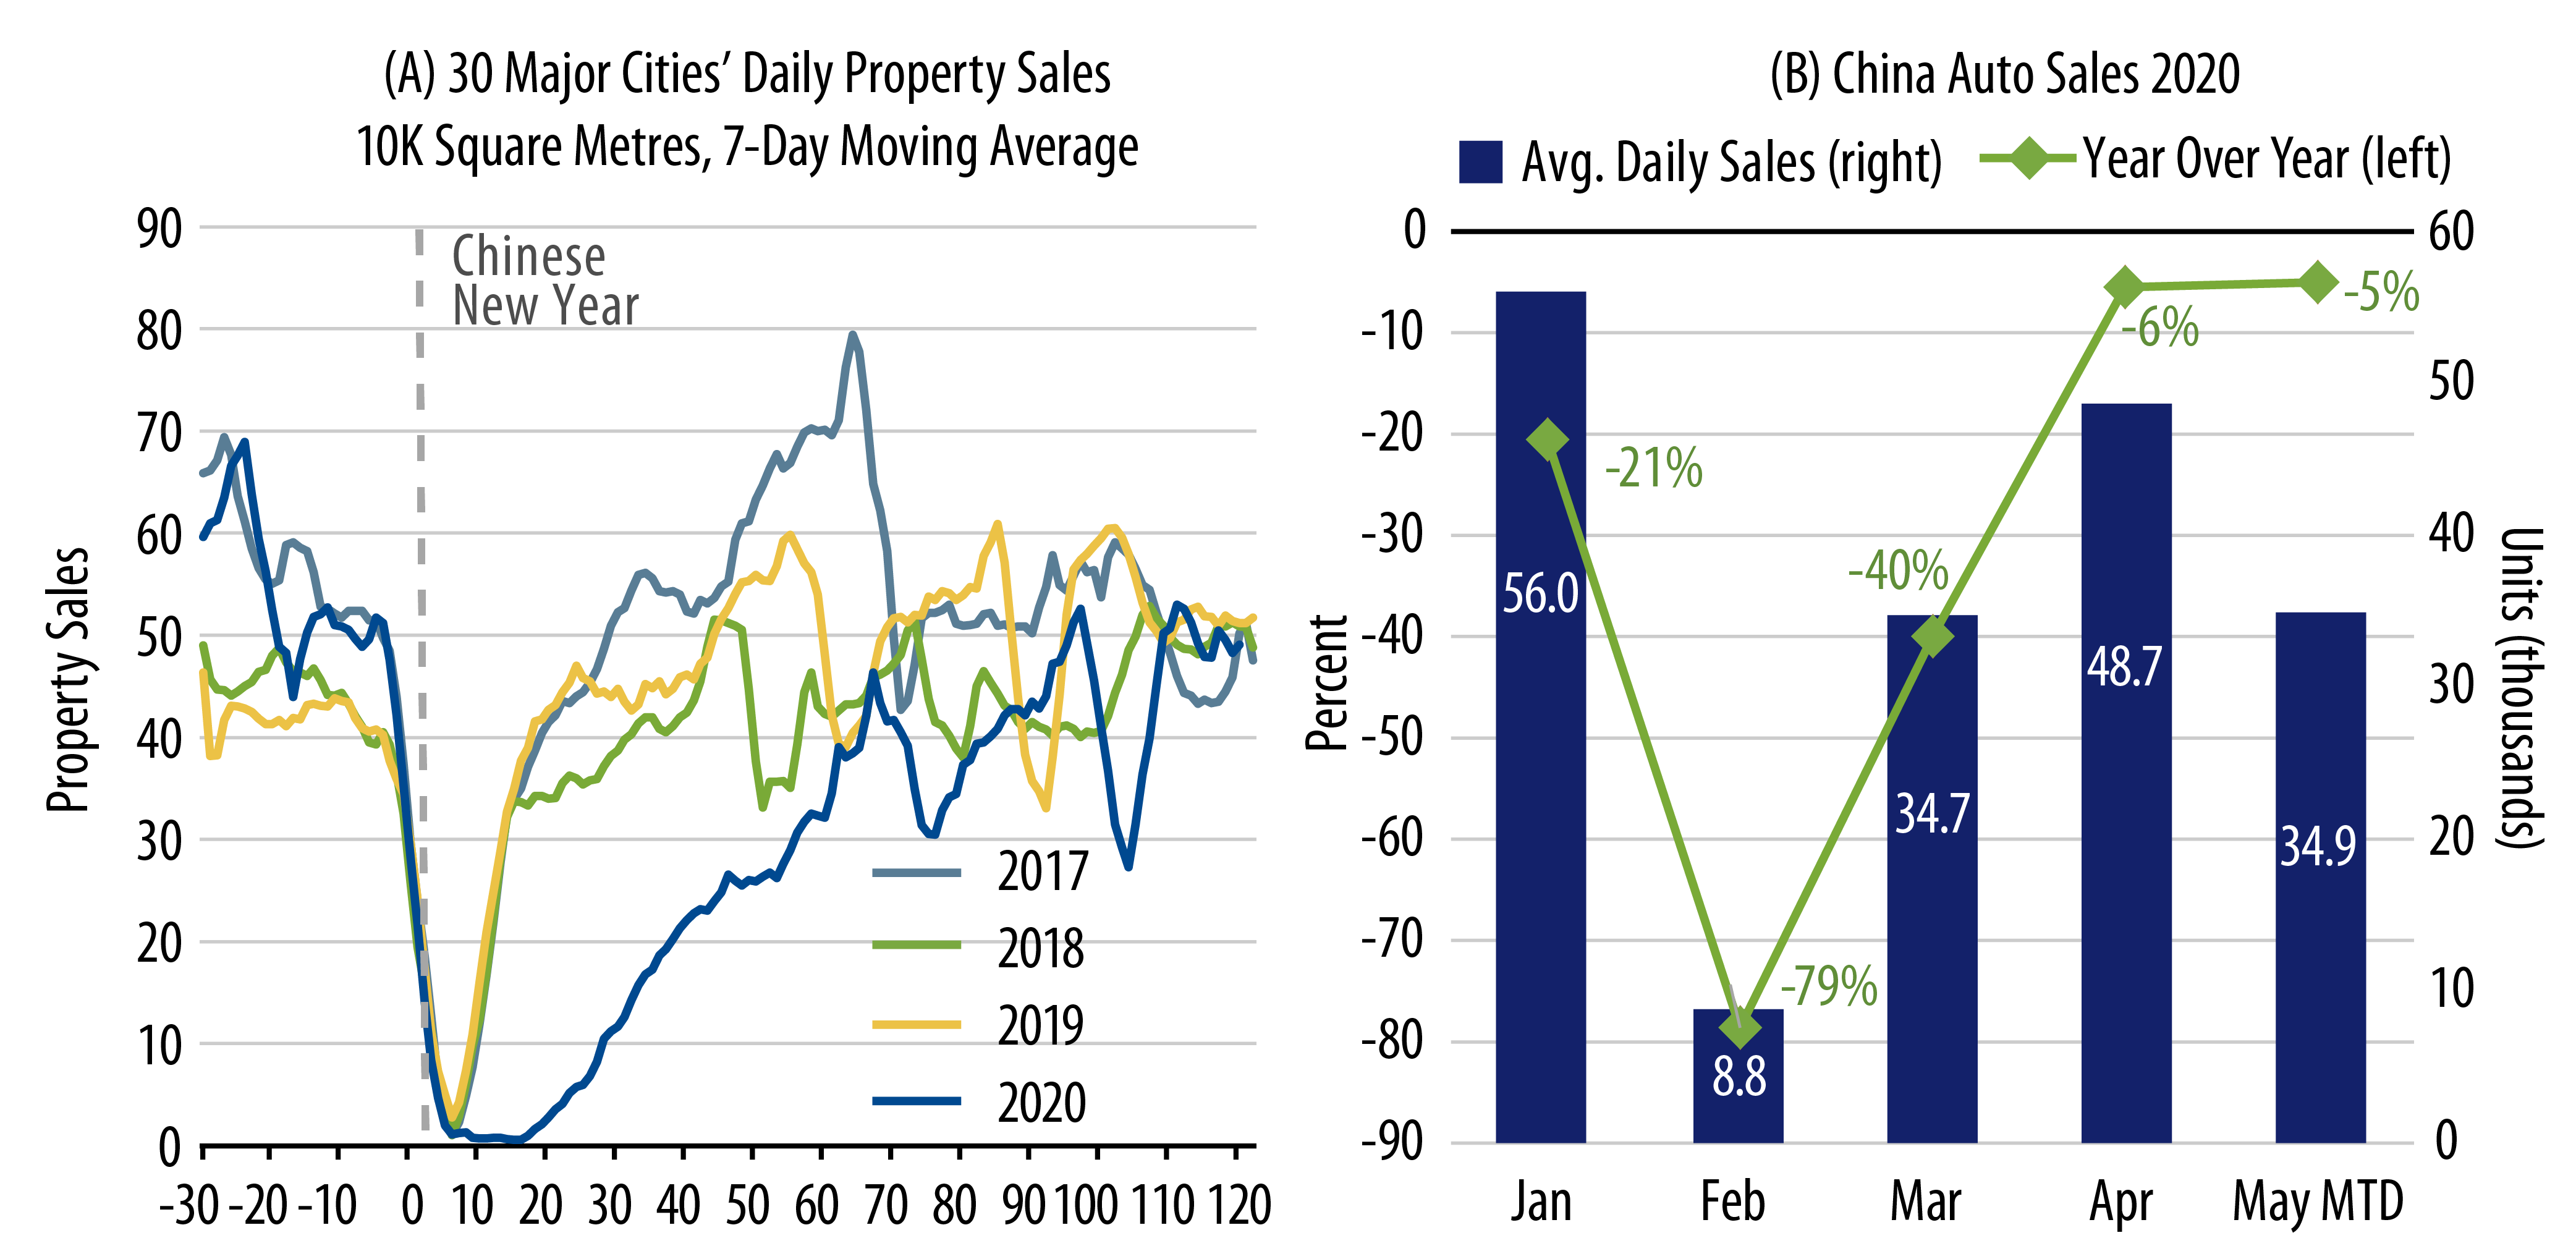
The China Business Activity—Investment
Property sales volume in 30 major cities recovered to 2019’s level in May, from -20% YoY in April and -37% YoY in March. Auto sales, a big ticket item, has recovered to -5% compared to the same time last year but some demand may be on the back of preference for private over public transport.
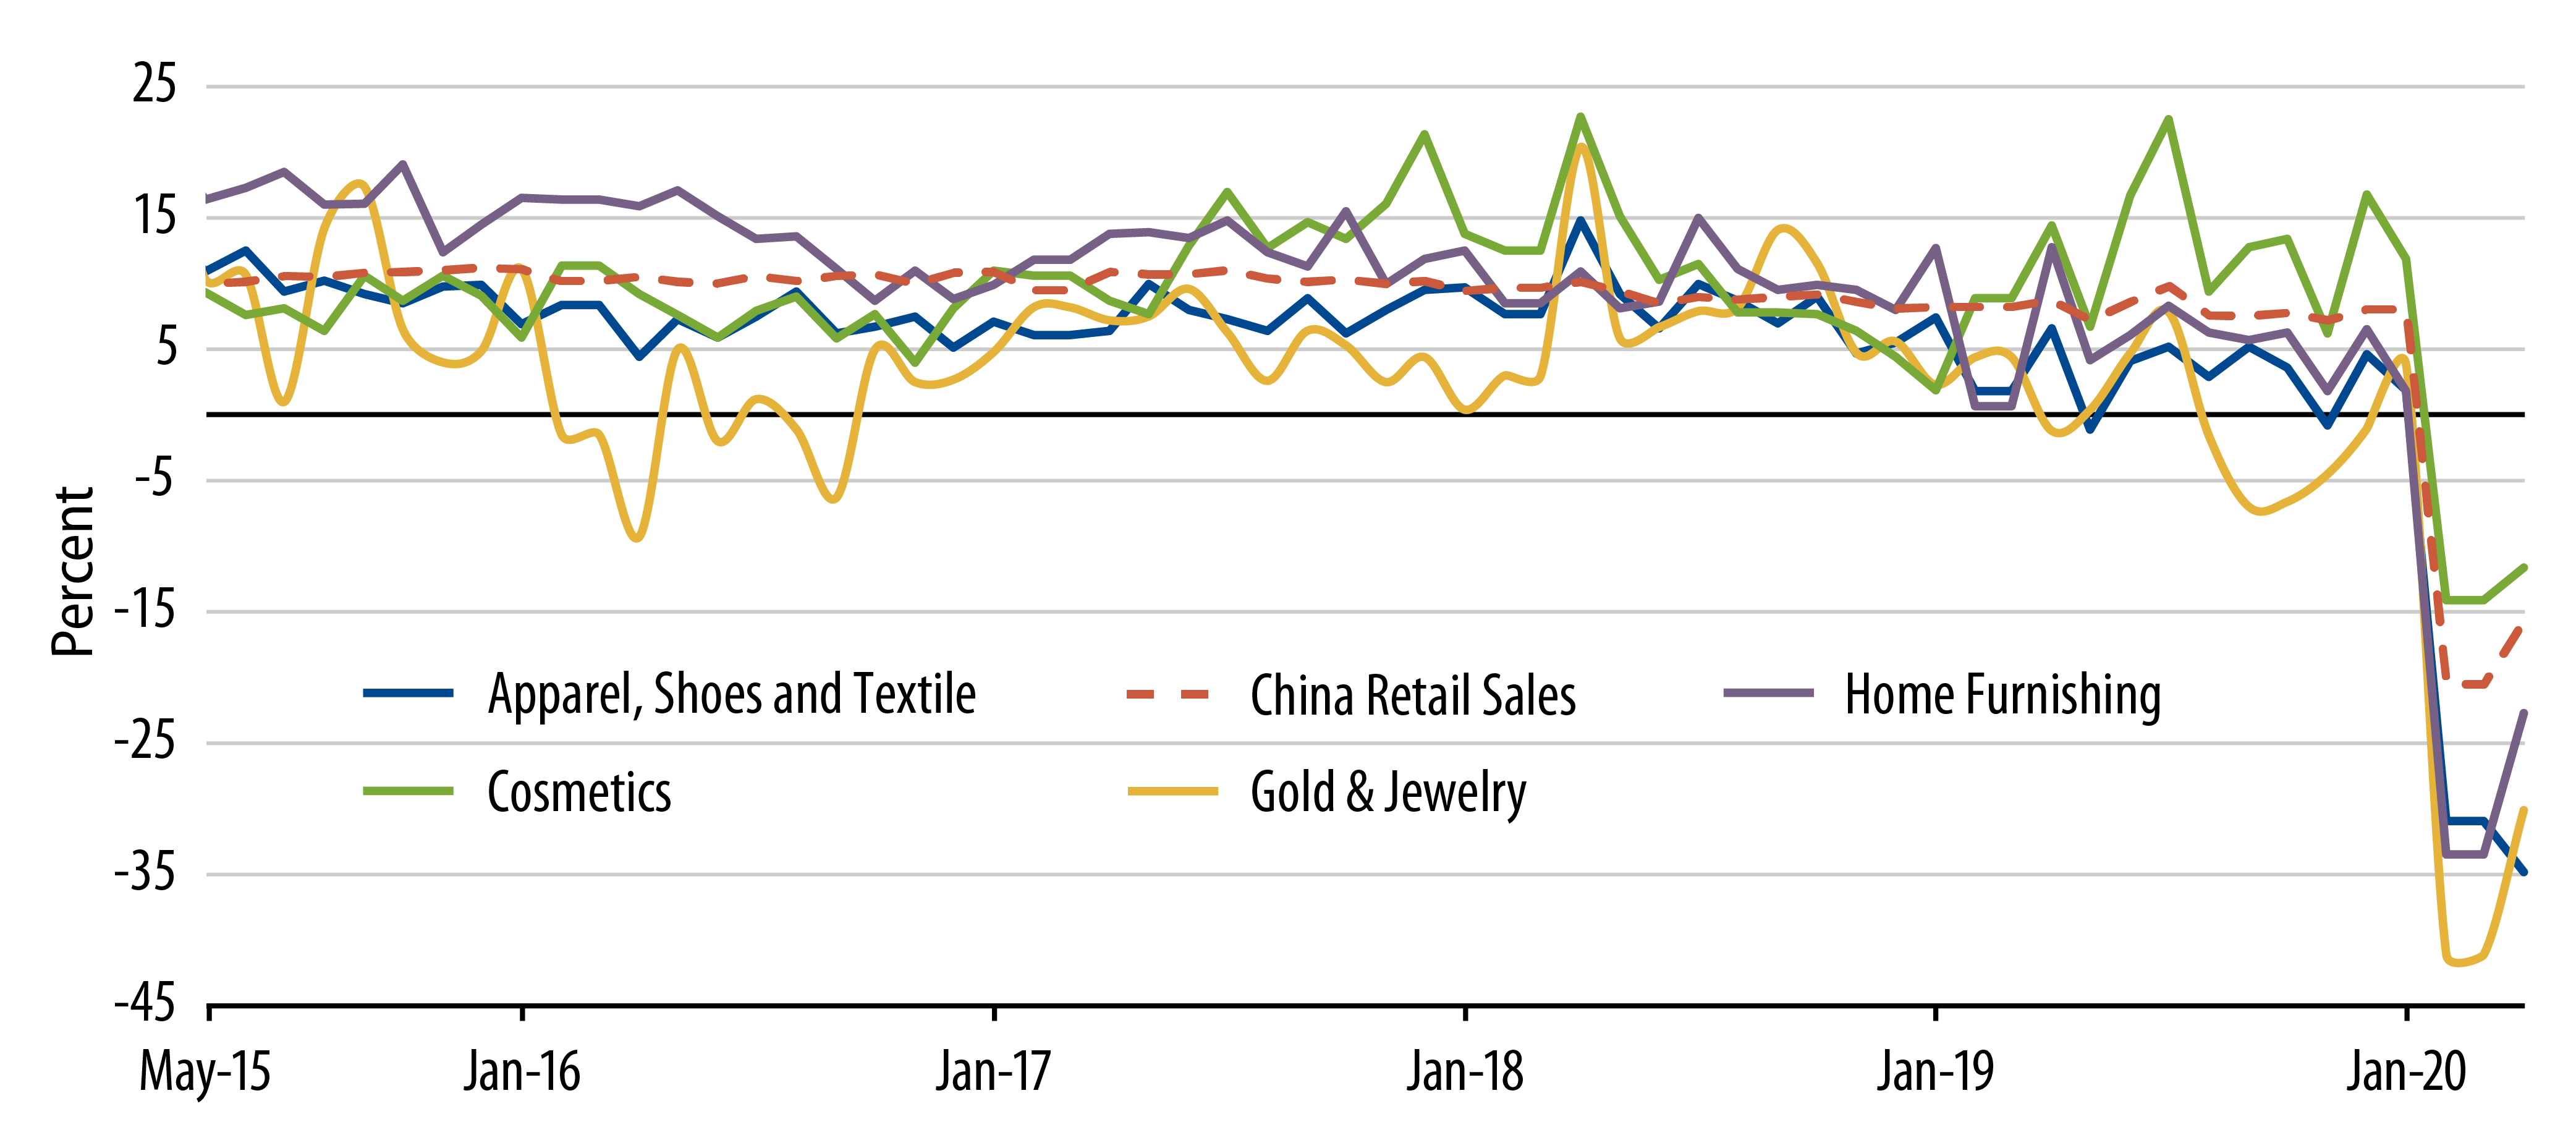
China Business Activity—Discretionary Spending
Consumption, discretionary retail sales and services are all taking longer to recover, as people continue avoiding non-essential gathering and travelling. The propensity to spend is also impacted by business and job market uncertainty. While 90% of restaurants have resumed operations, among these operating restaurants, their daily average bill counts were 30% below last year as of early May. People are holding back from discretionary spending, such as that on home furnishings, gold & jewelry and apparel, which have lagged China’s overall retail sales. These items are typically purchased offline in brick and mortar shops that have seen lower footfalls. This highly discretionary sector will take longer to recover.
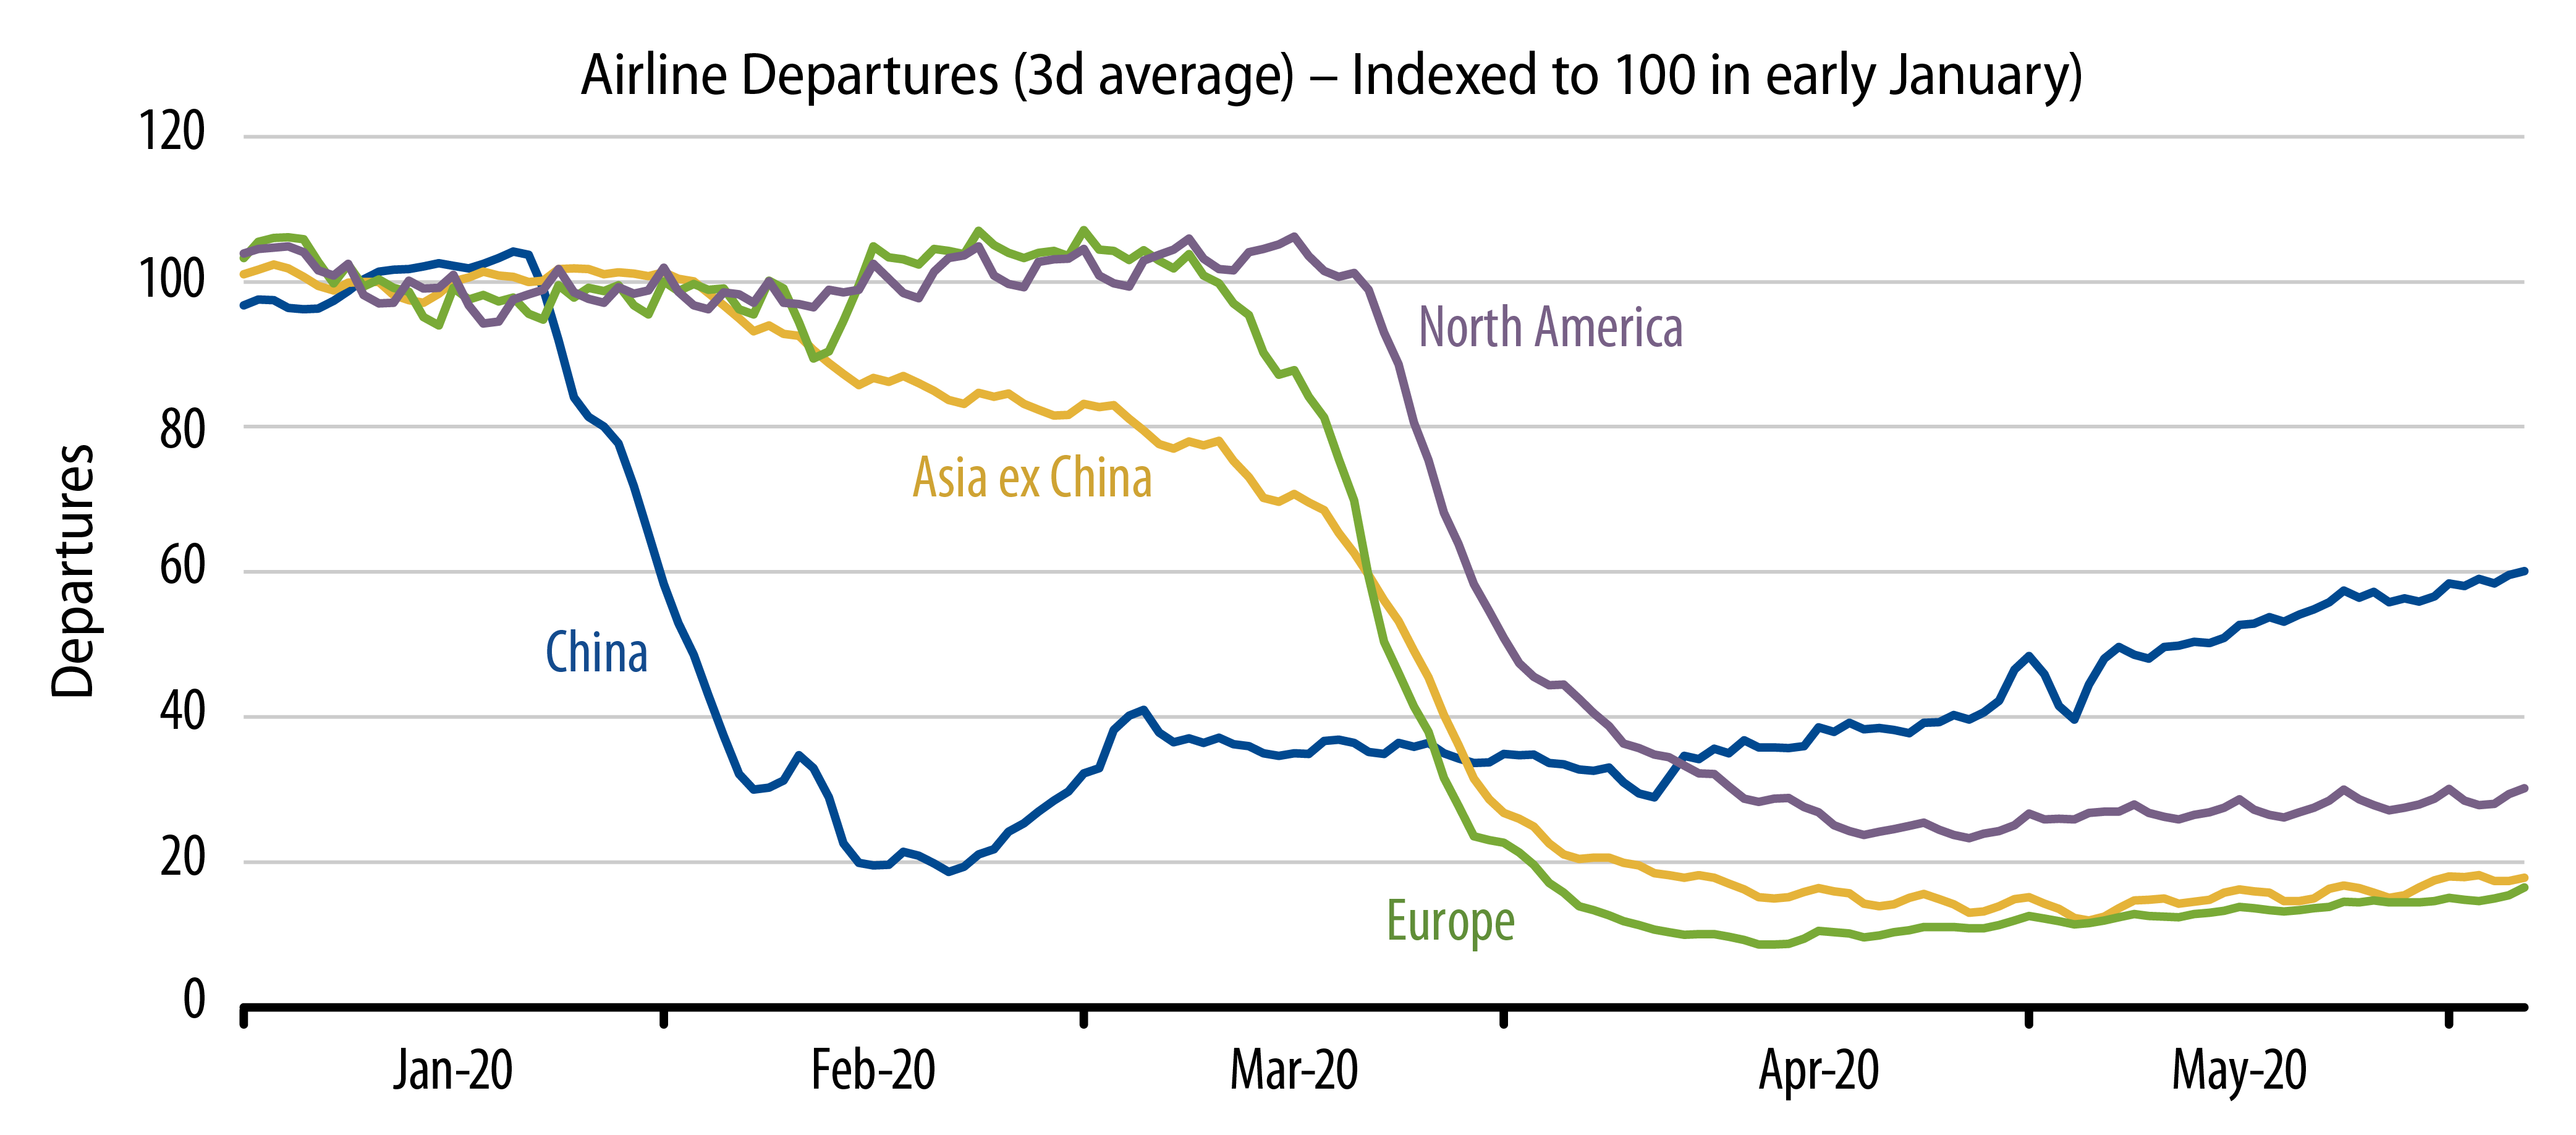
China Business Activity—Travel
Metro passenger trips in big cities remained down 50% YoY in early May, due to avoidance of public transportation until more confidence is gained on virus control and fear of a second wave of infection. As a consequence, there is greater traffic congestion in major Chinese cities as people avoid public transport and use private vehicles. Domestic air travel has recovered to -25% of last year’s level. Local tourists are spending less and international travel remains highly depressed due to stringent travel restrictions.
South Korea Activity
Traffic volume levels recovered in recent weeks after bottoming in early March, reaching 95% of the 2017-2019 average by early April. This strong recovery is skewed by the reduced use of public transport. Retail sales plunged in February but the actual fall was more benign as boosts in online activities provided a buffer to drags in offline store sales.

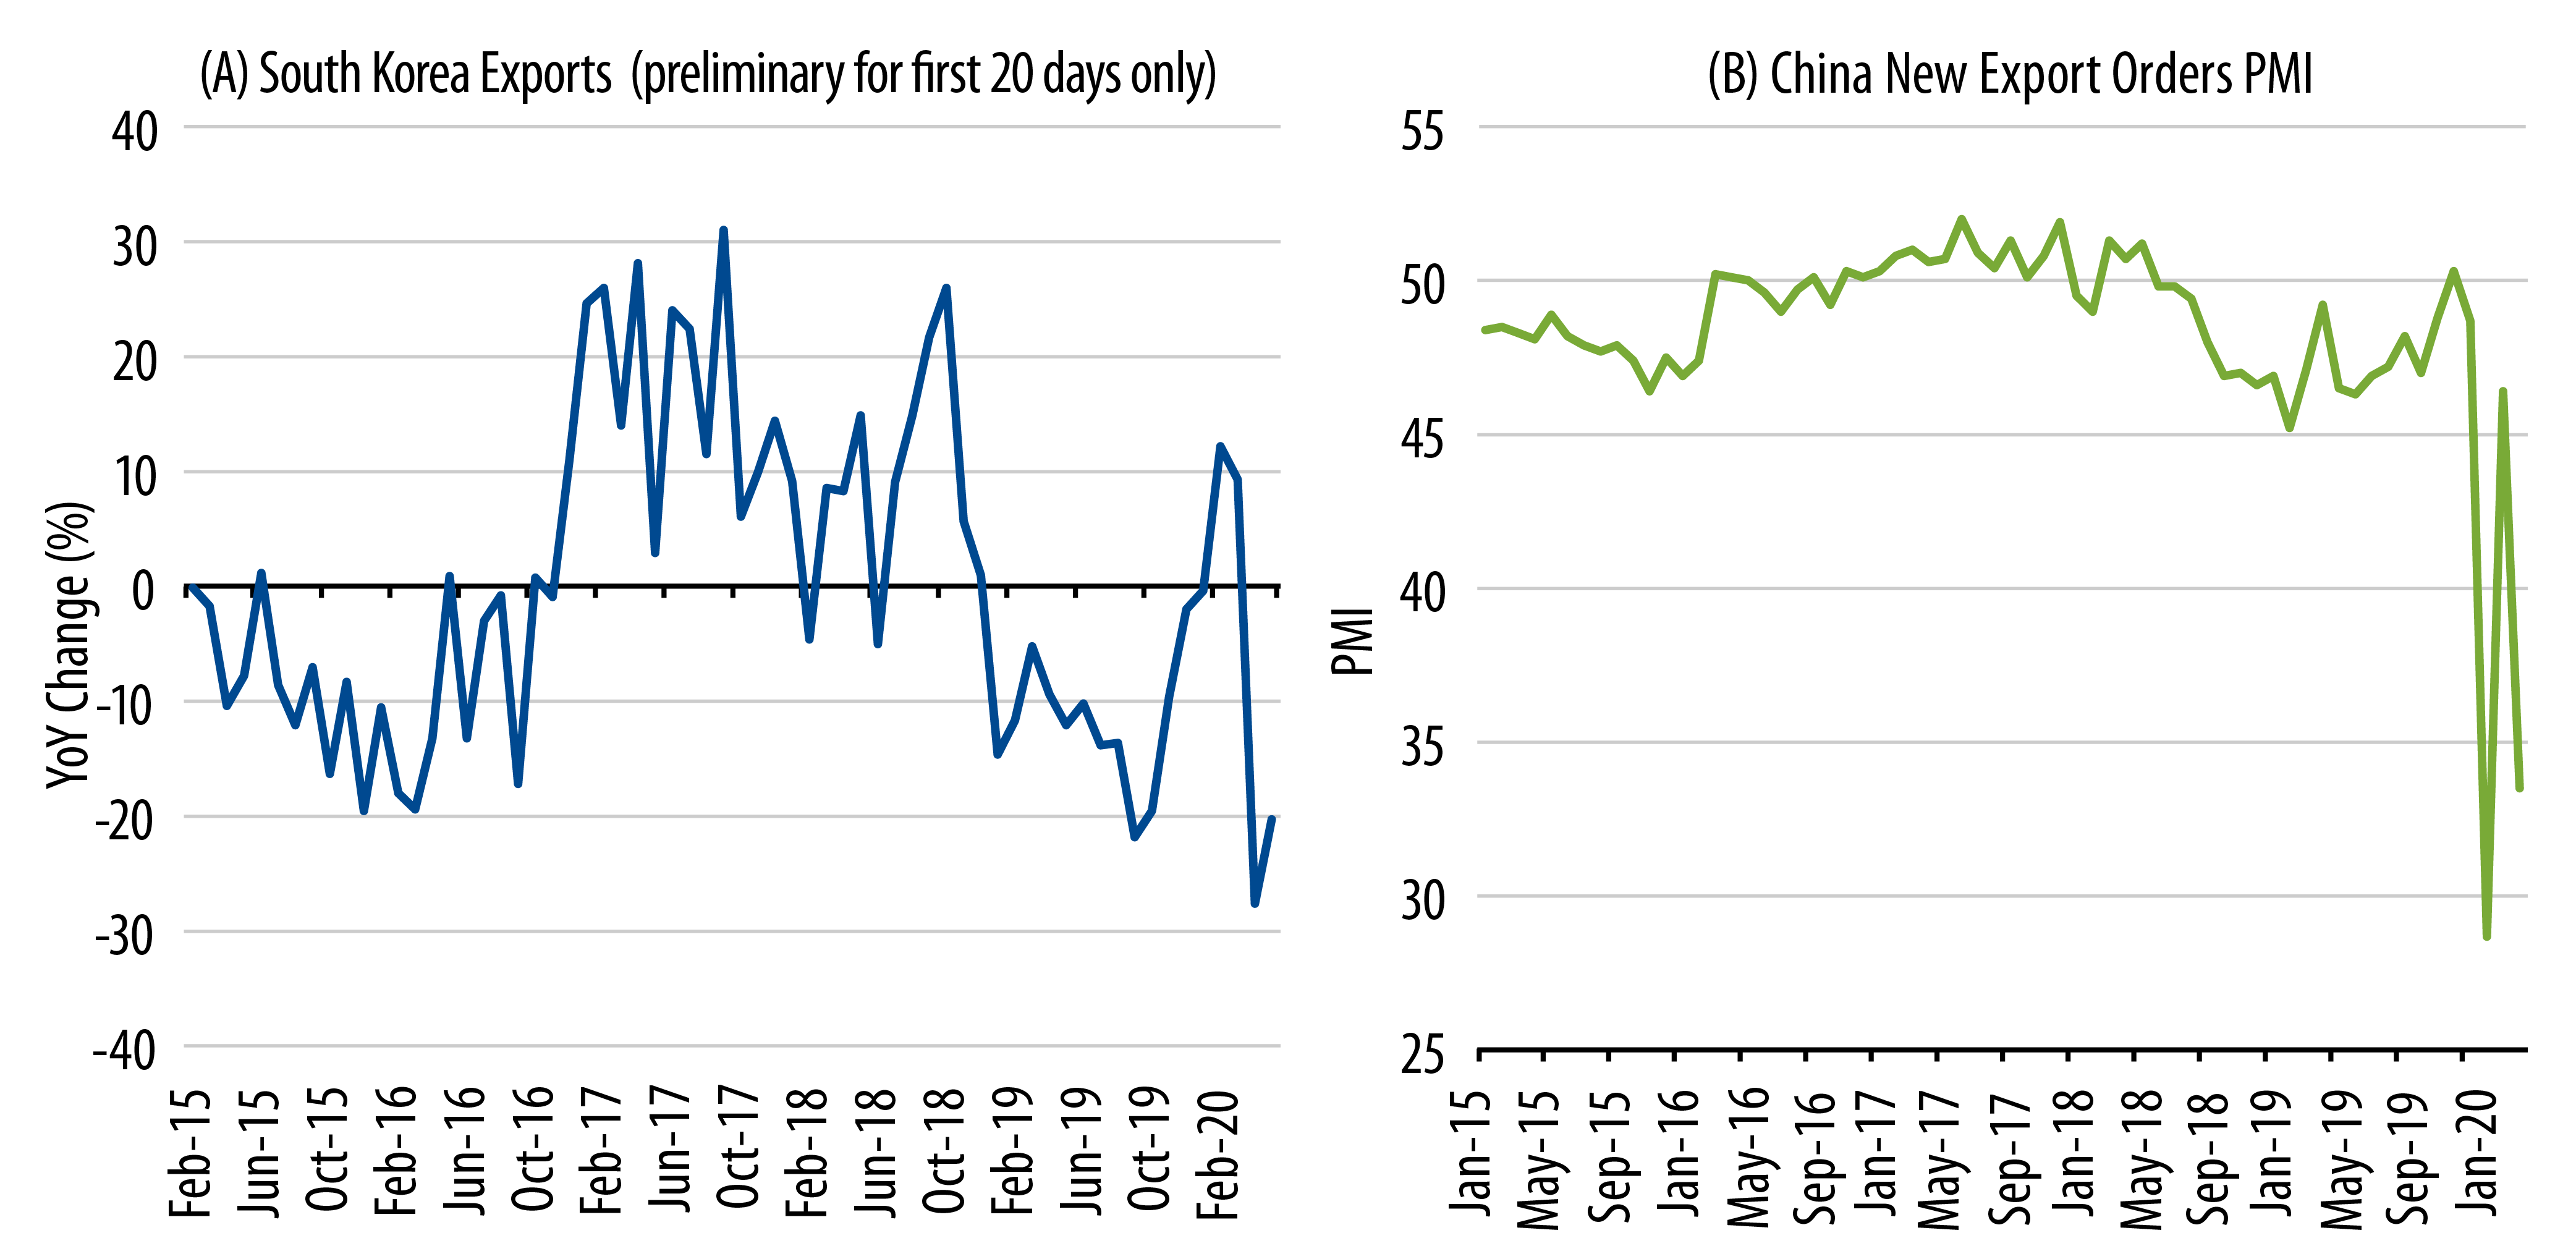
External Sector Challenges
The key challenge to a robust post COVID-19 economic recovery in North Asia lies on the external front. The pandemic has led to overseas demand destruction and supply chain disruption amid a backdrop of increasing US-China geopolitical tensions.
Conclusion
Domestic activity indicators for North Asia show a “return to normalcy,” particularly from the supply side (e.g., fuel consumption). Discretionary expenditure recovery is “Nike swoosh”-shaped, with the average consumer affected by job uncertainty and social distancing concerns. The key vulnerability to the post COVID-19 economic recovery lies on the external front. If developed markets were to be impacted by a sizable second wave of viral infection, the external sector will be the recovery’s Achilles heel.
Small open Asia “hub” economies (e.g., HK and Singapore) will suffer disproportionally from trade disruptions and travel restrictions in the aftermath of the COVID-19 pandemic without the cushion from large domestic demand like from mainland China.