skip navigation
Blog

Stay up to date on timely topics and market events. Subscribe to our Blog now.

MARKETS
13 April 2021

Weekly Municipal Monitor—Infrastructure Policy Begins to Take Shape

By Robert E. Amodeo, Bud Littman

Stay up to date on timely topics and market events. Subscribe to our Blog now.

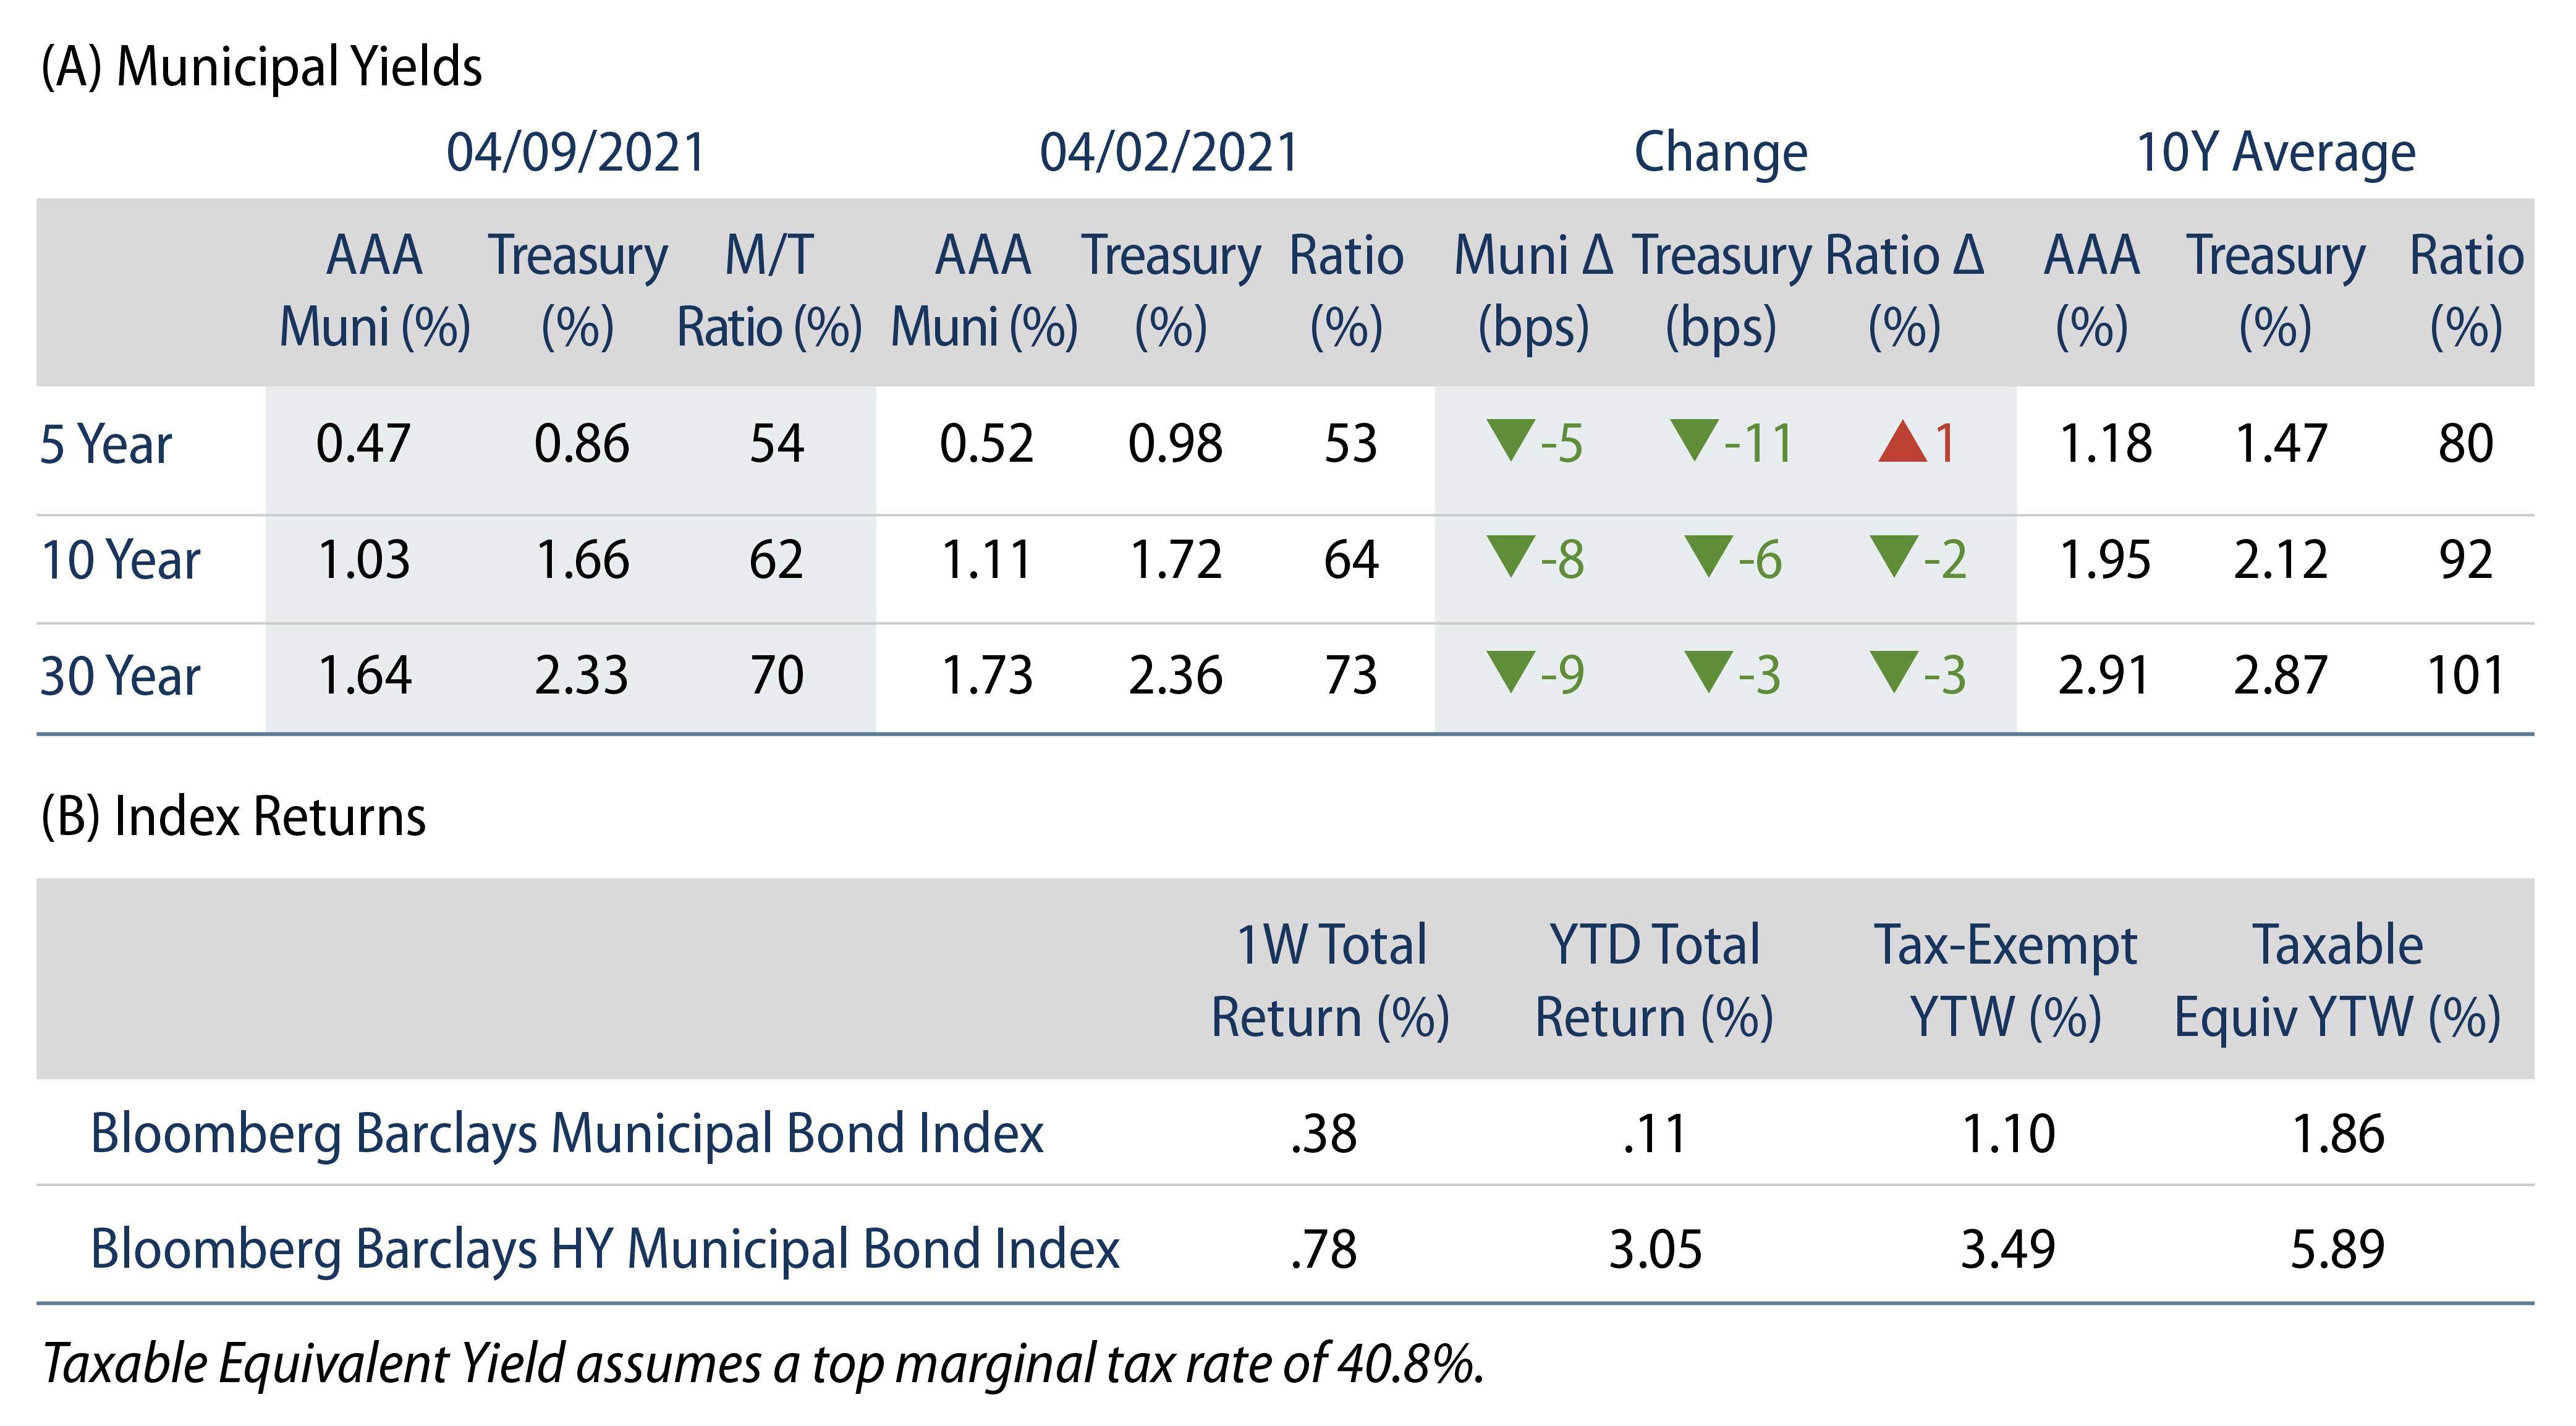
Municipal Yields Moved Lower Across the Curve with Treasuries

US municipal yields moved lower across the curve as munis outperformed Treasuries in intermediate and long maturities. Fund flows remained robust as supply picked back up to elevated levels. The Bloomberg Barclays Municipal Index returned 0.38%, while the HY Muni Index returned 0.78%. This week we explore the latest infrastructure developments following the release of President Biden’s $2.3 trillion American Jobs Plan.

Municipal Mutual Funds Inflows Continue their Record Pace

Fund Flows: During the week ending April 7, municipal mutual funds recorded $2.1 billion of net inflows. Long-term funds recorded $1.7 billion of inflows, high-yield funds recorded $821 million of inflows and intermediate funds recorded $259 million of inflows. Net inflows year to date (YTD) totaled $35.6 billion.

Supply: The muni market recorded $10.1 billion of new-issue volume during the week, returning back to elevated levels following a holiday-shortened week. Total issuance YTD of $118 billion is up 24% from last year’s levels, with tax-exempt issuance 21% higher and taxable issuance 32% higher. This week’s new-issue calendar is expected to decline to $7.8 billion (-23% week-over-week). The largest deals include $827 million taxable Pennsylvania Economic Development Financing Authority and $634 million Alabama Department of Corrections Facilities Project transactions.

This Week in Munis: Infrastructure Policy Begins to Take Shape

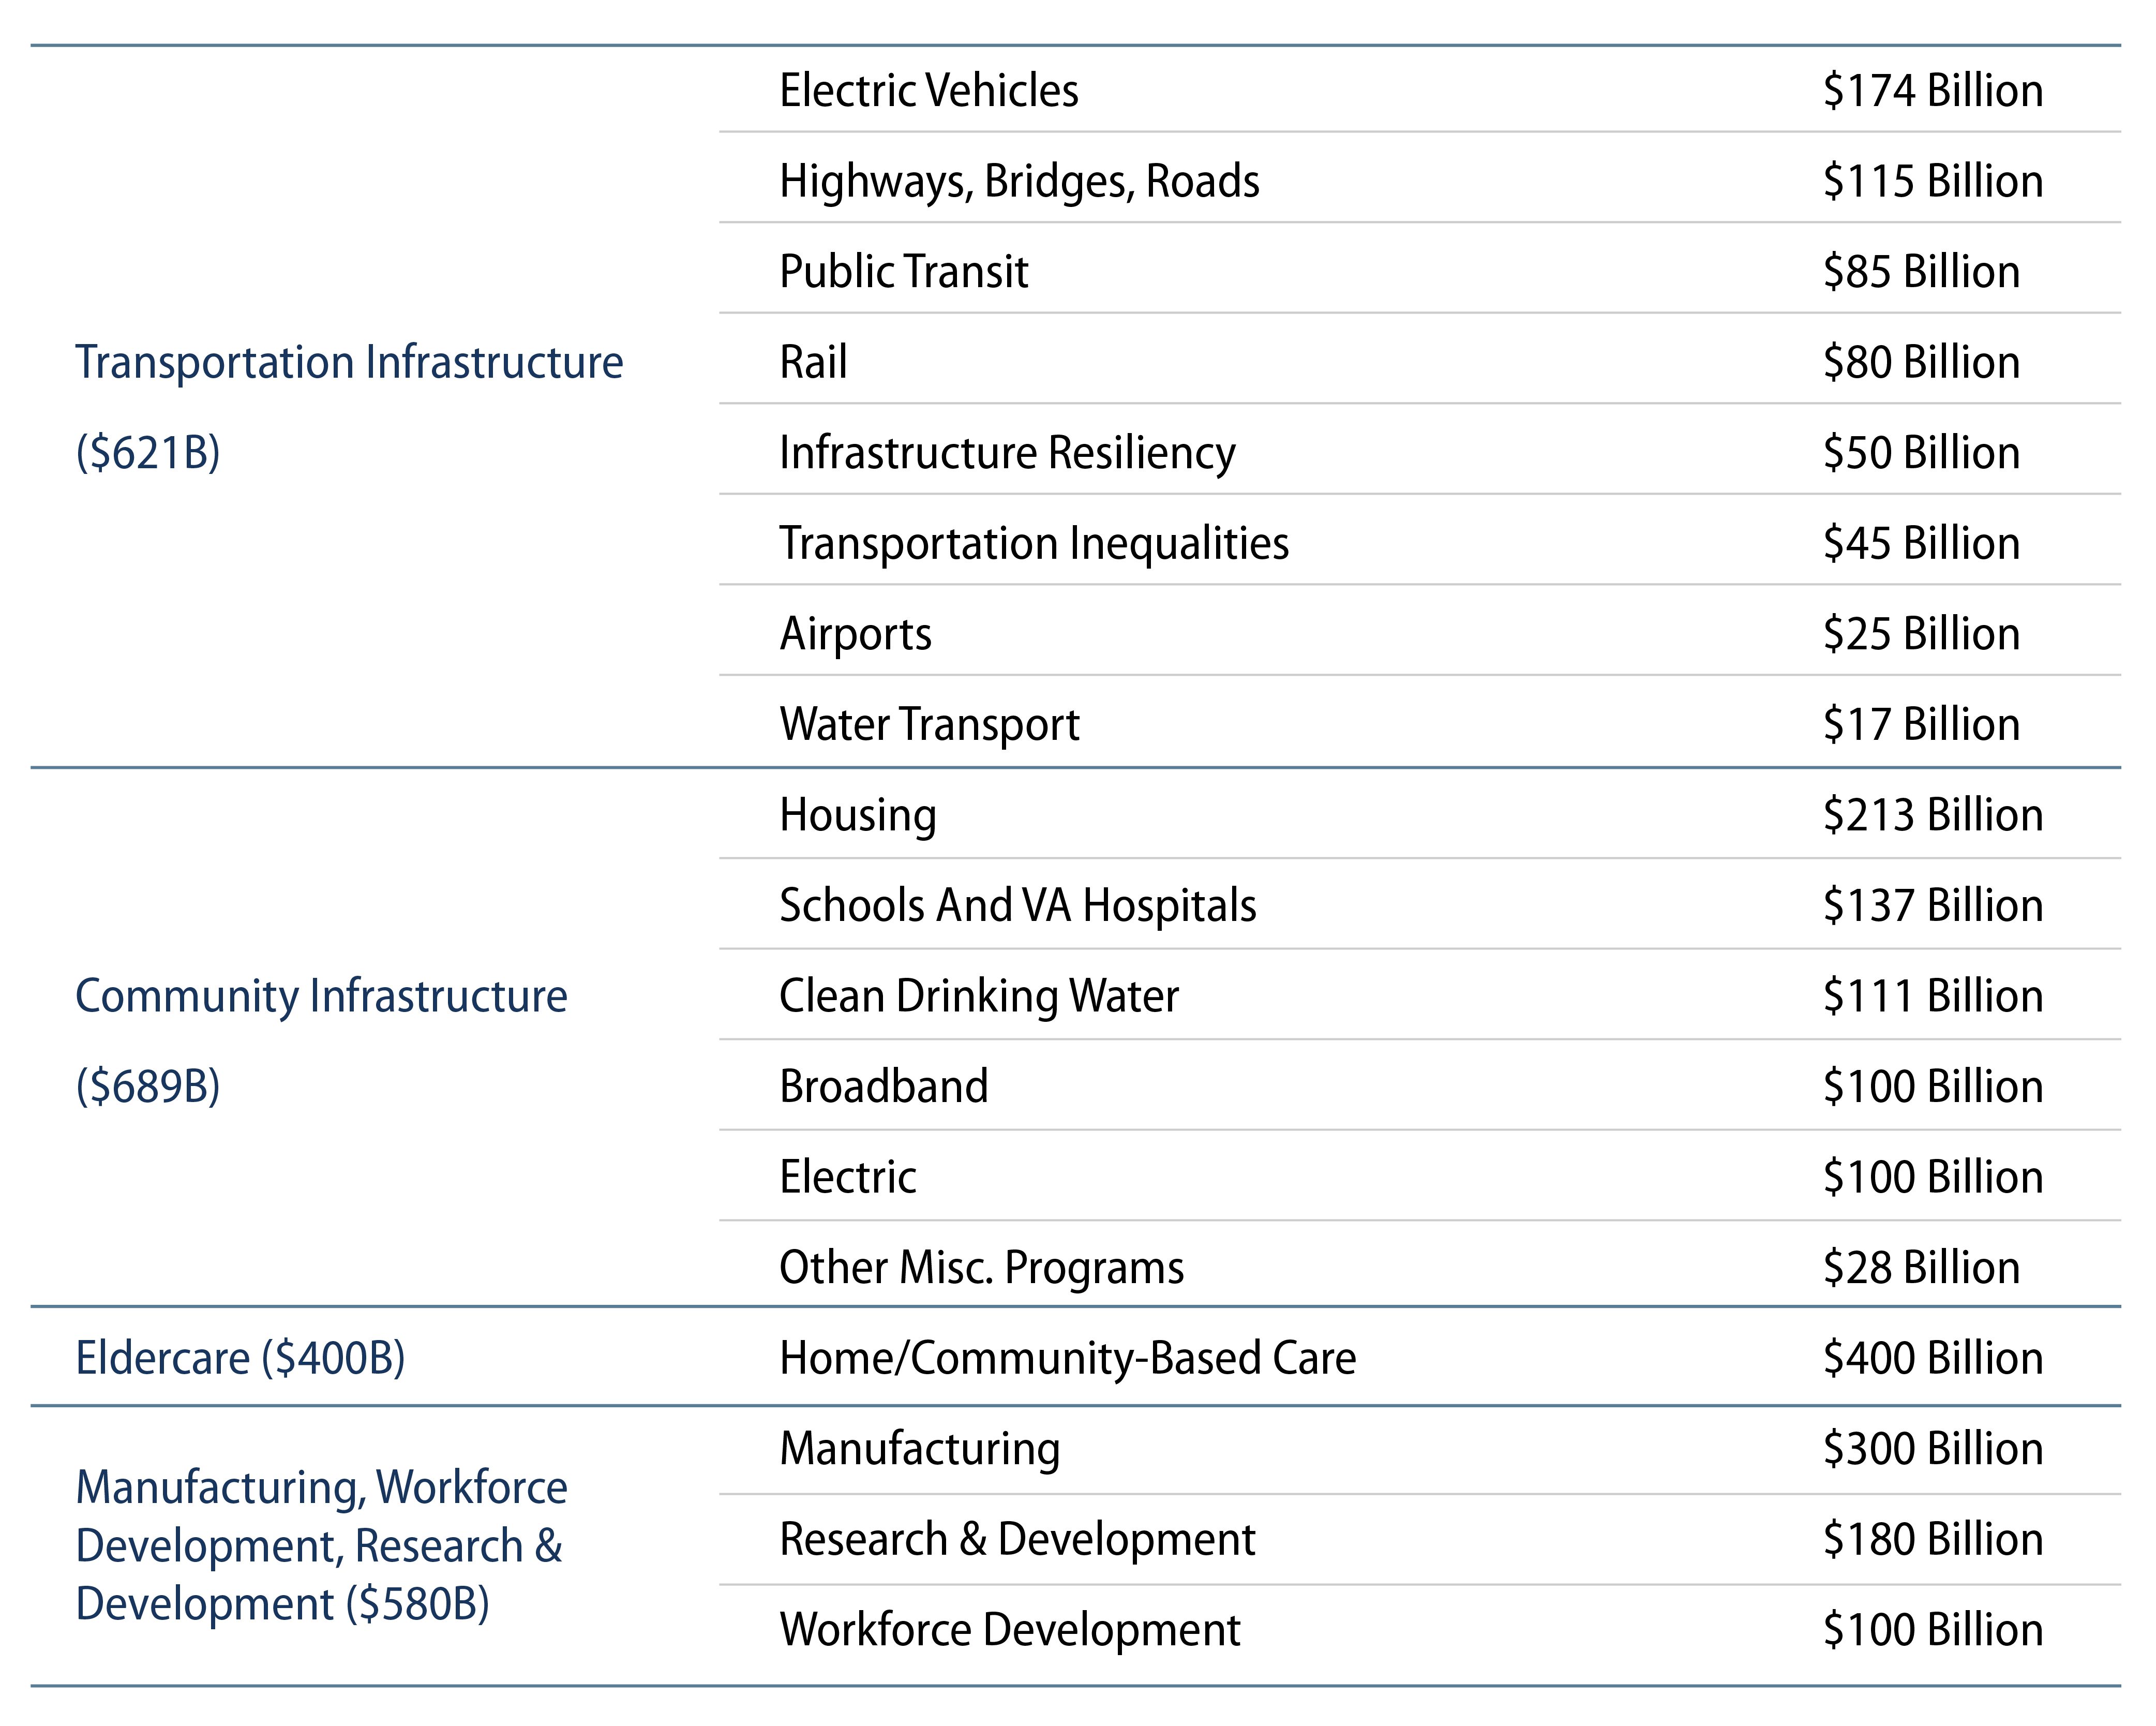
President Biden released his long awaited eight-year, $2.3 trillion American Jobs Plan, which is focused on transportation, water, housing, schools and health care infrastructure—all municipal sectors that would benefit from increased federal funding. The plan specifically dedicates $621 billion to modernizing roads, bridges, railroads, public transit and airports. The plan also pledges $650 billion to affordable housing, water, electric, rural broadband and public school infrastructure.

The infrastructure plan would be positive for domestic economic growth and infrastructure spending that has declined in recent years to below 2.0% of GDP. The plan’s annual infrastructure spending is equivalent to approximately 1.3% of 2020 GDP, and the measure would bring infrastructure spending back near historical average levels at approximately 2.5% of GDP.

While infrastructure support is bipartisan, we anticipate the scope of spending that includes non-traditional infrastructure items to remain an obstacle considering the thin Democratic majority. Robust pandemic-related stimulus, along with recent positive labor market performance may limit congressional willingness to support additional spending measures.

Exhibit 1: The $2.3 Trillion American Jobs Plan
Explore The $2.3 Trillion American Jobs Plan .
Source: Whitehouse.gov. As of 31 Mar 21. Select the image to expand the view.

Questions also remain around how the infrastructure proposal would be funded, and additional clarity is expected to be released in May and June. The President has touted increasing the corporate tax rate from 21% to 28% to fund the plan. Funding mechanics are also unclear, as federally subsidized bond solutions (such as the Obama-era BABs program) remain in the conversation as well as more traditional financing sources such as P3, TIFIA, and PABs (for more information see our prior note on the various infrastructure initiatives). We expect the structure of any bonding incentives to have a material impact on the composition of taxable and tax-exempt municipal market supply technicals over any major infrastructure funding period. Considering the biases to clean energy and climate change initiatives outlined within the plan, any bonding solution should contribute to positive impact investment opportunities for ESG investors.

Exhibit 2: Municipal Bond Yields and Index Return
Explore Municipal Bond Yields and Index Return.
Sources: (A) Muni yields: Thomson Reuters MMD; Treasury Yields: Bloomberg. As of 11 Apr 21.
(B) Bloomberg. As of 11 Apr 21.
Exhibit 3: Tax-Exempt and Taxable Municipal Valuation
Explore Tax-Exempt and Taxable Municipal Valuation.
Sources: (A) Bloomberg, Western Asset. AAA, AA, A, BBB Corporate Indices. After-tax yield assumes a top effective tax rate of 40.8%. As of 11 Apr 21.
(B) Bloomberg, Western Asset; Taxable Muni Index Corporate comparable used is the long corporate (ex. BBB) to better align credit quality and duration.
© Western Asset Management Company, LLC 2024. The information contained in these materials ("the materials") is intended for the exclusive use of the designated recipient ("the recipient"). This information is proprietary and confidential and may contain commercially sensitive information, and may not be copied, reproduced or republished, in whole or in part, without the prior written consent of Western Asset Management Company ("Western Asset").
Past performance does not predict future returns. These materials should not be deemed to be a prediction or projection of future performance. These materials are intended for investment professionals including professional clients, eligible counterparties, and qualified investors only.
These materials have been produced for illustrative and informational purposes only. These materials contain Western Asset's opinions and beliefs as of the date designated on the materials; these views are subject to change and may not reflect real-time market developments and investment views.
Third party data may be used throughout the materials, and this data is believed to be accurate to the best of Western Asset's knowledge at the time of publication, but cannot be guaranteed. These materials may also contain strategy or product awards or rankings from independent third parties or industry publications which are based on unbiased quantitative and/or qualitative information determined independently by each third party or publication. In some cases, Western Asset may subscribe to these third party's standard industry services or publications. These standard subscriptions and services are available to all asset managers and do not influence rankings or awards in any way.
Investment strategies or products discussed herein may involve a high degree of risk, including the loss of some or all capital. Investments in any products or strategies described in these materials may be volatile, and investors should have the financial ability and willingness to accept such risks.
Unless otherwise noted, investment performance contained in these materials is reflective of a strategy composite. All other strategy data and information included in these materials reflects a representative portfolio which is an account in the composite that Western Asset believes most closely reflects the current portfolio management style of the strategy. Performance is not a consideration in the selection of the representative portfolio. The characteristics of the representative portfolio shown may differ from other accounts in the composite. Information regarding the representative portfolio and the other accounts in the composite are available upon request. Statements in these materials should not be considered investment advice. References, either general or specific, to securities and/or issuers in the materials are for illustrative purposes only and are not intended to be, and should not be interpreted as, recommendation to purchase or sell such securities. Employees and/or clients of Western Asset may have a position in the securities or issuers mentioned.
These materials are not intended to provide, and should not be relied on for, accounting, legal, tax, investment or other advice. The recipient should consult its own counsel, accountant, investment, tax, and any other advisers for this advice, including economic risks and merits, related to making an investment with Western Asset. The recipient is responsible for observing the applicable laws and regulations of their country of residence.
Founded in 1971, Western Asset Management Company is a global fixed-income investment manager with offices in Pasadena, New York, London, Singapore, Tokyo, Melbourne, São Paulo, Hong Kong, and Zürich. Western Asset is a wholly owned subsidiary of Franklin Resources, Inc. but operates autonomously. Western Asset is comprised of six legal entities across the globe, each with distinct regional registrations: Western Asset Management Company, LLC, a registered Investment Adviser with the Securities and Exchange Commission; Western Asset Management Company Distribuidora de Títulos e Valores Mobiliários Limitada is authorized and regulated by Comissão de Valores Mobiliários and Brazilian Central Bank; Western Asset Management Company Pty Ltd ABN 41 117 767 923 is the holder of the Australian Financial Services License 303160; Western Asset Management Company Pte. Ltd. Co. Reg. No. 200007692R is a holder of a Capital Markets Services License for fund management and regulated by the Monetary Authority of Singapore; Western Asset Management Company Ltd, a registered Financial Instruments Business Operator and regulated by the Financial Services Agency of Japan; and Western Asset Management Company Limited is authorised and regulated by the Financial Conduct Authority ("FCA") (FRN 145930). This communication is intended for distribution to Professional Clients only if deemed to be a financial promotion in the UK as defined by the FCA. This communication may also be intended for certain EEA countries where Western Asset has been granted permission to do so. For the current list of the approved EEA countries please contact Western Asset at +44 (0)20 7422 3000.