

Last month, we discussed how we think depressed inflation for the next 10 years is very unlikely. Here, we check in on inflation rates given the latest data.
As economic activity virtually came to a sudden stop due to the global spread of the coronavirus/COVID-19 and energy prices plunged at the same time, market-traded or so-called breakeven inflation* has collapsed globally. In our view, this has created opportunities in certain global inflation-linked markets, both from a value investment and portfolio construction perspective.
The table shows the current level of 10-year breakevens compared to two long-term average headline inflation measures: 1) the lowest average 10-year inflation period recorded since inflation records began, and 2) the average inflation rates since 2000. The final column denotes whether there is currently central bank purchasing activity of inflation-linked bonds in the countries included.
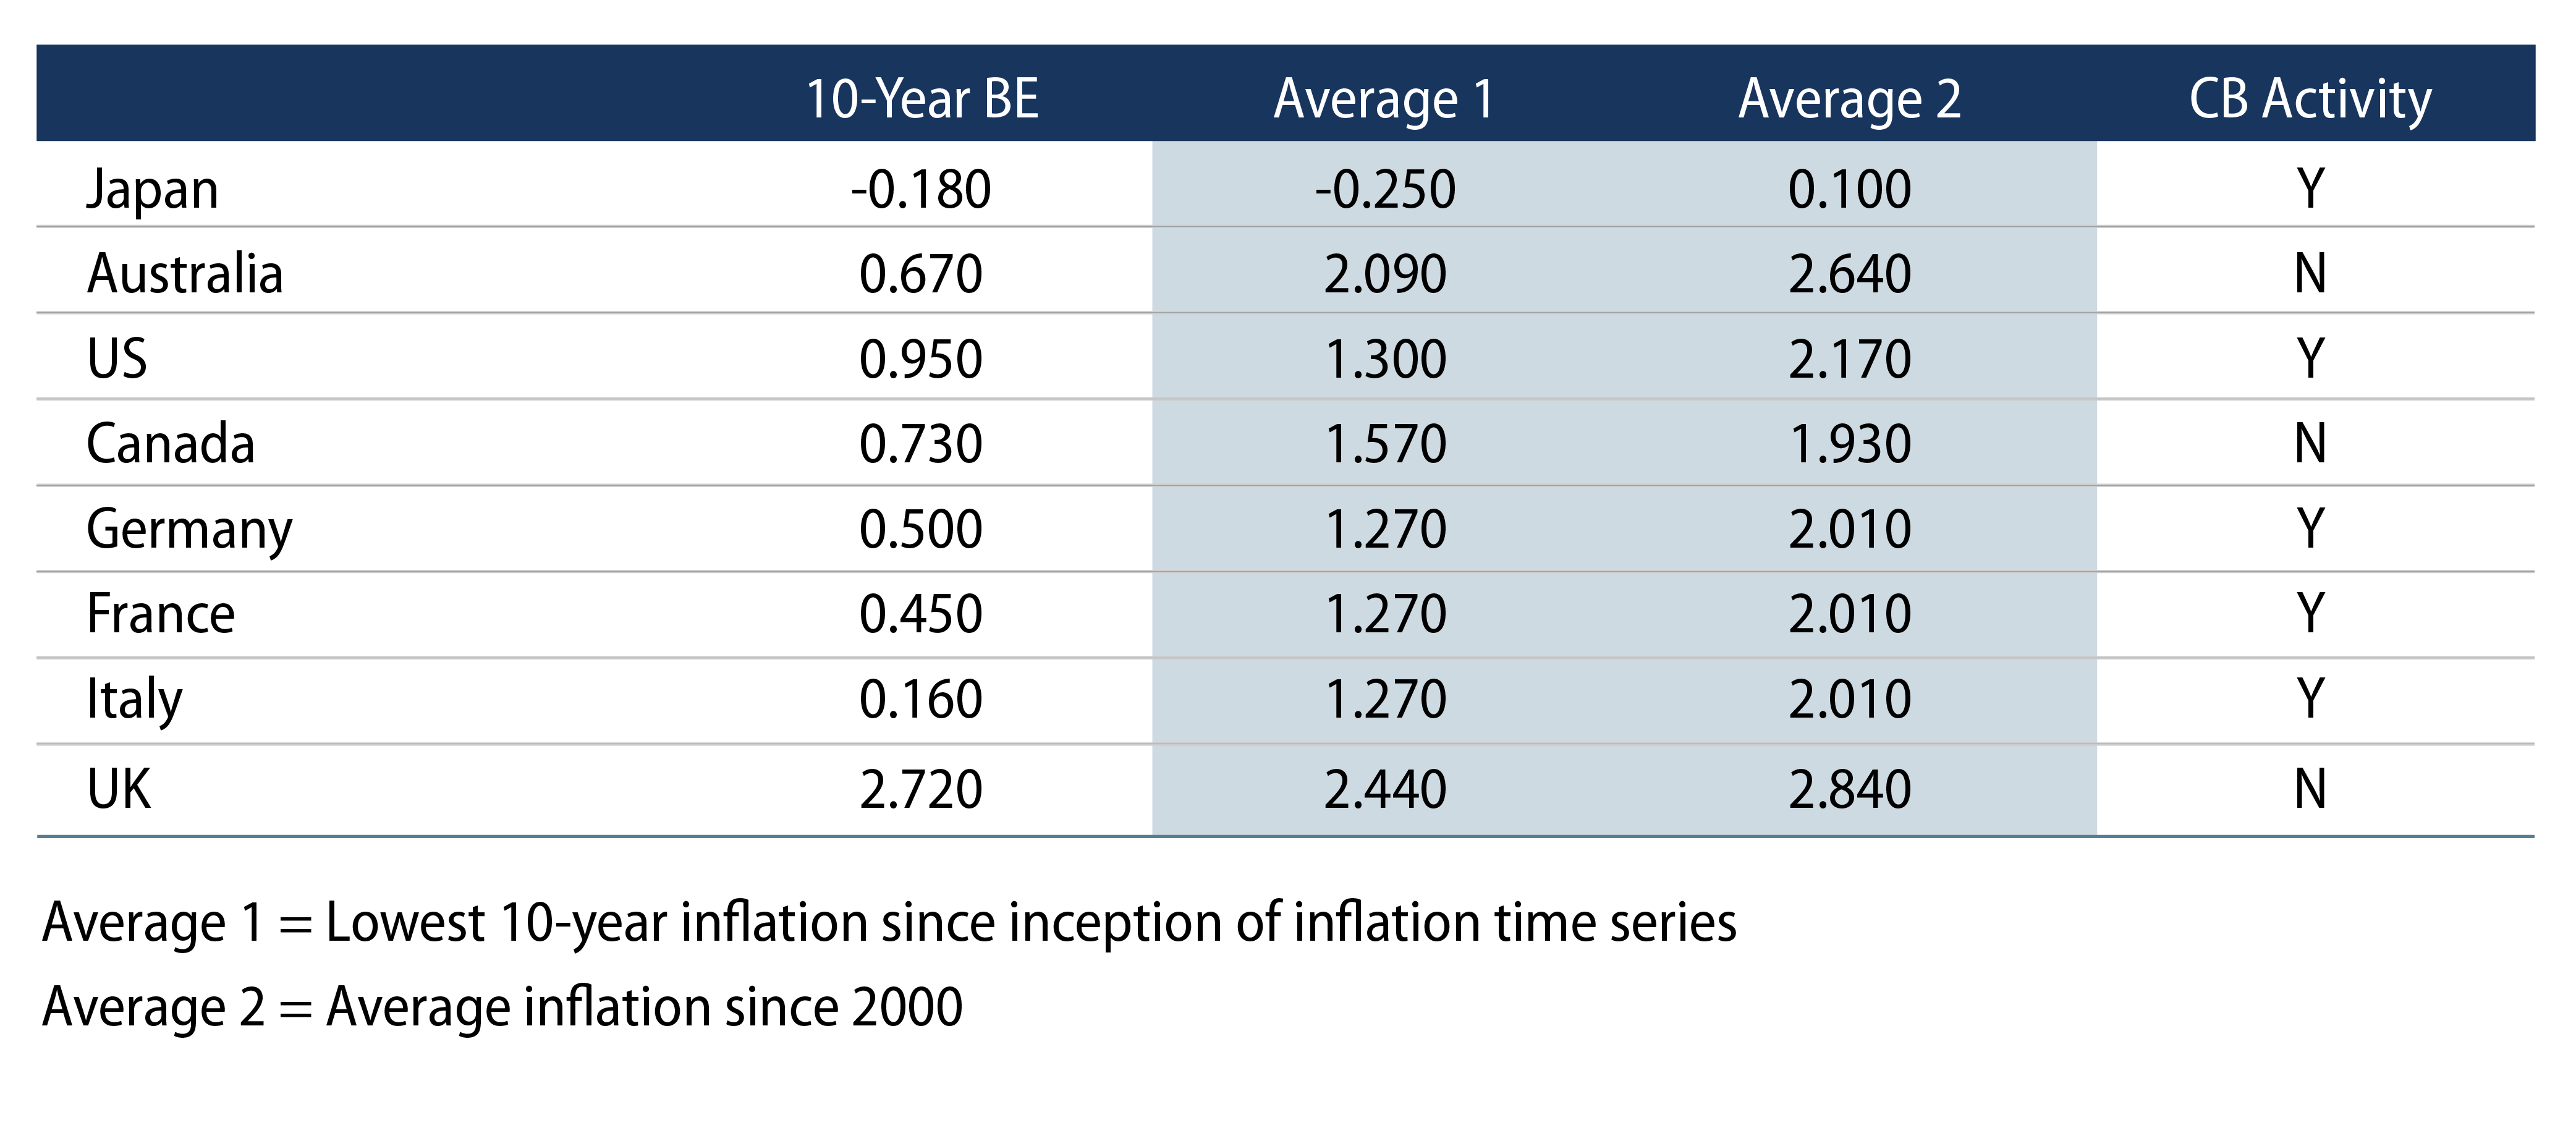
As you can see from the table, in most countries, with the exception of the UK and Japan, the current level of inflation breakevens is meaningfully below the lowest historic run rate of 10-year average inflation, and substantially lower than the average inflation rate since 2000. The reasons for the collapse are fourfold: 1) oil prices, 2) a beta** to nominal markets, 3) market illiquidity and 4) the global financial crisis (GFC). Recent moves in breakevens are reminiscent of the GFC in 2008/2009, but have not yet proved as extreme given that the level of financial market leverage in 2020 is currently lower than it was during the last global recession.
In particular, oil prices have fallen sharply due to the COVID-related drop in global traffic, OPEC price wars and supply cuts that failed to match the demand shortfall. This is likely to push headline inflation substantially lower for a year. Unless oil prices keep falling, however, base effects will imply a rebound in headline inflation a year hence ceteris paribus. Generally, the shorter the maturity of the index-linked bond, the greater is its beta to oil prices. Yet here we see 10-year inflation pricing a long-term disinflationary bias. Why?
Typically the beta** between 10-year nominals and index-linked bonds is around 70%. Given that index-linked bonds are generally less liquid than their nominal counterparts, in times of market panic and demand for cash this beta can fall to zero and sometimes even turn negative. In this instance, the beta was around 20%. In the past, this has been addressed via central bank action, rate cuts and then QE. This was the course of action that most central banks took in March. Hence the 50-bp rebound in US 10-year breakevens.
Yet breakevens still remain at low levels, partly because the last factor—the likely duration and scale of the economic damage from the coronavirus—is very difficult to assess. From an inflation perspective there is some degree of balancing out with both supply and demand for goods and services falling sharply. Policymakers are trying to ensure that these do not become permanent and have aggressively implemented various programs to help support companies and protect incomes. Early indications from Asian economies that experienced the first large-scale viral outbreaks are encouraging, with measures of economic activity gradually moving towards pre-crisis norms. Fiscal support is key in this area and it’s encouraging that many stimulative measures are contingent on the duration of the outbreak. While we do not know how the path of the virus will proceed, we do know that fiscal support will be ongoing and when the impact lessens, this support should help growth and inflation to rebound.
In global portfolios and dedicated inflation-linked portfolios we have been scaling into long breakeven positions in the US and eurozone whilst maintaining our exposure to Japanese breakevens.
Referencing the table above, we think that gaining a diversified exposure to breakevens makes sense. Specifically, adding to exposures at what we believe are attractive medium-term breakeven levels in countries that are seeing strong central bank support, including exposures in the higher-beta Italian market. Against this, where possible, we have been reducing breakeven exposure in the UK as we believe this is the most expensive market, in conjunction with selling the Canadian dollar to help ride out the near-term volatility in oil prices. Last, we have an overweight in Japanese real yields, which does not tally with the table above in terms of value but with nominal yields controlled within tight ranges, it is inflation-linked bonds that have a higher beta to economic data. We will keep this in mind in terms of portfolio construction when looking to other markets that could be adopting nominal yield targets.
*The difference in yield between a nominal bond and an inflation-linked bond of the same maturity. For example, a 10-year breakeven inflation rate is the markets’ expectation of average inflation levels over the next ten years.
** The expected co-movement between nominal and real yields. For example, a beta of 70% would imply that for every 10-bp fall in nominal yields, real yields would fall 7 bps and breakevens would fall 3 bps.