

Real consumer spending rose a scant 0.1% in October, with no meaningful revision to the September spending estimate. Real spending in October on merchandise was essentially unchanged (up 0.02%), while that on services rose only 0.17%, with most of that increase coming in health care.
All through this month, we have stated that some or all of the weakness in the October indicators possibly reflect the effects of Hurricane Helene, and this is also the case with the consumer spending data. Then again, as you can see in Exhibit 1, the October spending details were not hugely out of line with preceding months’ experience. The softness in goods spending could also be explained as merely an offset of a relatively strong gain in September, while the October change in ''underlying'' services spending, as also shown in Exhibit 1, is of a piece with previous months.
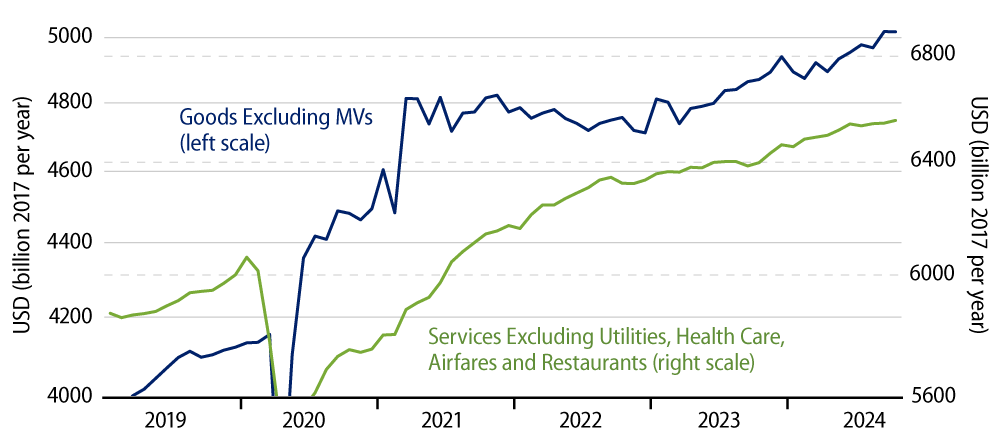
The aggregates depicted in Exhibit 1 abstract from various especially volatile spending components. As suggested earlier, health care spending has risen especially sharply over the last four months. Meanwhile, the other excluded components have been basically flat recently. The point of all this is that the spending data are clear as mud. The reported October softness may be hurricane effects, but it also may be normal monthly variation.
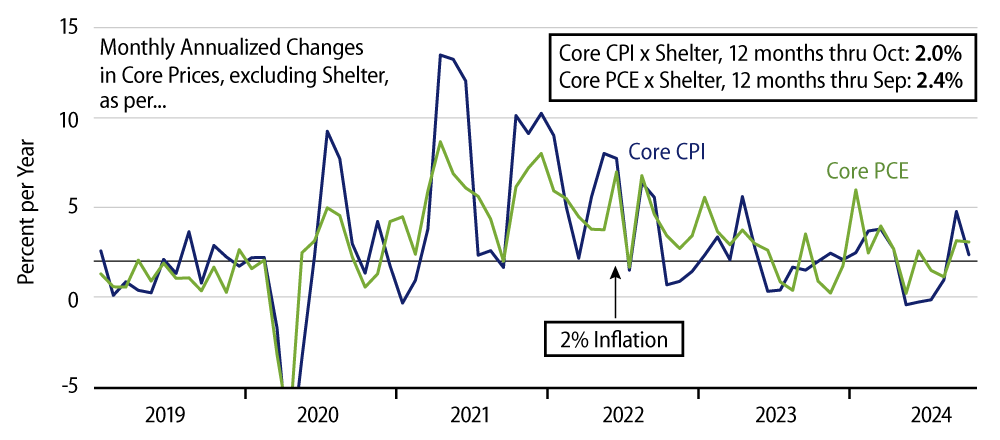
Much the same story can be told with respect to recent inflation data. Yes, monthly core inflation rates have been somewhat elevated the last two months, but this may just reflect the aforementioned hurricane effects. We are talking about a ''bulge'' in price increases on the order of 0.2% over September and October together. That lies within the ranges both of normal measurement error and the possible effects of major cataclysms affecting a portion of the country. Maybe something significant is going on with jobs, housing, spending and inflation, but, unfortunately, we won’t have anything resembling clarity on this issue until another month or two of data are available.
One statistic for which hurricane effects do not seem to be in play is personal income. While almost all indicators were relatively soft this month, personal income rose 0.7%, and even private-sector wage income rose 0.5%. This is only a bit out of whack with the jobs report. While private-sector payrolls declined slightly in October and workweeks were flat, average hourly wages rose 0.4%.
So, total private-sector weekly earnings within the payroll data rose only slightly less than did reported private-sector wage income—the difference being well within the range of random measurement error. If you believe these two statistics together, the story appears to be that while nonsupervisory workers stayed home somewhat during the hurricanes, their bosses remained on the job and worked longer shifts. As a result, the increase in bosses’ earnings fully offset the decline in nonsupervisory workers’ earnings. That is, if you believe both indicators.
Happy Thanksgiving to all our readers.