

Aggregate US housing starts declined by 9.5% in April, with single-family starts within that total down by 13.4%. The April declines essentially erased March increases that had offset February declines. Obviously, housing starts have exhibited a saw-toothed pattern over recent months.
Within that volatile pattern, however, it is clear that starts, both total and single-family, have been establishing a top over the last six months and declining moderately from that top. This is consistent with a similar top in new-home sales, which actually peaked back in July 2020, three months before starts.
No, this is not an indication of any weakness in the housing market. Even the April level of single-family starts is a good 20% higher than the prevailing levels of 2019. However, it is the rate of increase in housing starts that feeds growth in construction spending, and thus in GDP, and the topping-out in housing starts and residential construction spending means that homebuilding will be at best a source of zero boost to GDP growth over the rest of this year, after having provided a strong boost to GDP growth over the last three quarters.
Usually when discussing homebuilding, we display a chart comparing activity in single-family starts and in new-home sales. However, there is not much new for that chart, given, again, that new-home sales had been signaling “toppy” starts activity for quite some time. Rather, the chart here shows single-family starts by region, just to emphasize how ubiquitous the recent topping-out in starts has been.
As you can see in Exhibit 1, homebuilding in the South is the dominant source of US activity. Add the Northeast and Midwest together, and they still amount to a total only 40% of that in the South. And as you can also see, starts in the South began to top out in 4Q20, months before the February blizzards that many Street analysts have used as an excuse for recent homebuilding softness.
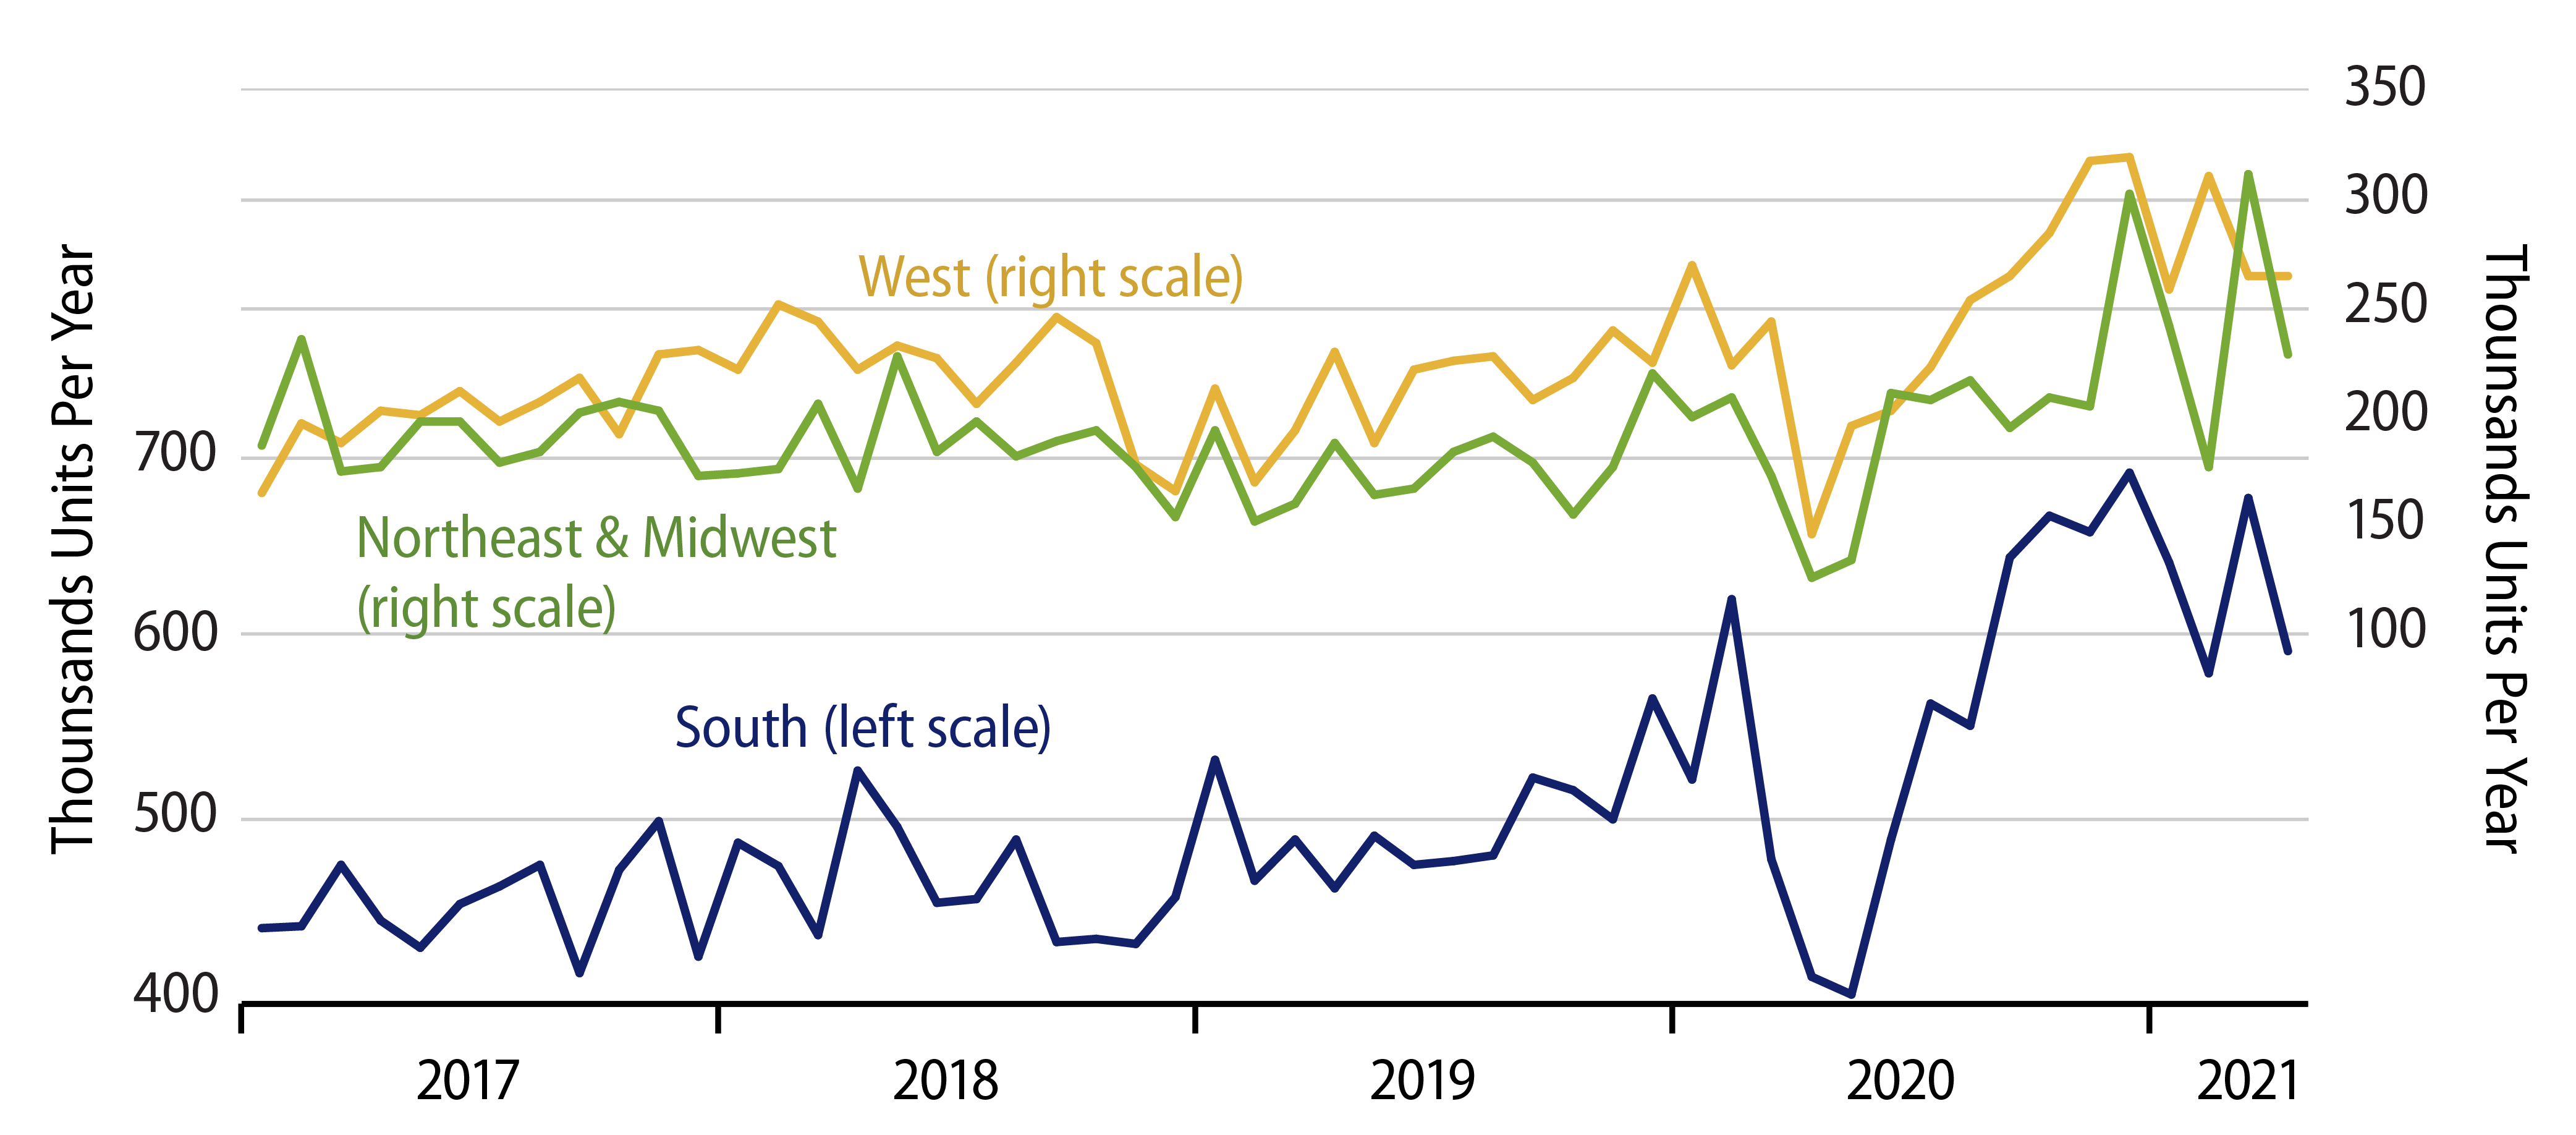
Similarly, starts in the West began to top out in 4Q20 and have shown a relatively steady decline ever since, with no particular evidence of any special declines in February. What you cannot see in Exhibit 1 is that starts in the Northeast remain relatively elevated. But, with only 13% of the activity level of the South, the recent gains in the Northeast are dwarfed by the declines seen in the South and West.
Finally, one can’t blame the topping-out and mild declines in homebuilding on a supposedly scant supply of homes. Inventories of new homes have been rising throughout the last year and over recent months, despite mildly declining levels of starts. And if homes were really in tight supply, builders would be ramping up production further to meet that demand, rather than pulling back as they have.