

The US deficit on real merchandise trade widened slightly in August. Real exports rose 2.3%, compared to a 2.1% increase in real imports. However, imports are sufficiently larger than exports that their smaller gain in percent terms still resulted in a larger gain in real dollar terms. As a result, the real deficit rose from $1.09 trillion to $1.10 trillion on an annualized basis.
It is true that the widening deficit reflects a stronger recovery in the US than abroad. Thus, while real exports in August were still 9.9% below February (pre-Covid) levels, after having been down 29.6% through May, real imports in August were actually up 4.1% from February levels, after having been down 12.2% through May. Still, there is nuance to this generalization, as will see shortly.
Keep in mind also that the US trade deficit had been trending up (i.e., bigger deficits) for most of the last 11 years, that is, throughout the post-GFC expansion, but for a brief respite in 2018-19. So, the increase in the deficit this year is not extraordinary.
As usual, the devil is in the details. Trade trends vary widely across different types of goods. We find it useful to segregate foreign trade flows by the following groups, listed in increasing order of importance: food, motor vehicles, oil, capital goods and everything else. Each of these groups shows its own distinct trade patterns this year.
For food, both exports and imports are fully back to pre-Covid levels, after having seen only mild disruptions during the Covid shutdown. For motor vehicles, both exports and imports are fully back to pre-Covid trends after very sharp declines during the shutdown.
For oil, both exports and imports declined sharply during the shutdown. Oil imports have since rebounded about back to pre-Covid trends, but exports remain substantially depressed, about 30% below pre-Covid trends.
Similarly, both exports and imports of capital goods dropped sharply during the shutdown, exports a bit more so. Since then, imports of capital goods have bounced back to and through pre-Covid trends, but capital goods exports remain some 8% below pre-Covid trends, after having declined about 25% during the shutdown. Capital goods was the lone area where exports declined in August.
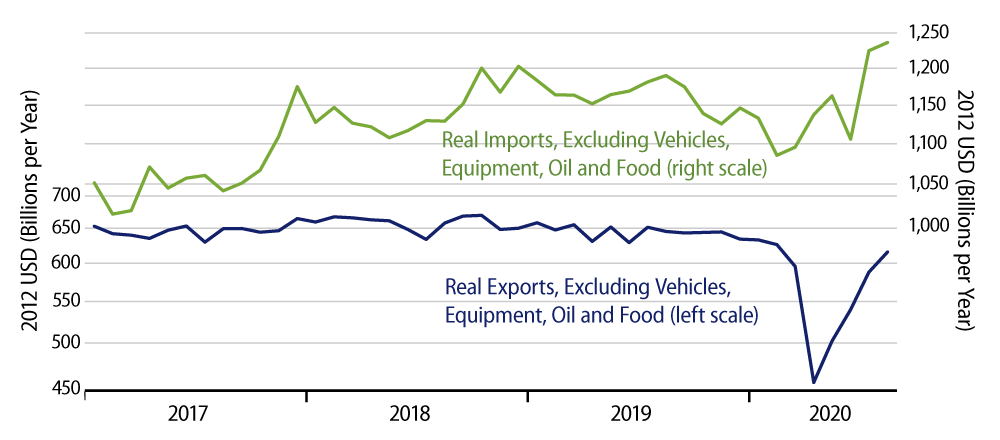
This leaves “other” goods—non-oil raw materials, consumer goods, appliances and intermediate products—accounting for about 40% of all merchandise trade. Here, the real deficit actually declined in August, as exports have risen all the way back to pre-Covid trends, while imports have bounced above pre-Covid trends (Exhibit 1).
Generally, then, across the range of goods trade, the “sore spots” are oil and capital goods, where exports have so far failed to regain pre-Covid form. Imports have rebounded fully across the board, and exports have rebounded fully in other sectors. But, with capital goods and oil accounting for 40% of US exports, the weakness there hurts. It would appear that the sub-standard rebounds so far in oil and capital goods exports reflect a lagging recovery abroad rather than any loss of competitiveness in these domestic sectors.